
Originally published: 05/06/2023 10:19
Last version published: 08/01/2024 09:25
Publication number: ELQ-29640-2
View all versions & Certificate
Last version published: 08/01/2024 09:25
Publication number: ELQ-29640-2
View all versions & Certificate

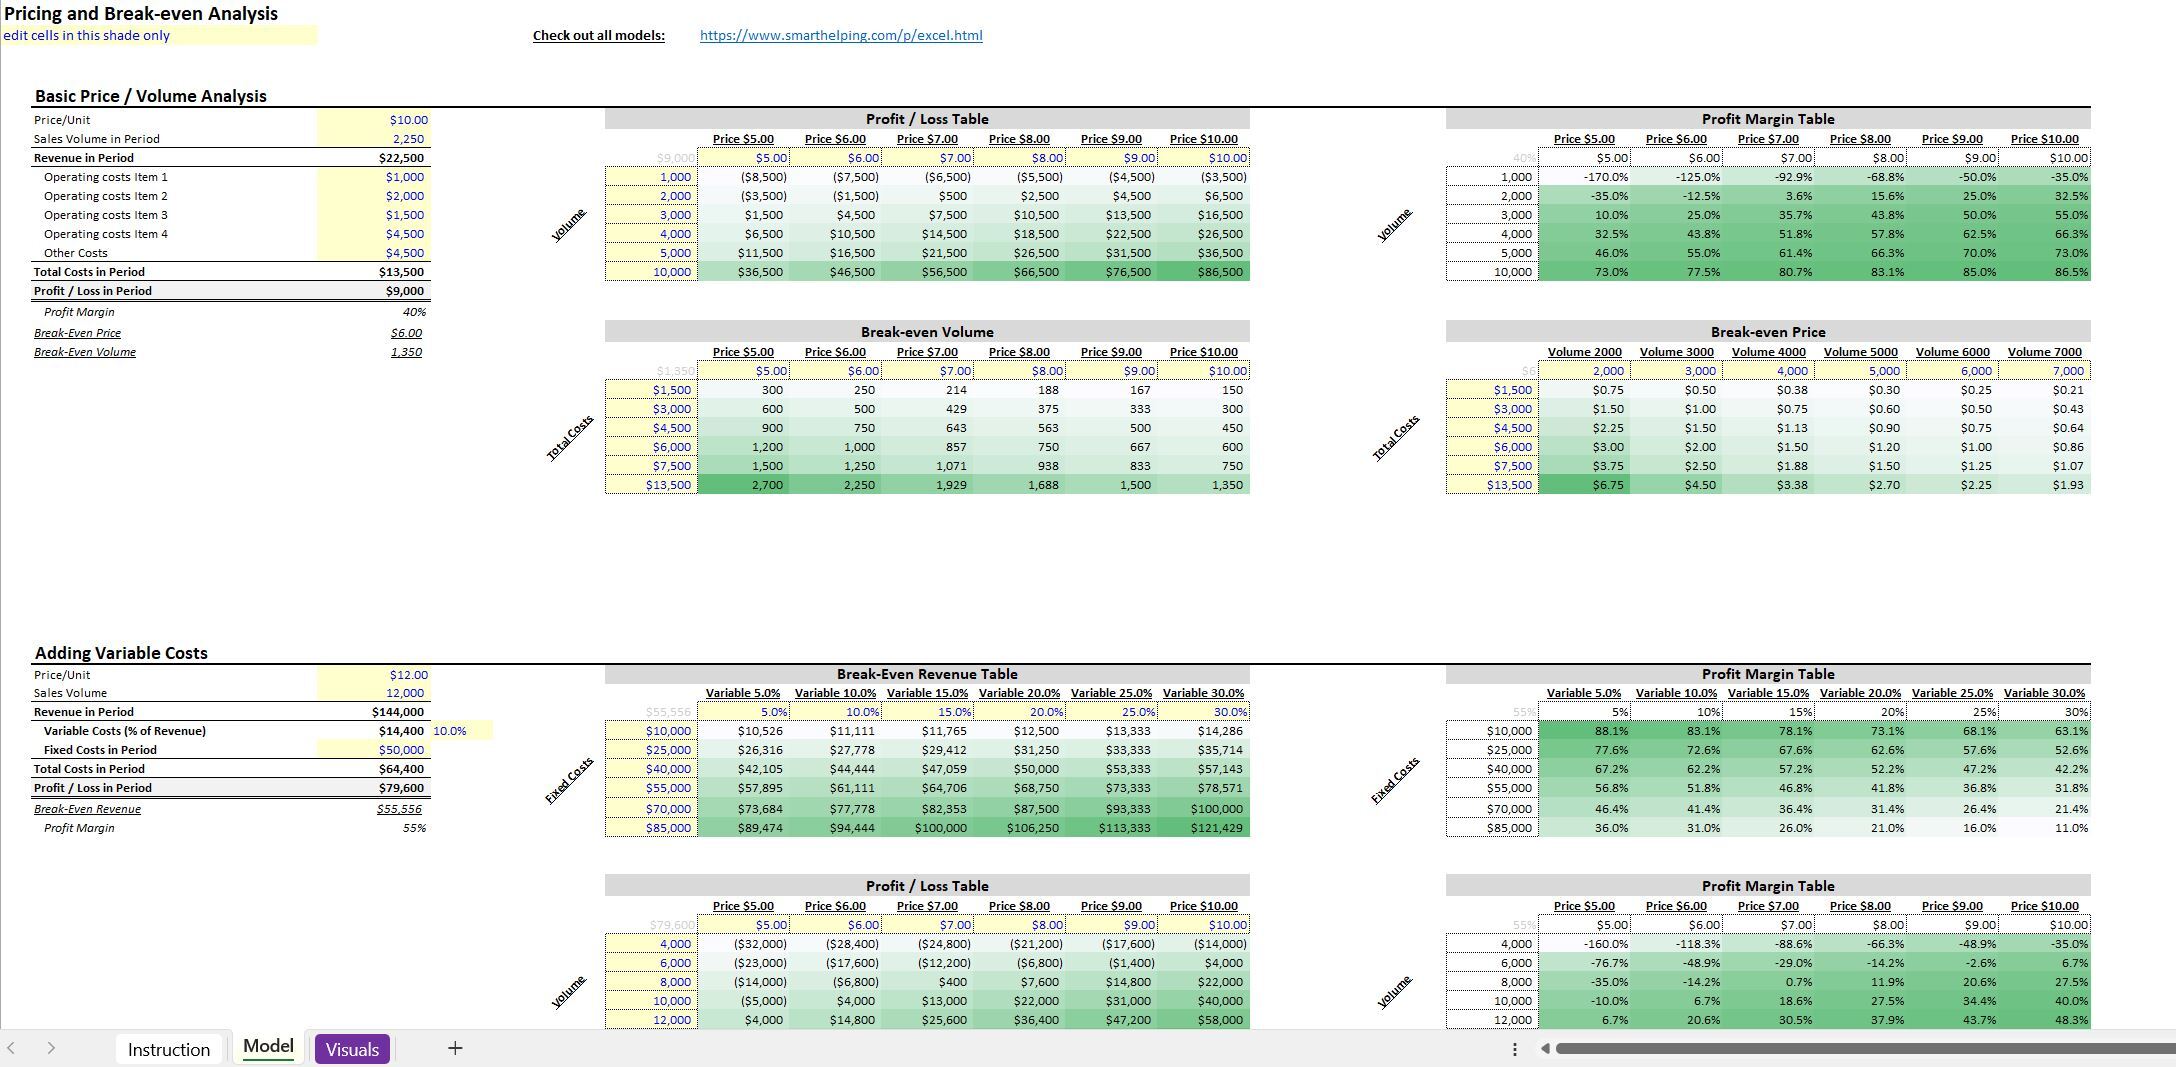
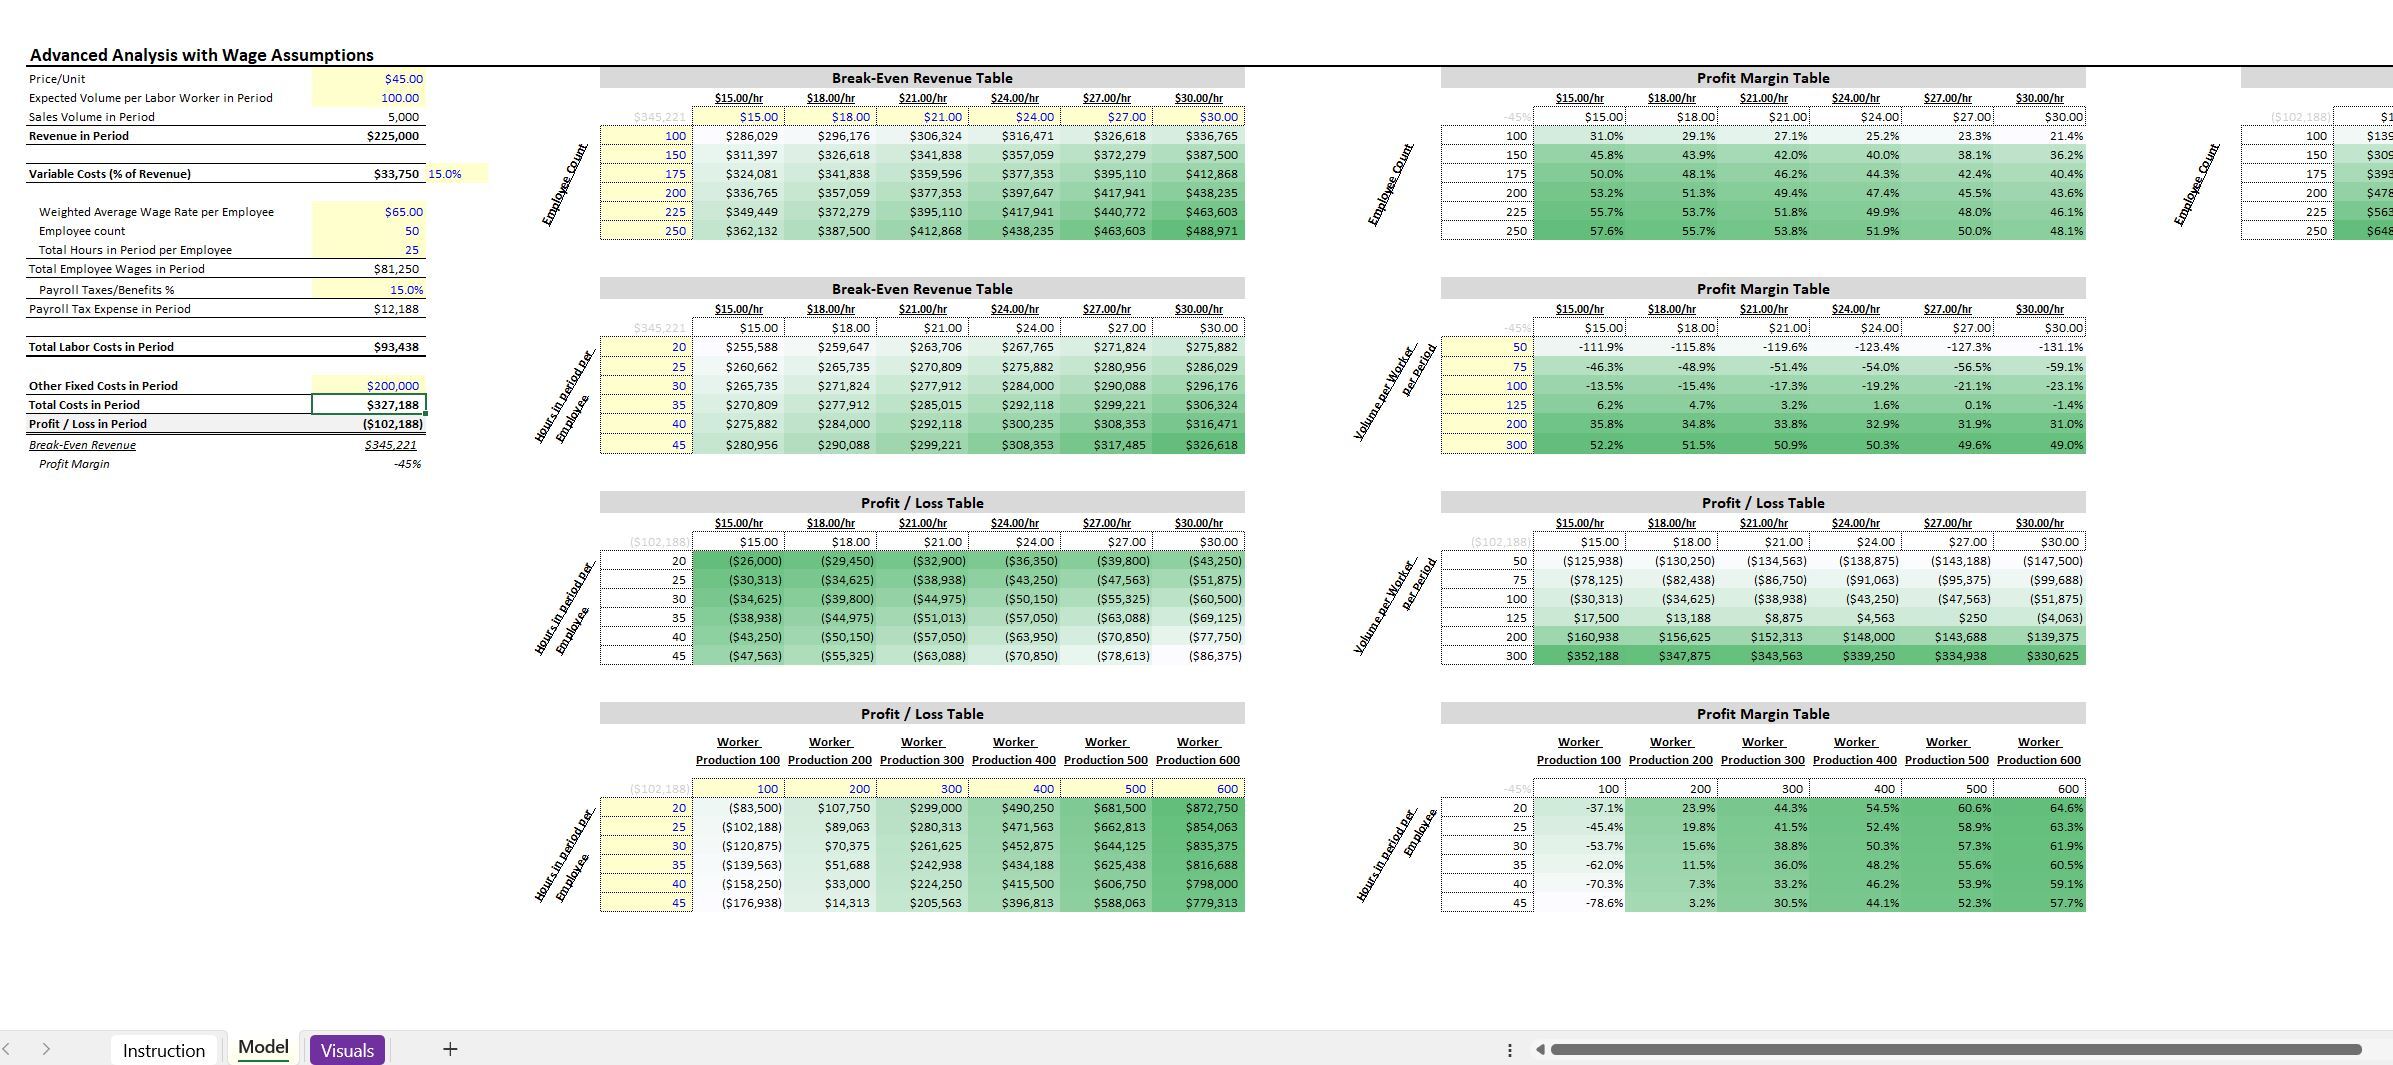
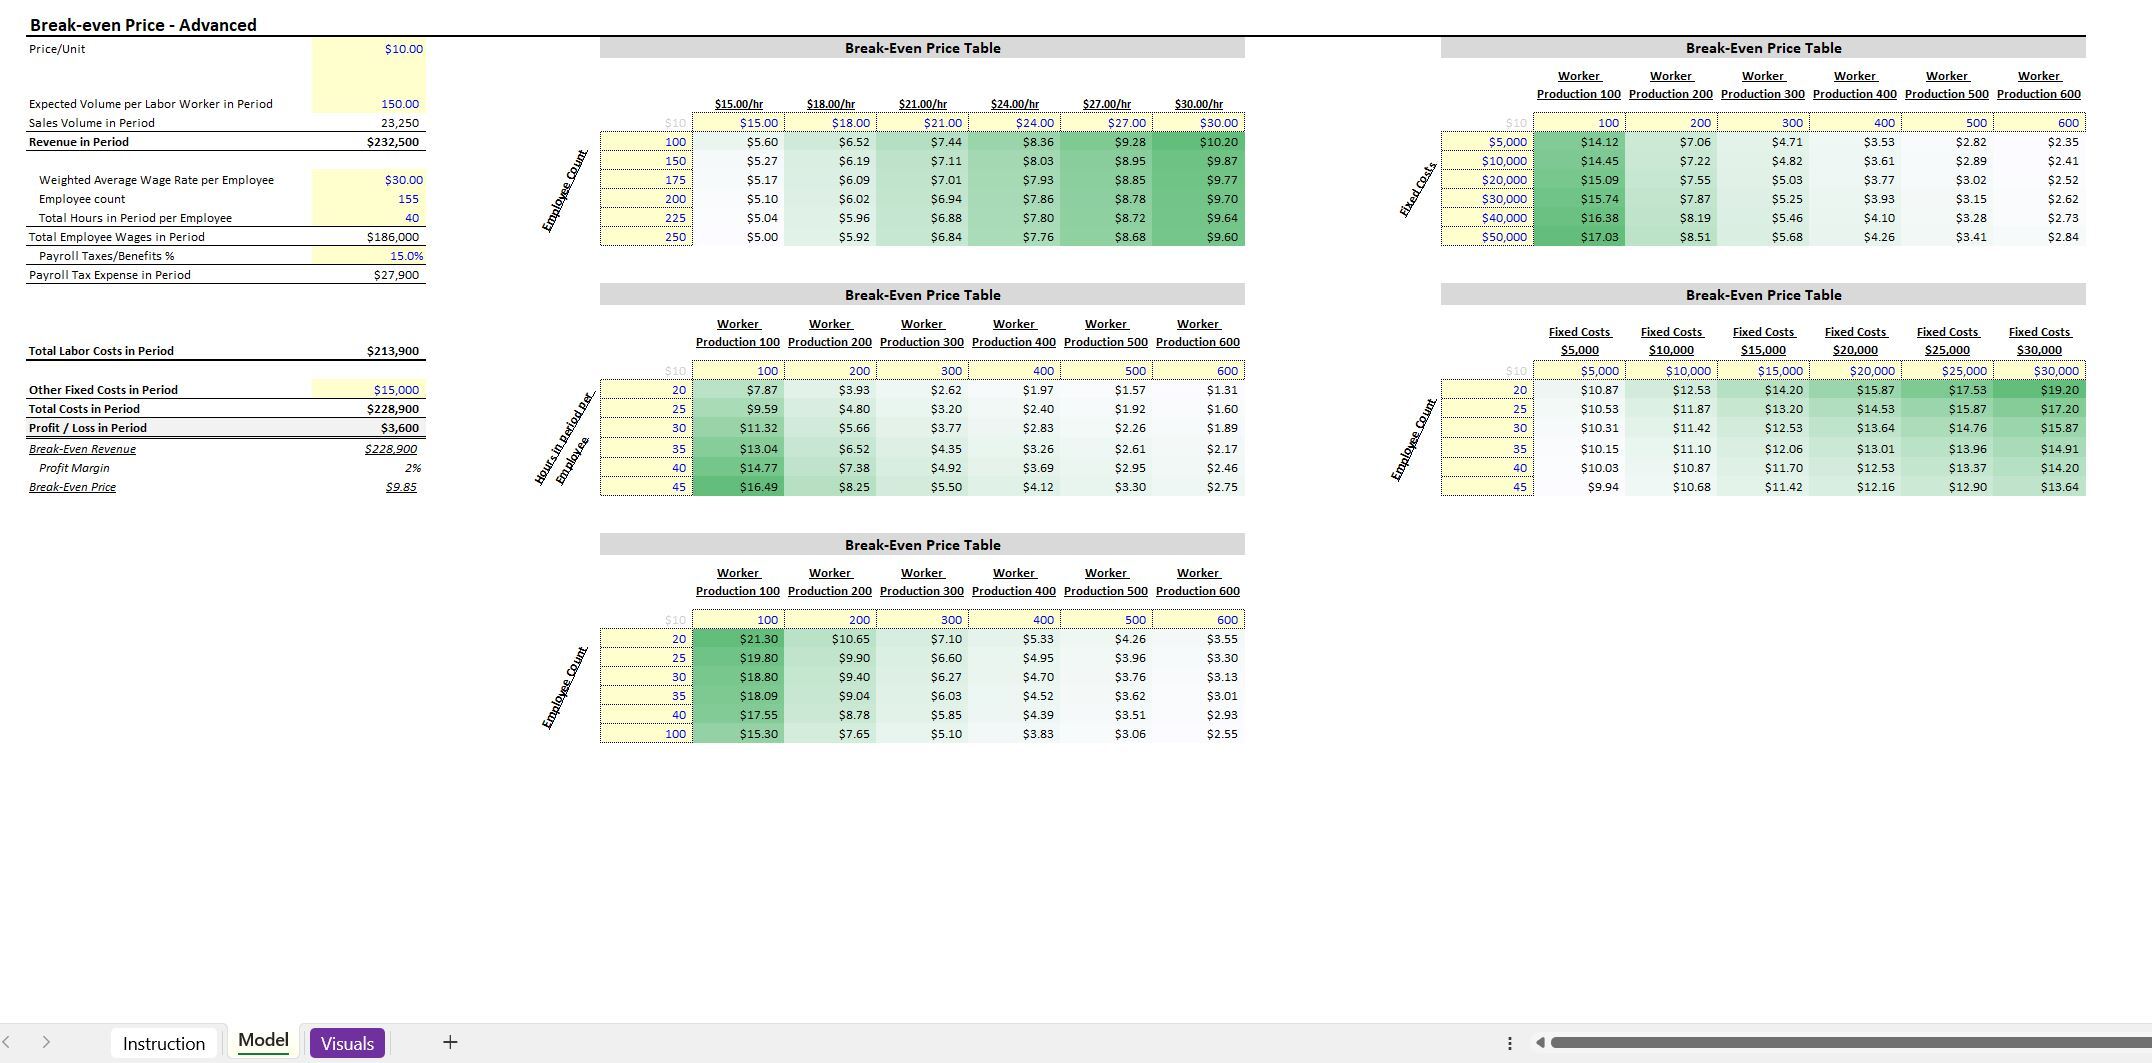
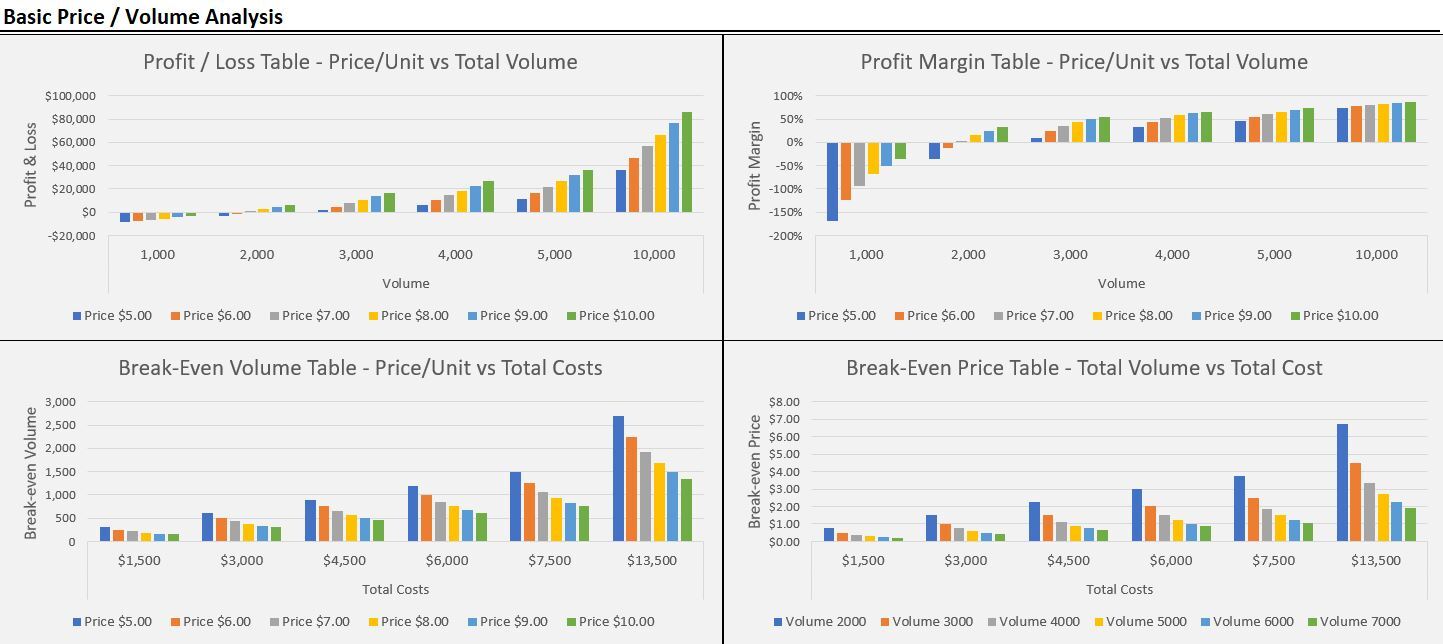
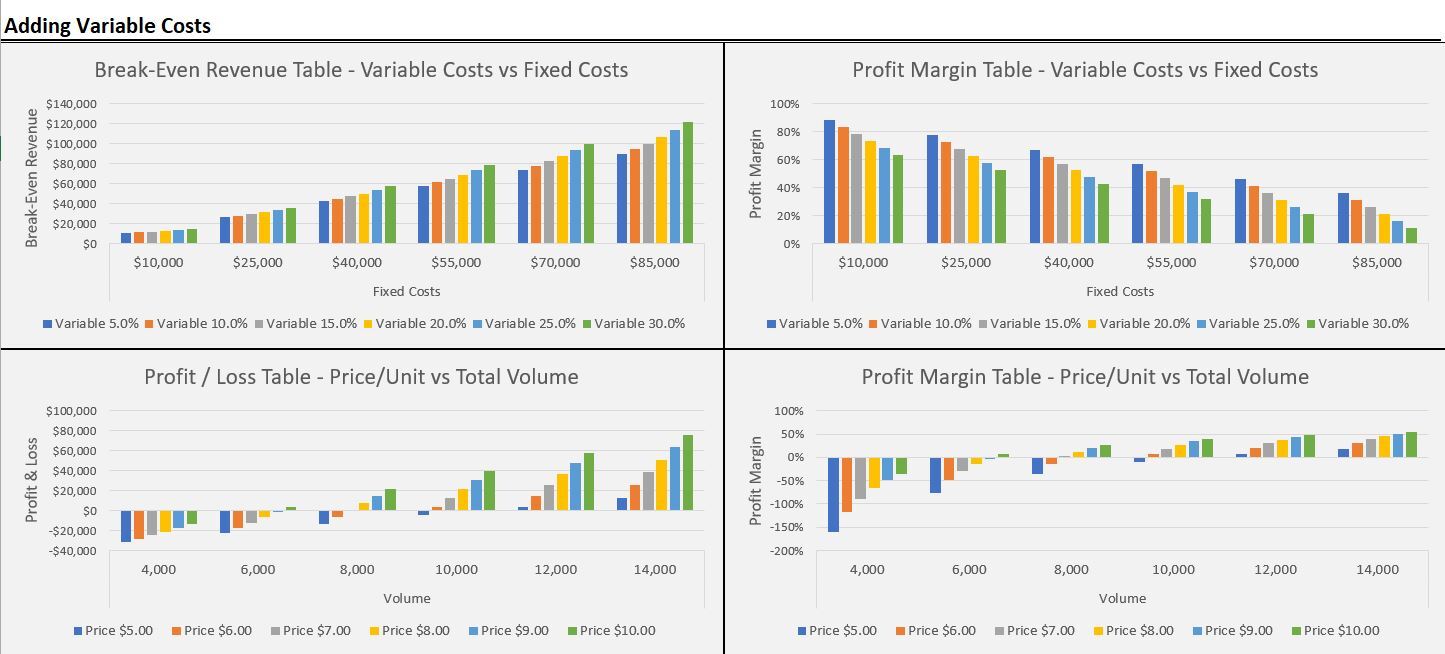
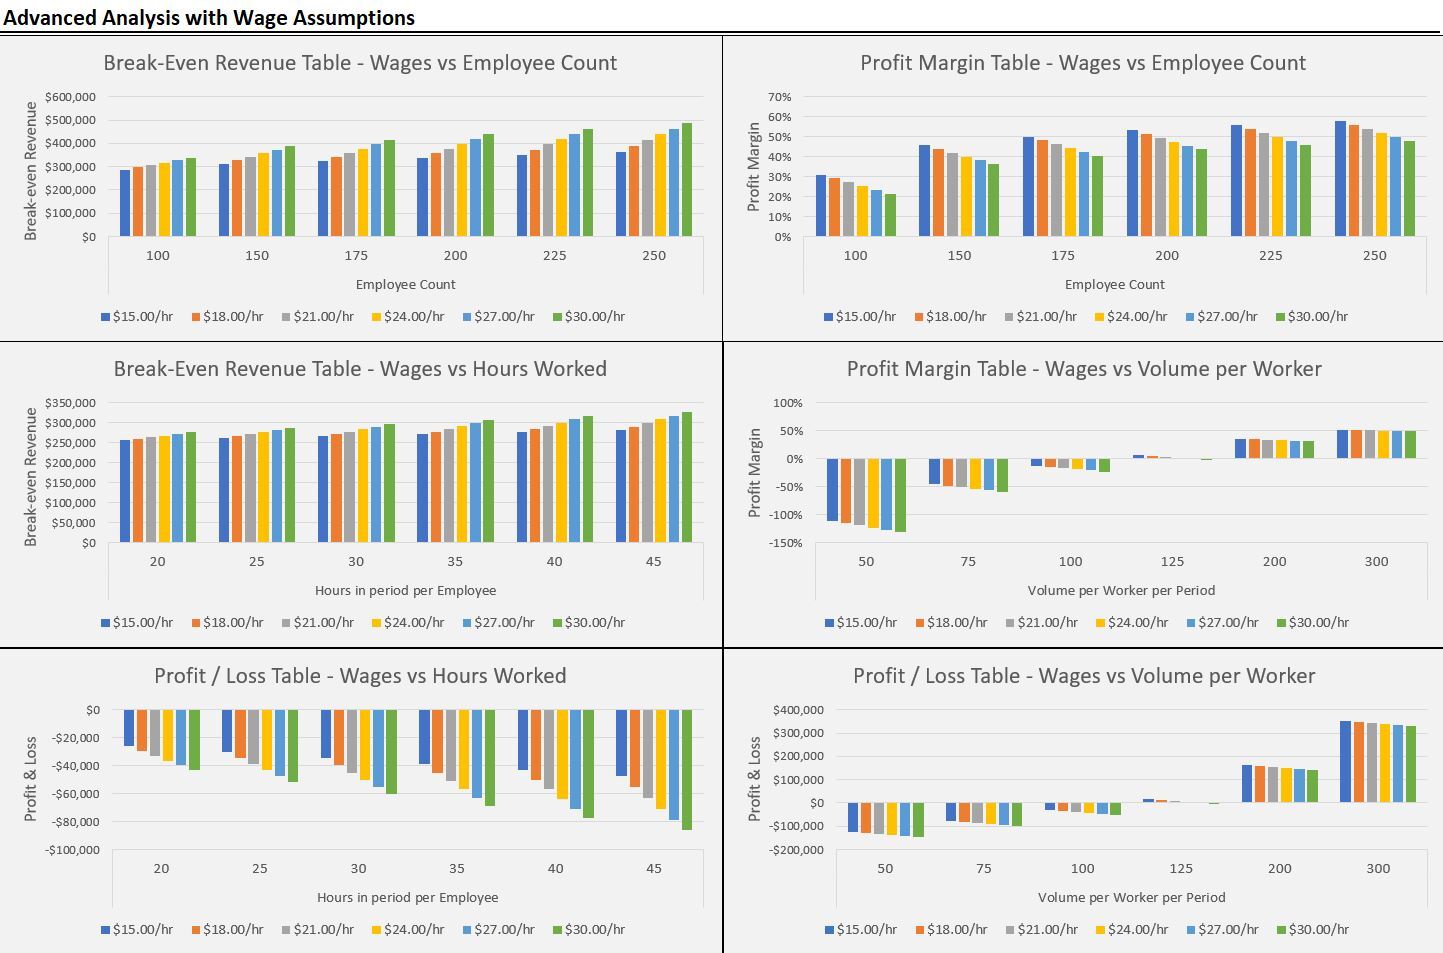
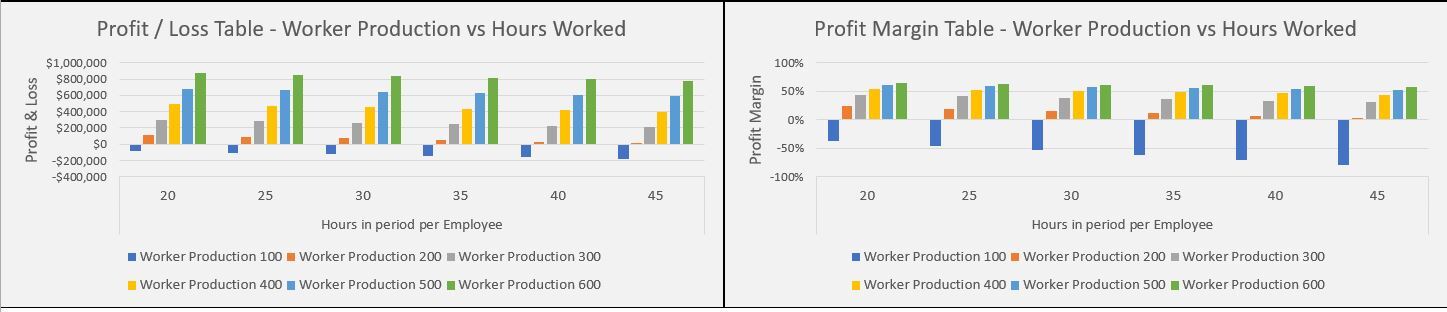
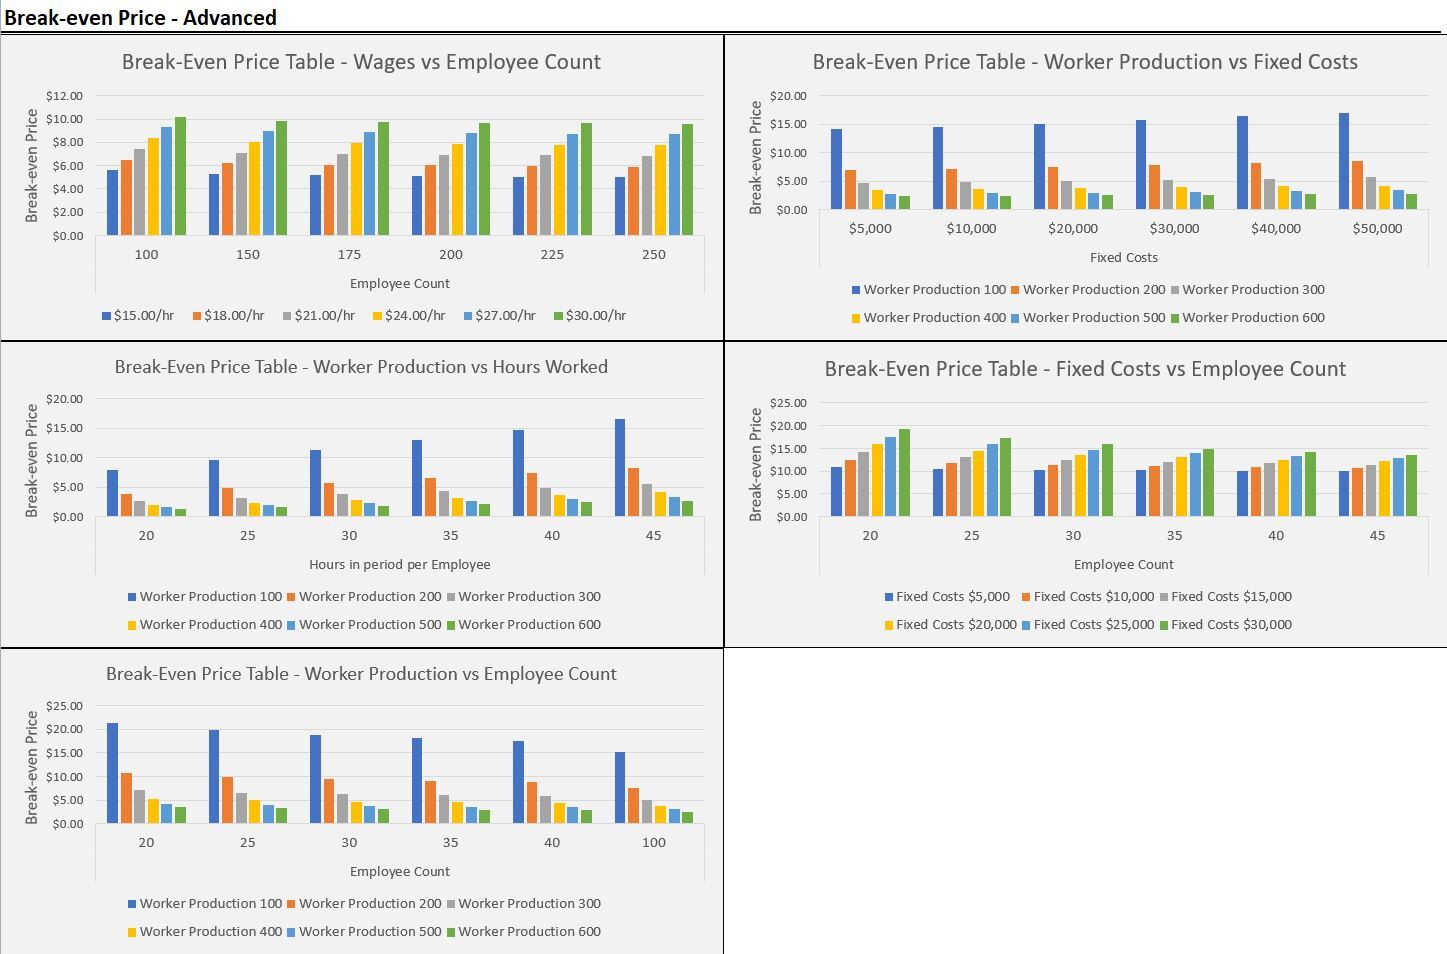
Manufacturing Business Analyzer: Price, Volume, Break-even Sensitivity Tables
This template analyzes price, volume, labor costs, and other fixed and variable costs in order to understand profitability and break-even points better.
Further information
Analyze any manufacturing business.
Manufacturing or selling anything in volume.
