Originally published: 22/03/2021 08:12
Publication number: ELQ-32315-1
View all versions & Certificate
Publication number: ELQ-32315-1
View all versions & Certificate

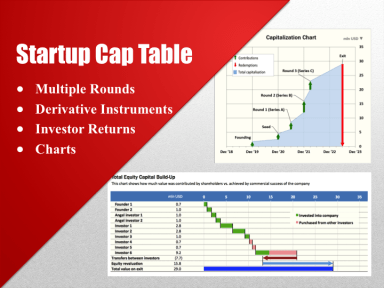
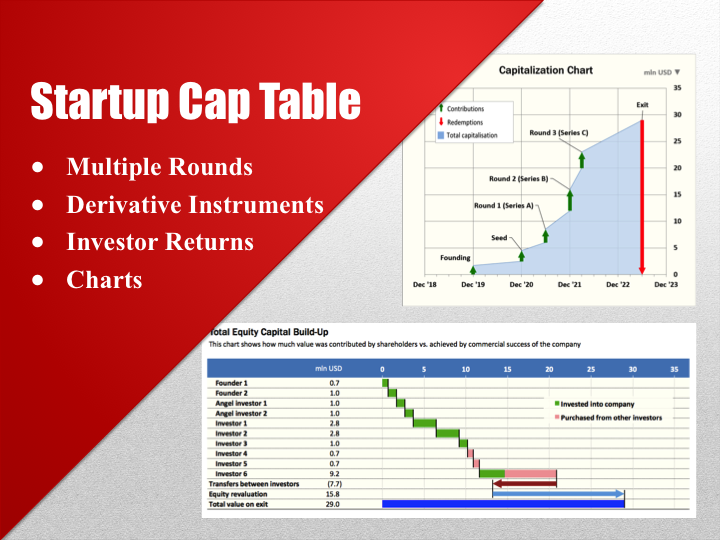
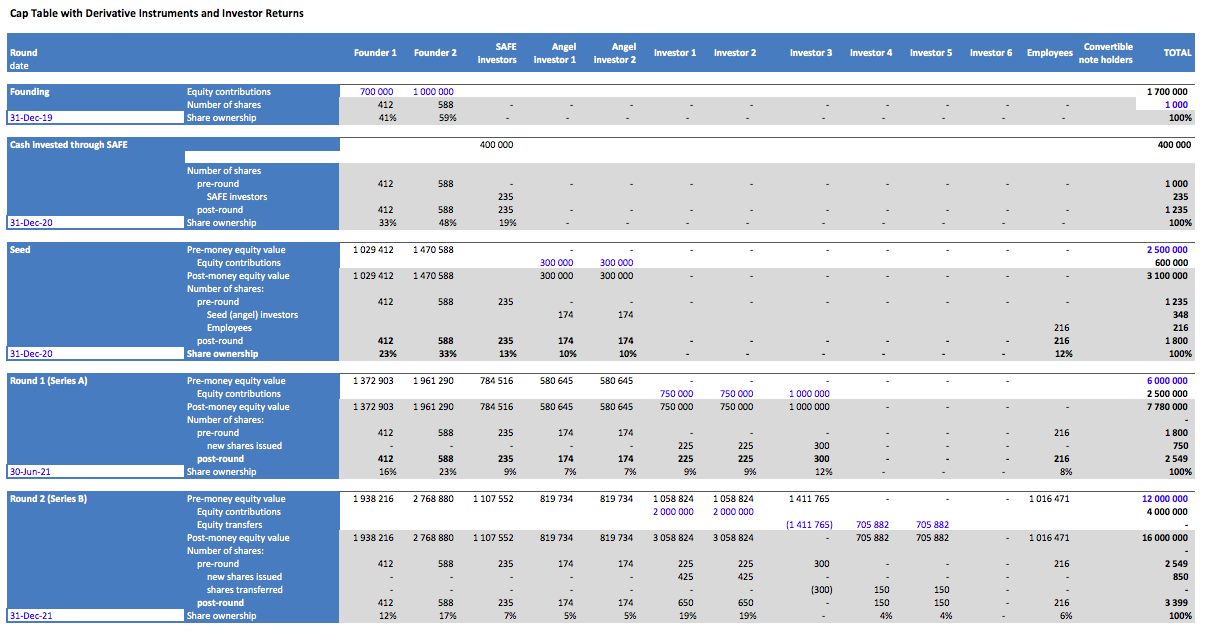
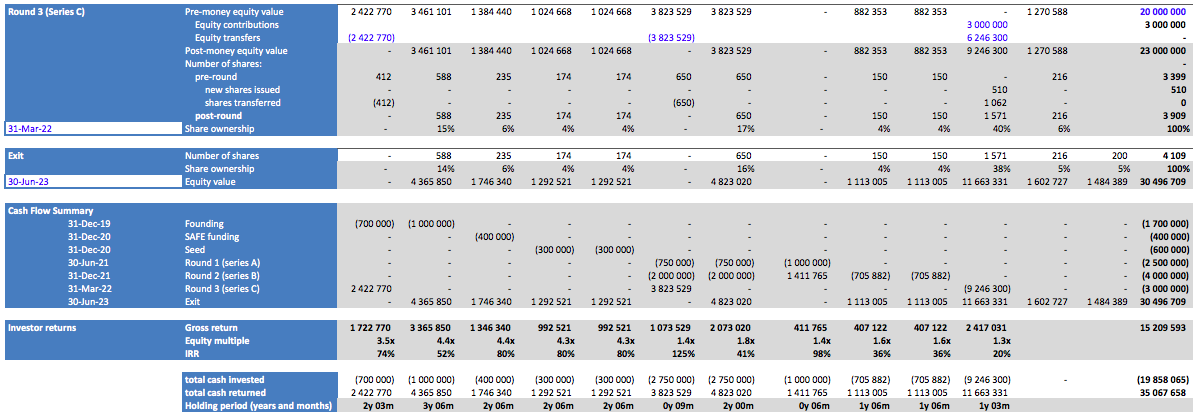
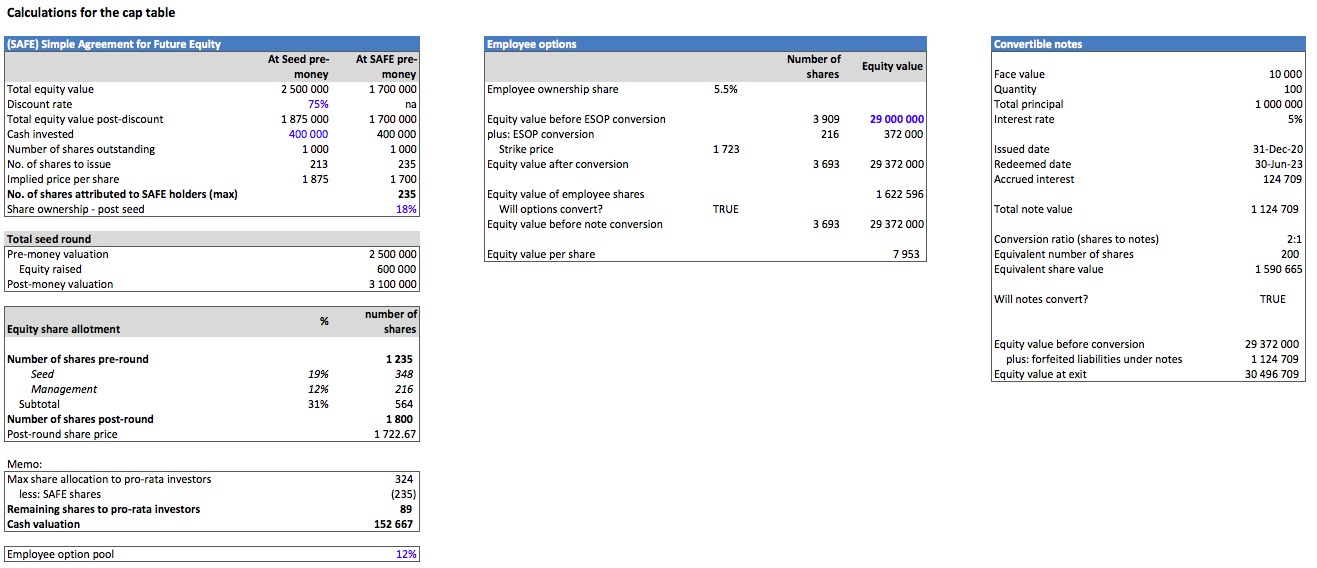
Cap Table with Derivative Instruments, Investor Returns and Charts
Advanced multiple round startup cap table
Further information
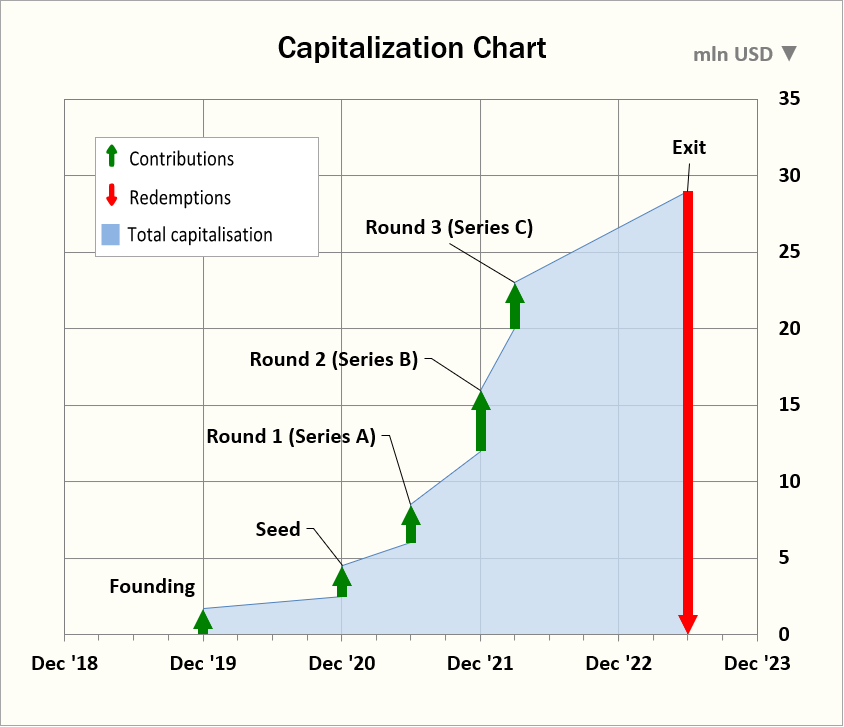
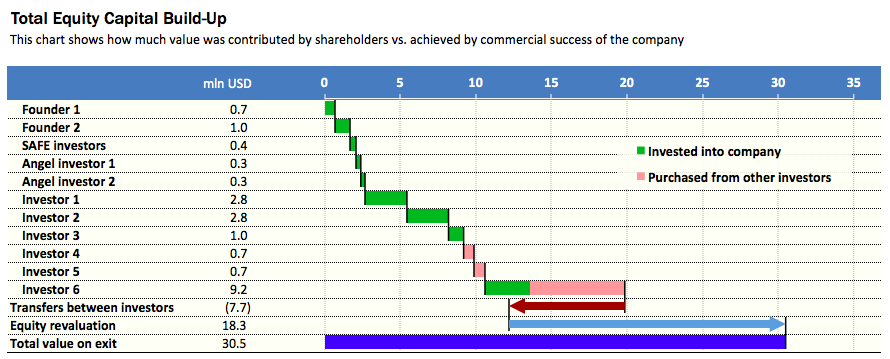
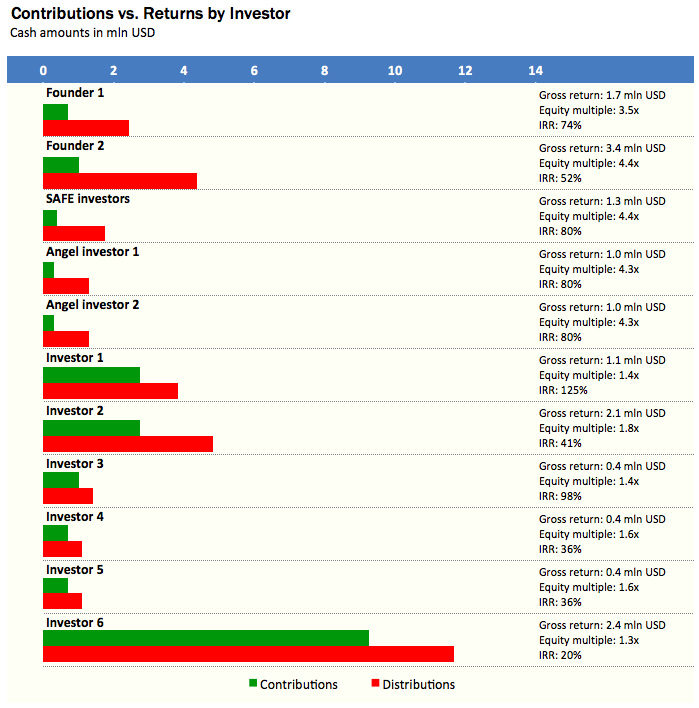
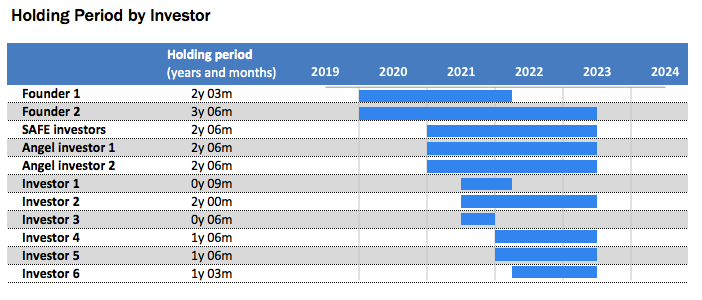
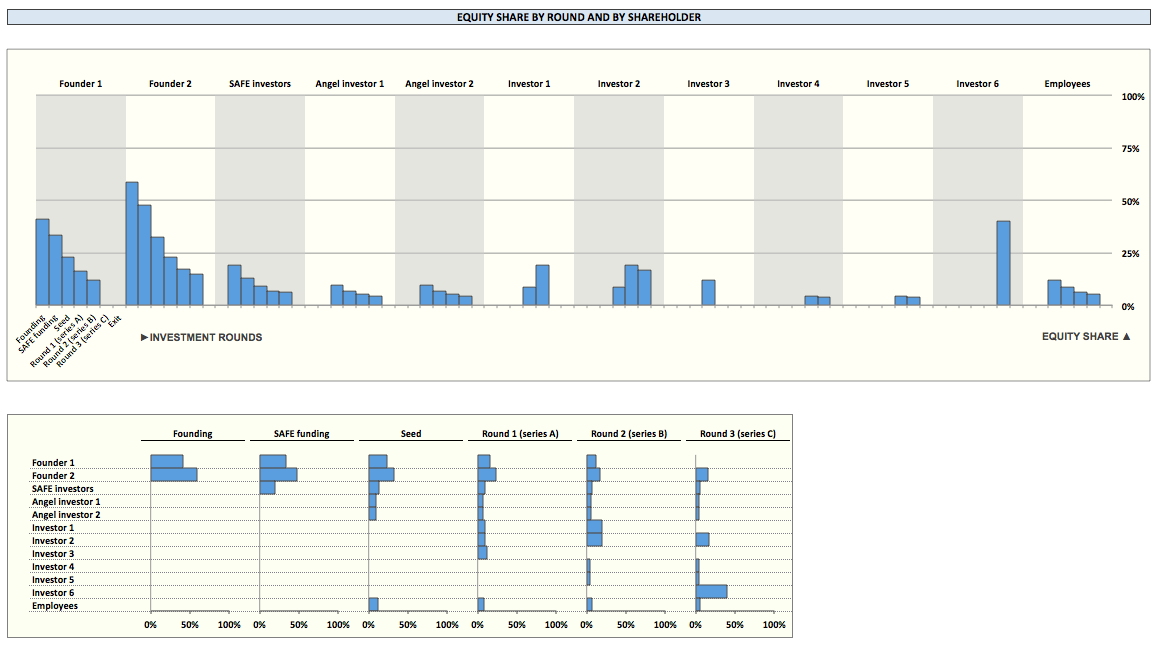
Calculate every participant's share in a JV startup at every round, analyze potential dilutive effect of derivative instruments, present the results graphically
You have a startup with several investors joining in multiple rounds
If your JV's capital structure is more complex than what this model includes; contact me if you need help creating a cap table for your situation
