
Originally published: 22/02/2021 08:30
Publication number: ELQ-72089-1
View all versions & Certificate
Publication number: ELQ-72089-1
View all versions & Certificate

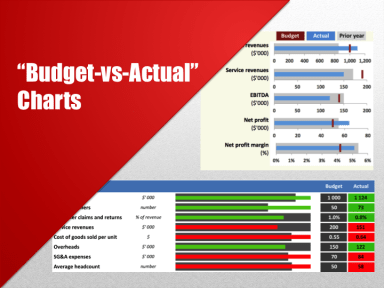
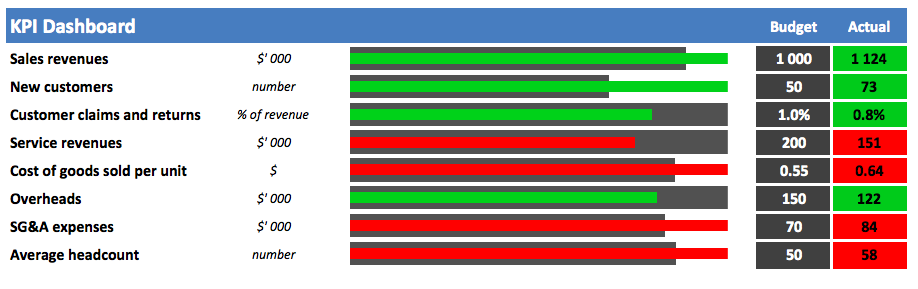
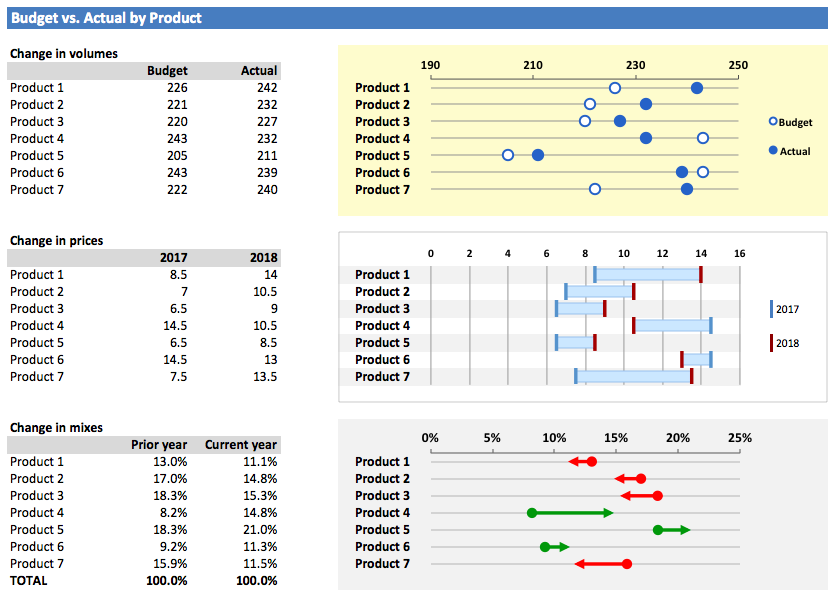
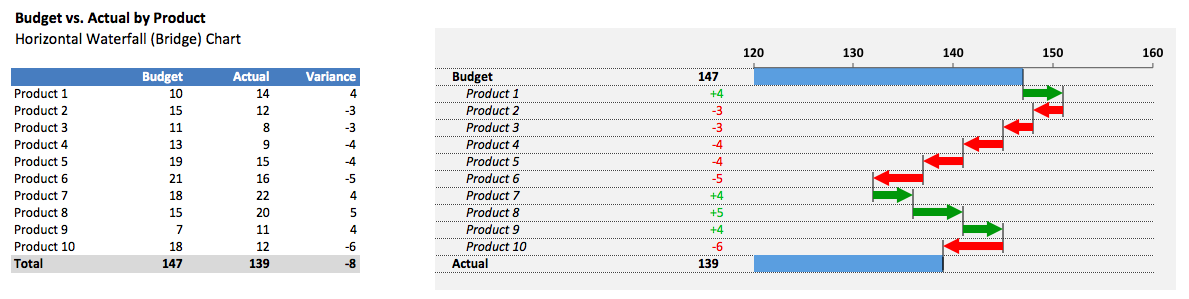
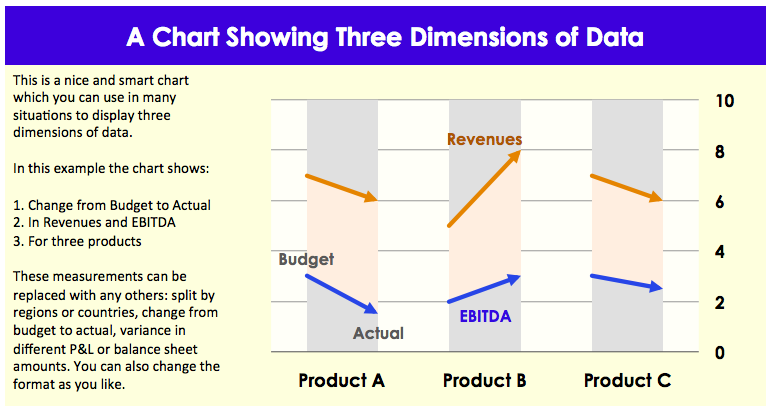
“Budget-versus-Actual” Charts
A collection of elegant charts and dashboards depicting variances
Further information
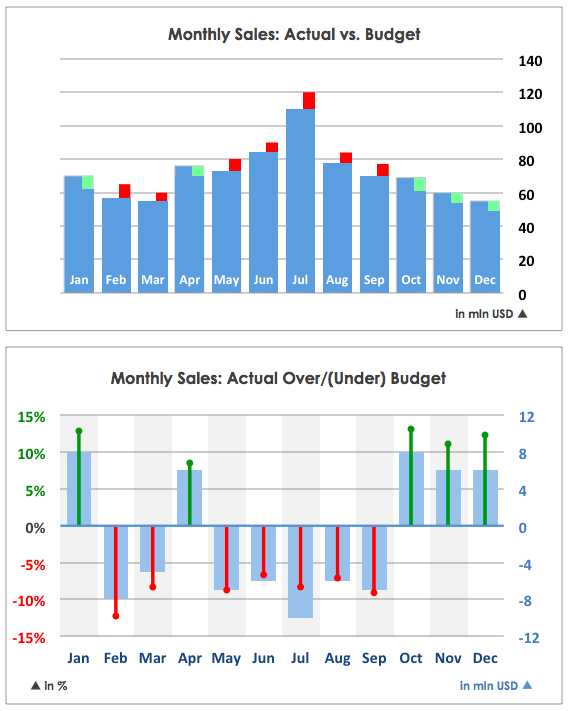
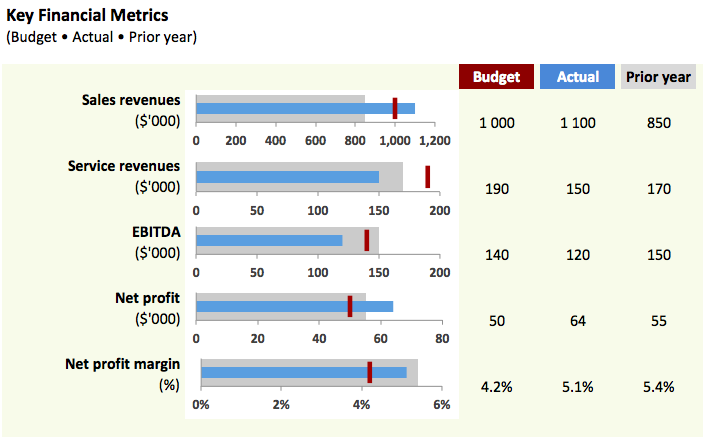
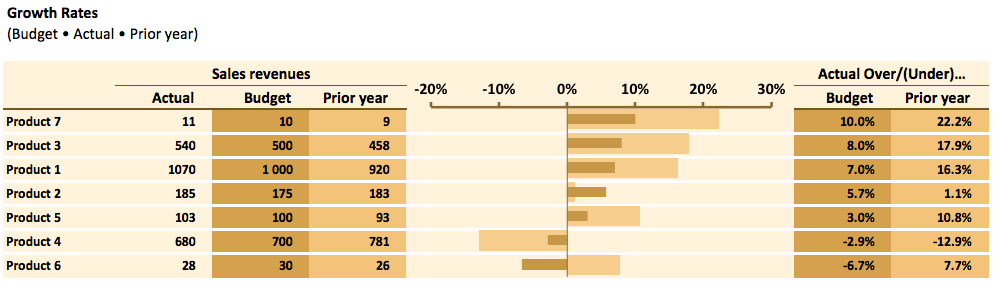
Visualize budget-vs-actual variances
Budget-vs-actual or similar variance analysis
n/a
