

Originally published: 03/04/2019 07:41
Publication number: ELQ-83603-1
View all versions & Certificate
Publication number: ELQ-83603-1
View all versions & Certificate

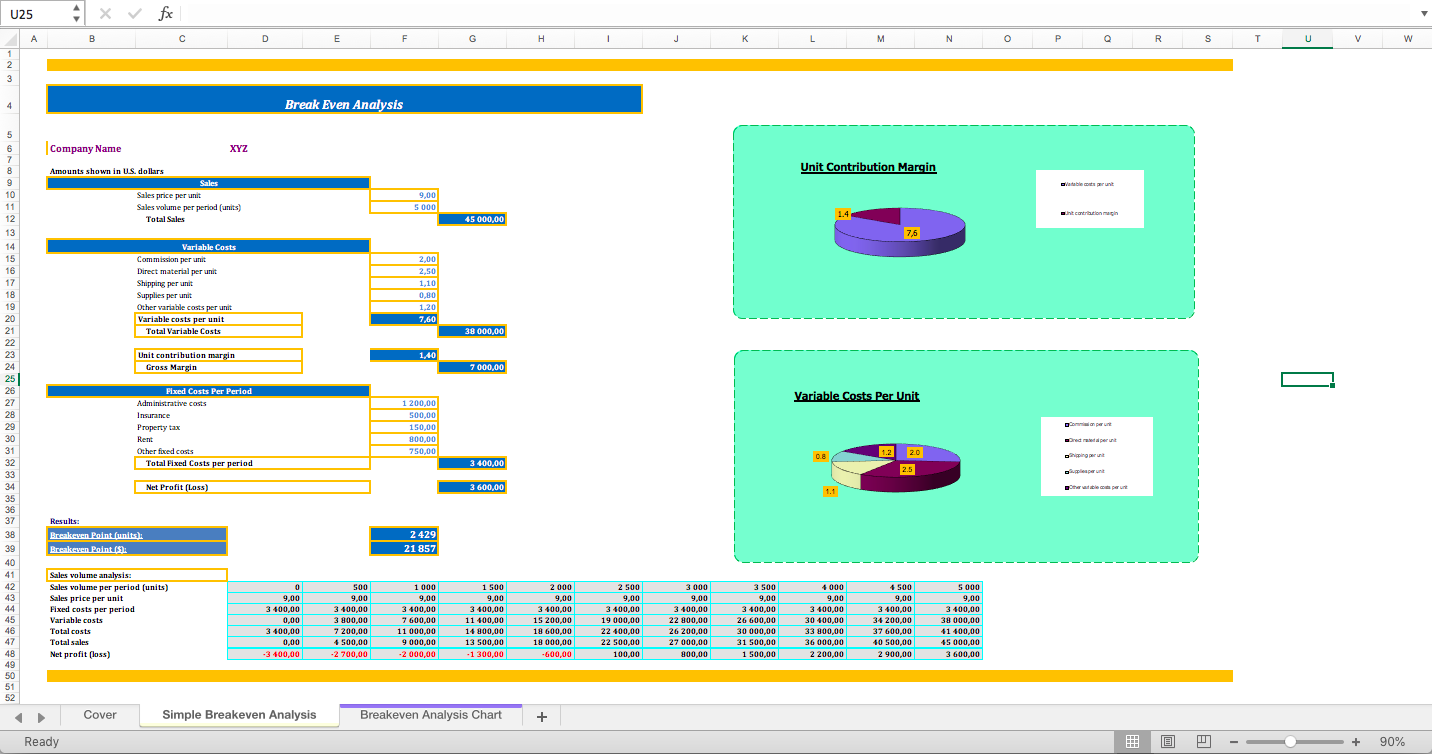
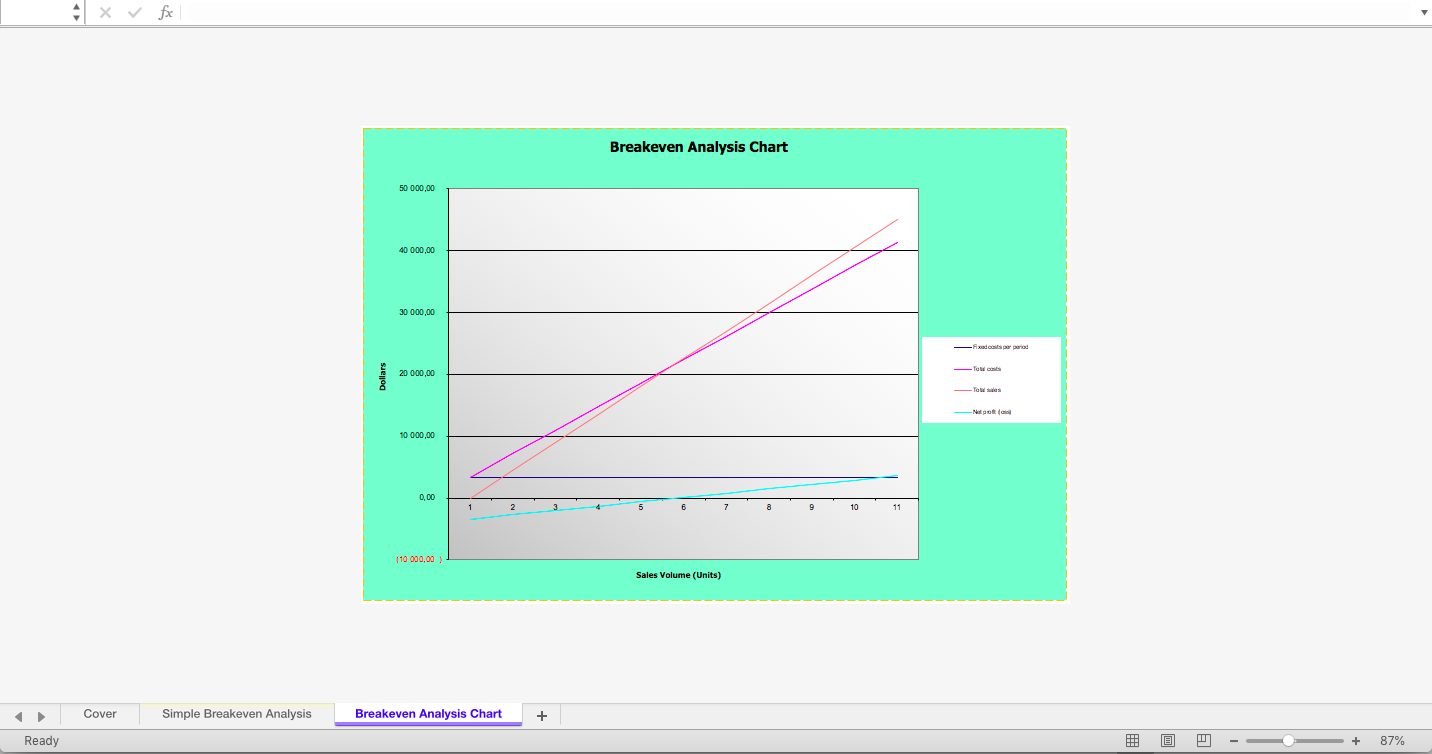
Simple Break-Even Analysis Excel Model
A FREE straightforward Break-Even Analysis Model in Microsoft Excel for you to use.
Further information
Help you quickly and easily determine the breakpoint in your business.
