Premium F&B Management Toolkit — The Consultant-in-a-Box for Restaurant & Hotel Operations
Originally published: 24/04/2026 12:04
Publication number: ELQ-54504-1
View all versions & Certificate
certified

Premium F&B Management Toolkit — The Consultant-in-a-Box for Restaurant & Hotel Operations

The most comprehensive F&B operational toolkit on any marketplace. 4 integrated Excel workbooks with 1,057 formulas (zero errors) plus 9 professional SOP.

Description
The Problem This Solves

Restaurant owners and F&B managers juggle dozens of disconnected spreadsheets, paper checklists, and gut-feel decisions. They track food cost in one file, schedule staff from memory, evaluate performance on paper, and handle complaints without a system. When something goes wrong — food cost spikes, staff underperforms, guests complain — they treat symptoms instead of finding root causes.

This toolkit replaces all of that with a single integrated system where:

  • A score entered in the Staff Performance Matrix automatically affects the efficiency buffer in the Forecasting Engine.

  • A WEAK-rated dish in the Food Cost Tracker connects directly to the RCA Toolkit’s "High Food Cost" investigation.

  • Every corrective action references the exact SOP document the employee needs to study.

What's Inside

4 Excel Workbooks (1,057 formulas, 0 errors, 14 sheets):

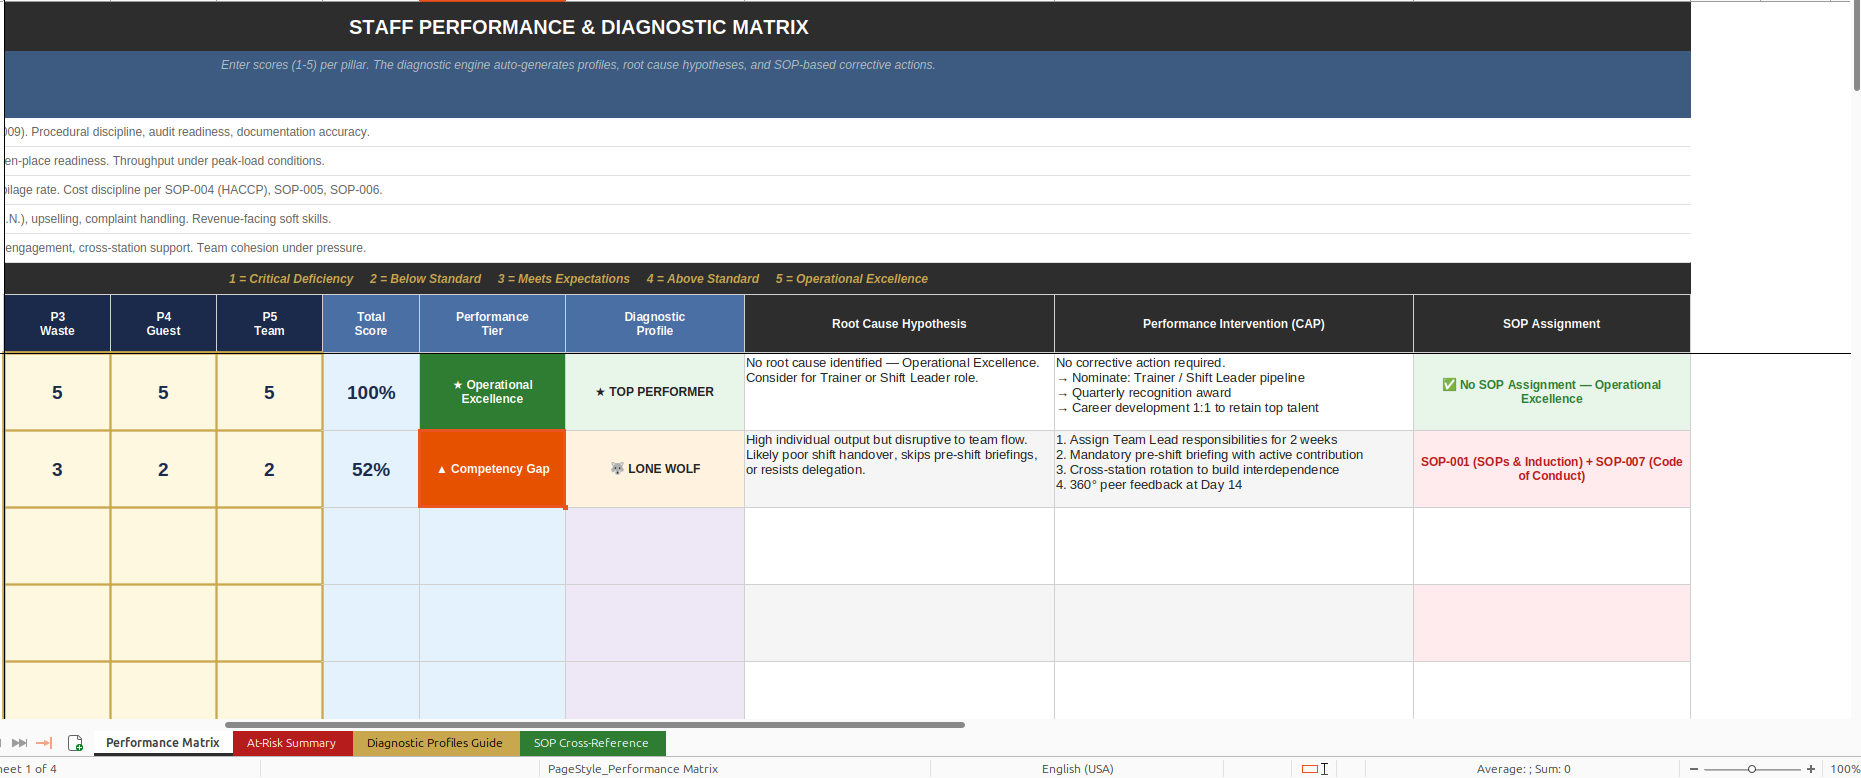
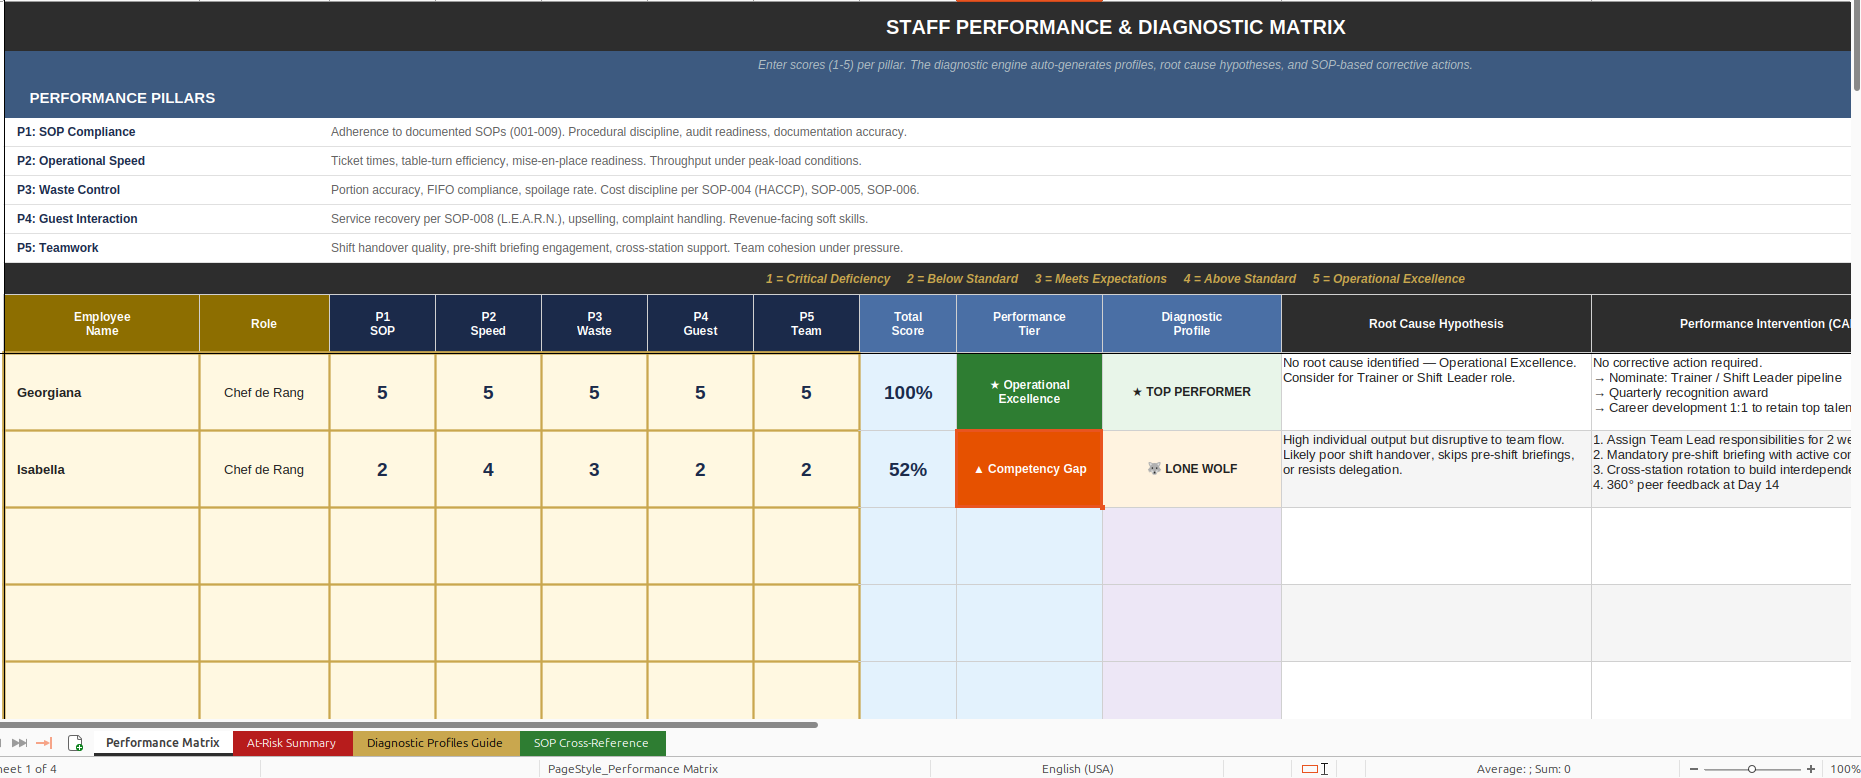
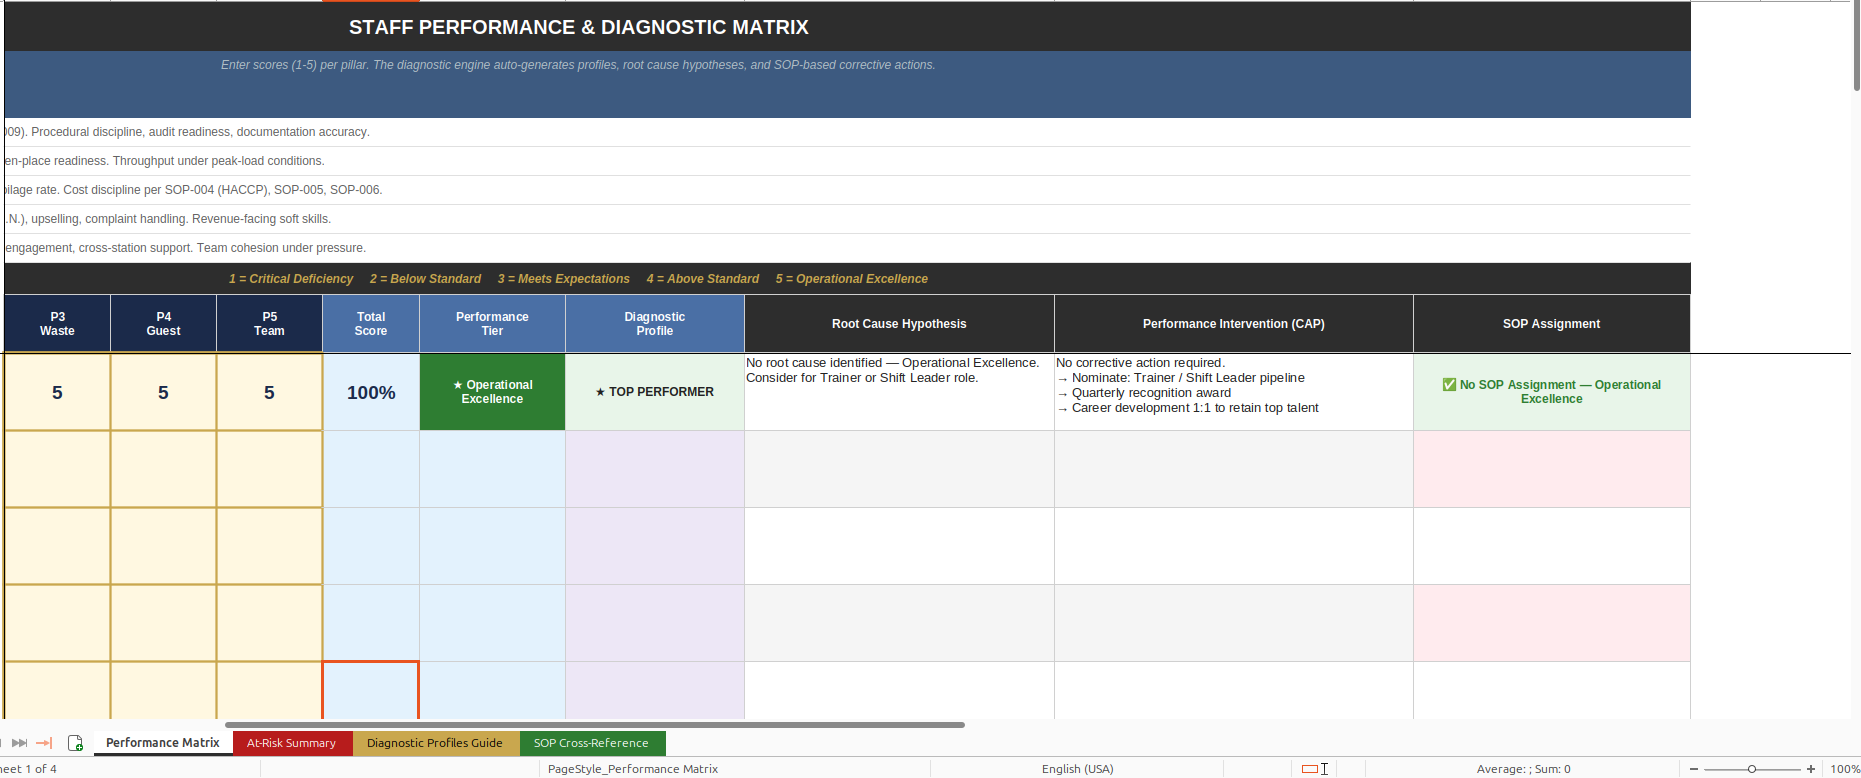
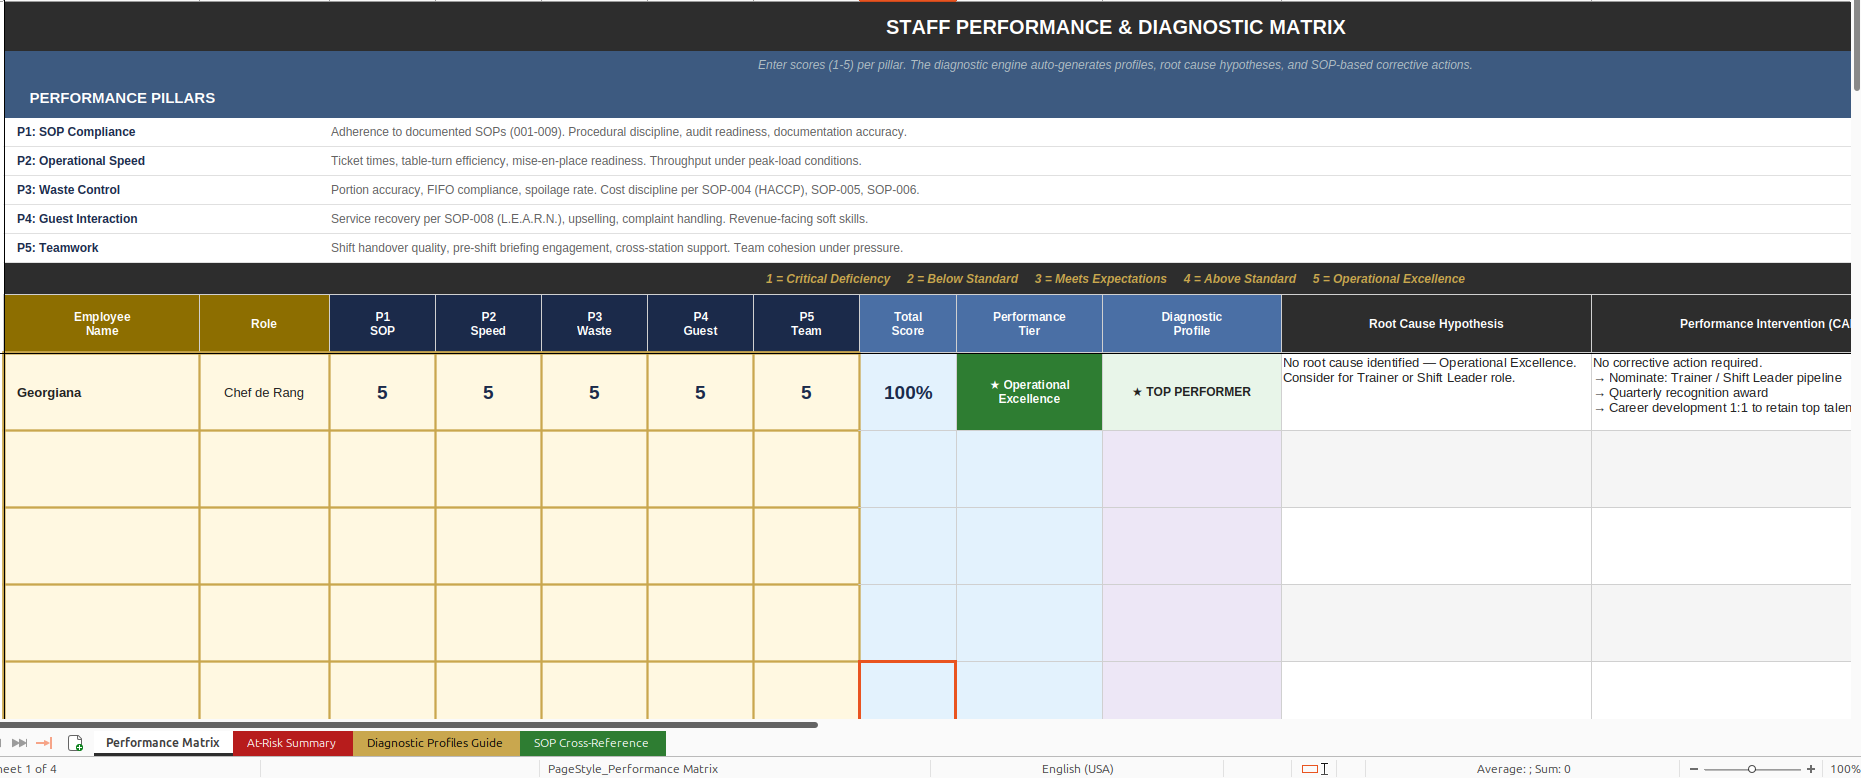
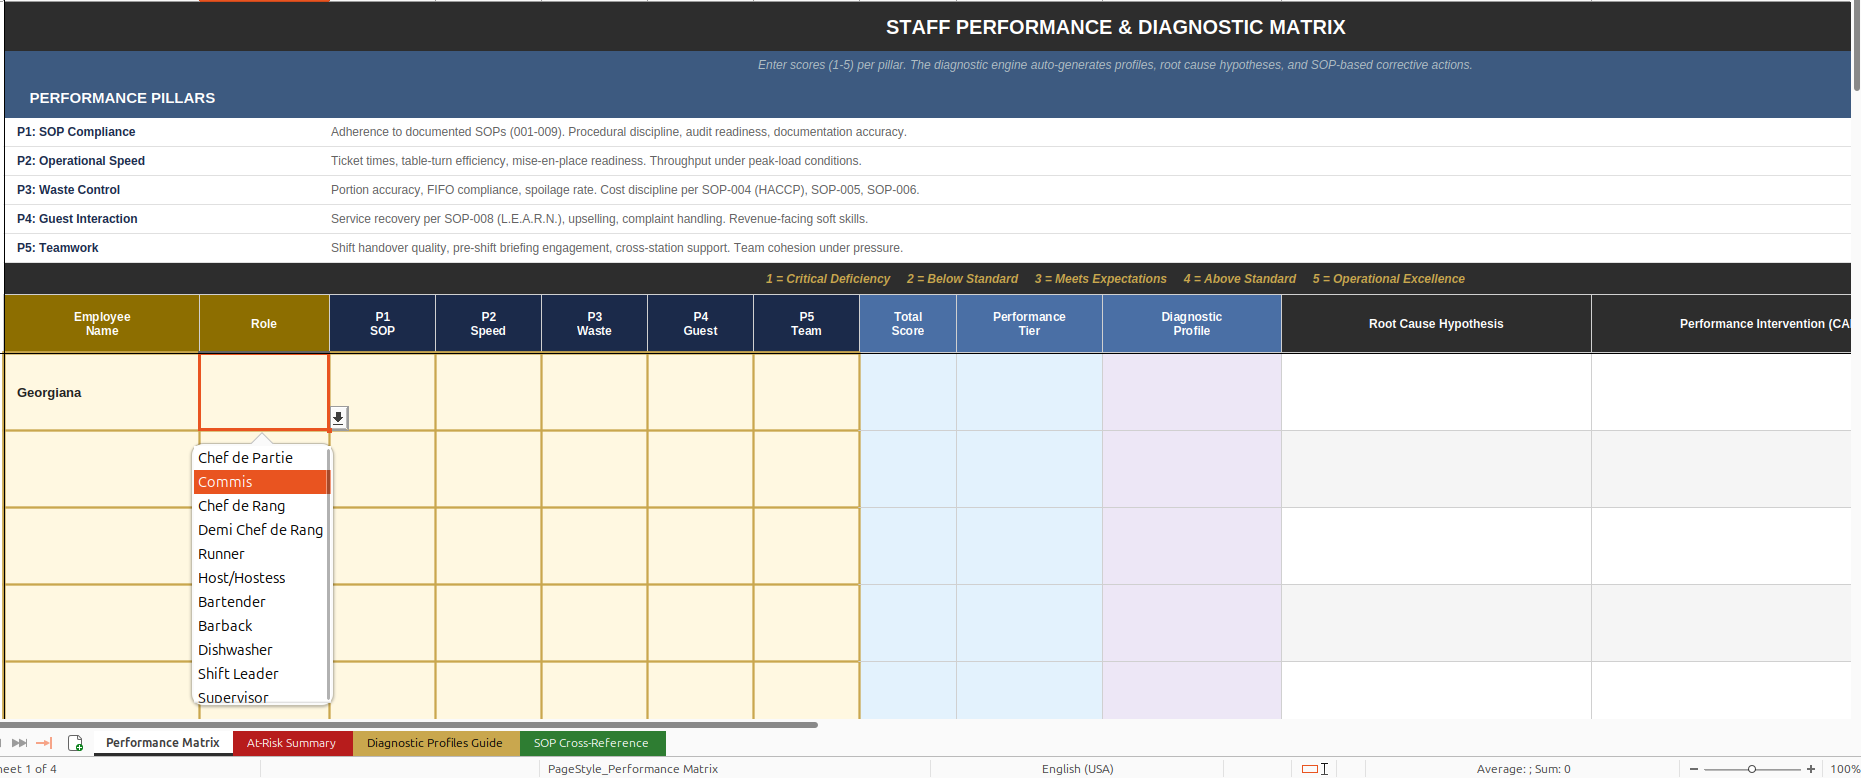
  1. Staff Performance & Diagnostic Matrix — 266 formulas, 4 sheets

    The centerpiece diagnostic tool. Enter scores (1-5) across 5 performance pillars (SOP Compliance, Operational Speed, Waste Control, Guest Interaction, Teamwork), and the engine auto-generates:

    • Performance Tier — 5 levels from Critical Risk to Operational Excellence, with conditional color formatting.

    • Diagnostic Profile — 7 behavioral archetypes identified through IF/AND/OR logic:

      • Negligent Expert (fast but wasteful)

      • Theoretical Learner (knows rules, can't execute)

      • Process Robot (compliant but no guest skills)

      • Lone Wolf (fast but disrupts team)

      • Critical Risk

      • Full Intervention

      • Top Performer

    • Root Cause Hypothesis — plain-language explanation of why the employee is underperforming.

    • Corrective Action Plan (CAP) — numbered steps with timelines (7-day, 14-day, 21-day, 30-day review cycles).

    • SOP Assignment — maps the employee’s weakest pillar to the exact SOP document they need. Top Performers receive "No SOP Assignment — Operational Excellence" instead of false flags.

    Includes:

    • At-Risk Employee Register (auto-populated via AGGREGATE formulas).

    • Diagnostic Profiles Guide (reference for all 7 archetypes).

    • SOP Cross-Reference Index (maps all 9 SOPs to pillars and profiles).

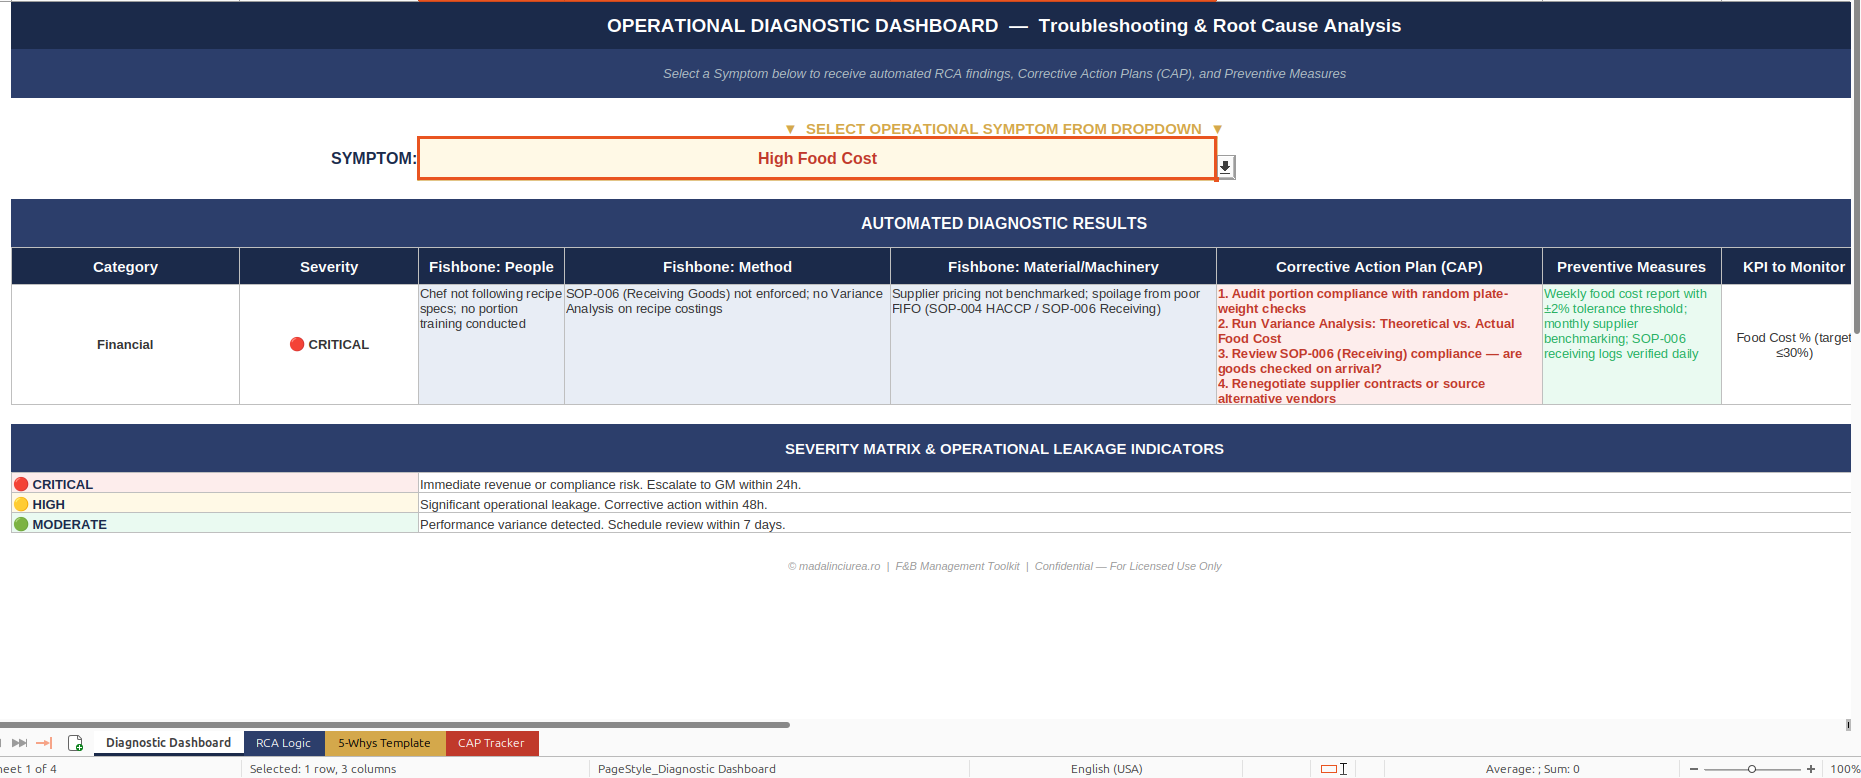
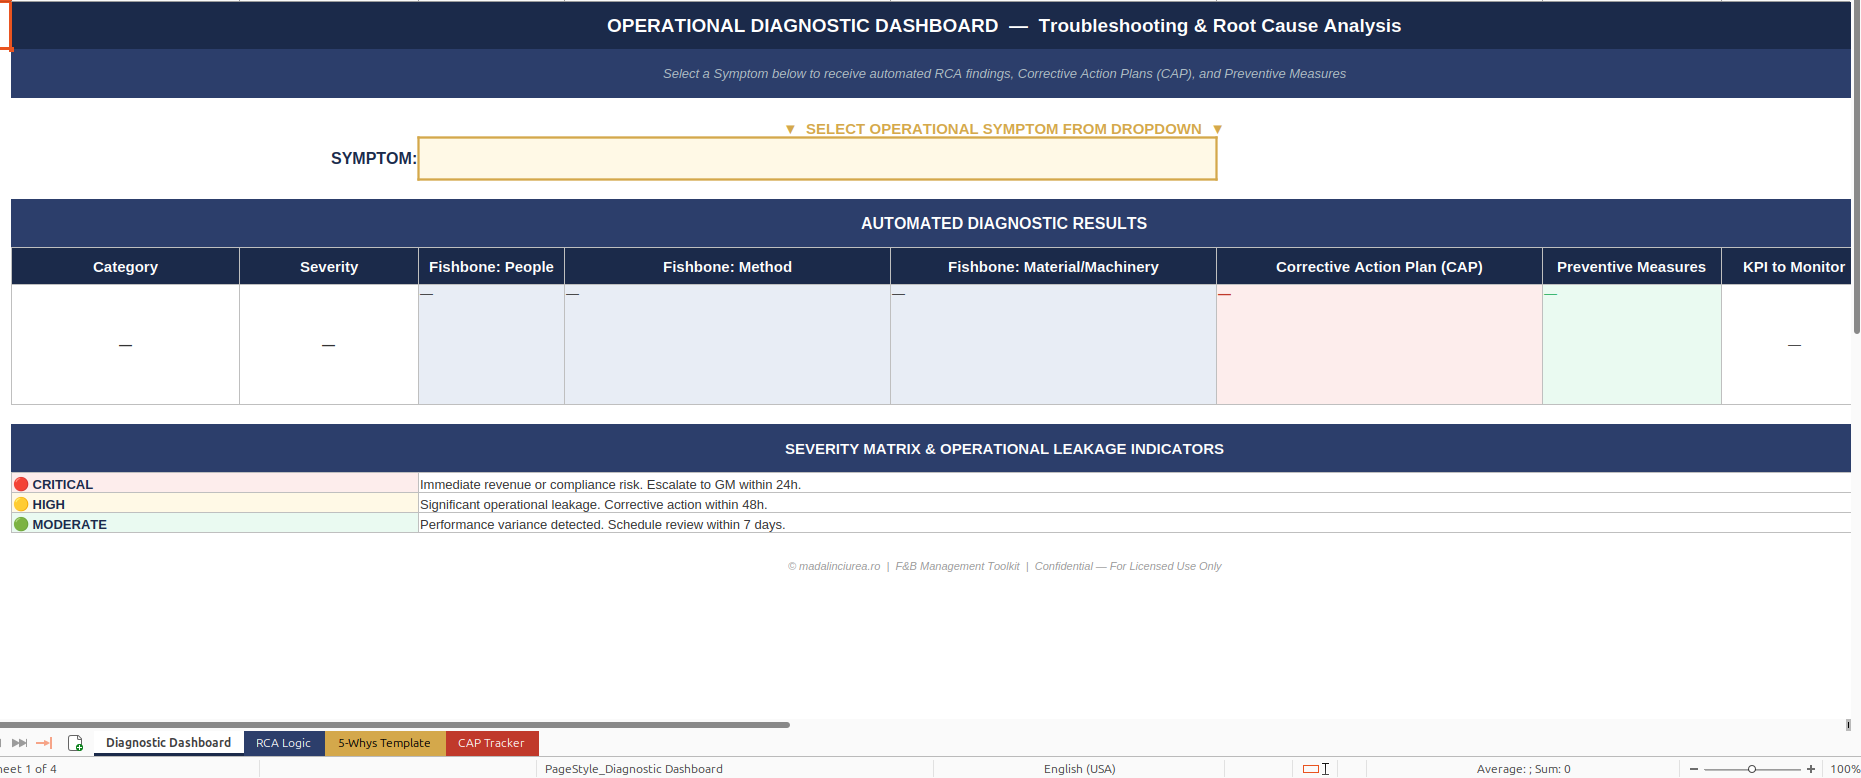
  1. RCA Diagnostic Toolkit — 15 formulas, 4 sheets

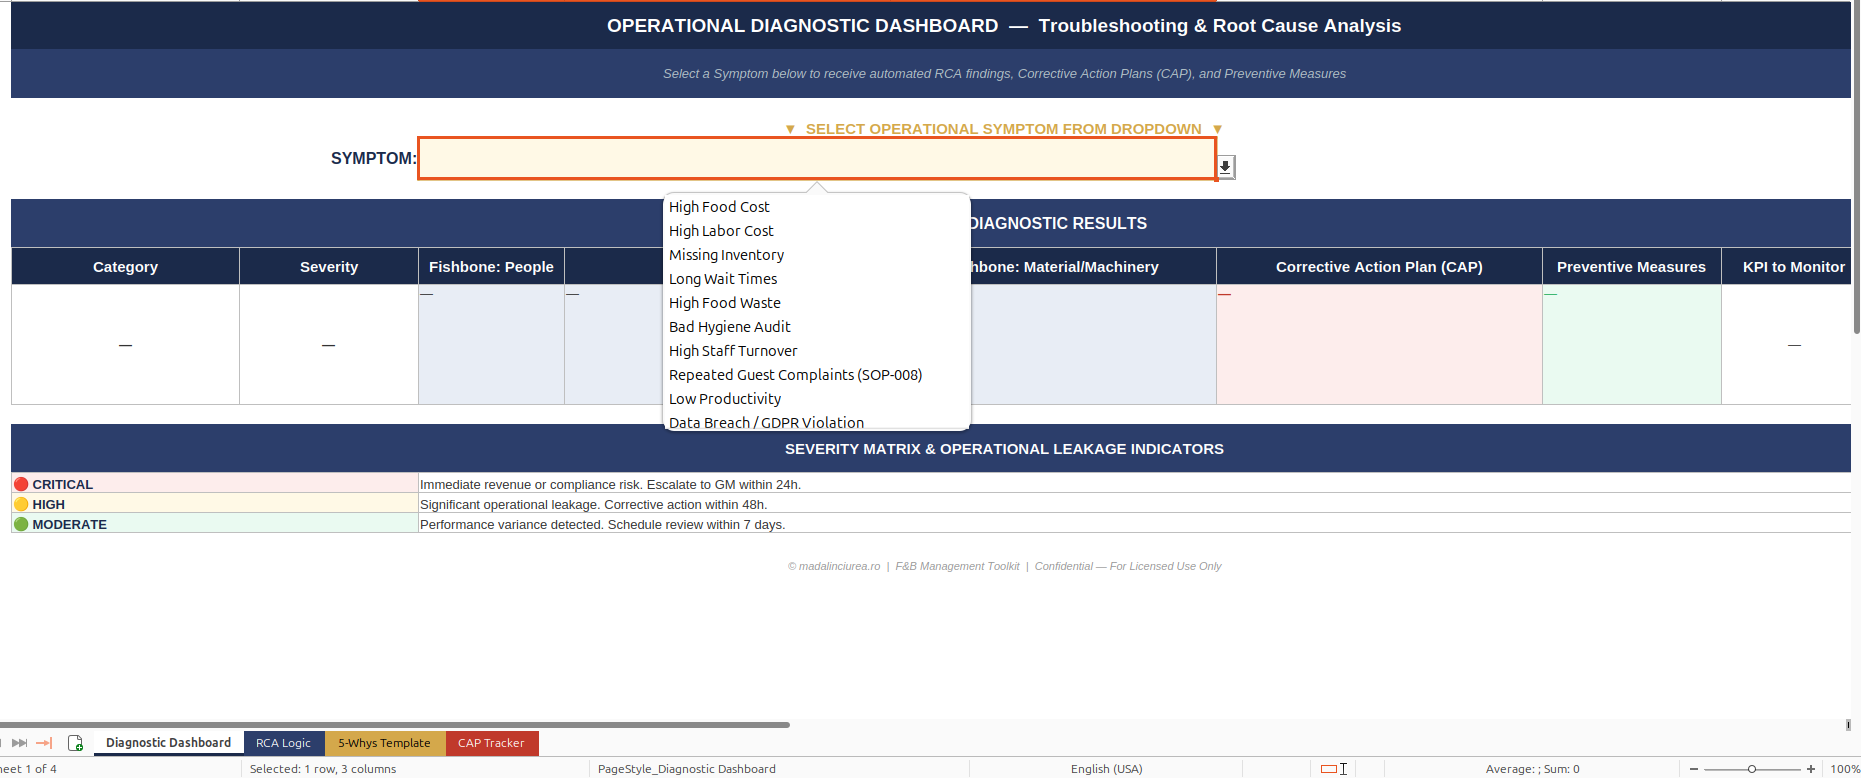
    Select an operational symptom from the dropdown — 10 options covering:

    • Financial (High Food Cost, High Labor Cost, Missing Inventory).

    • Operational (Long Wait Times, High Food Waste, Bad Hygiene Audit).

    • Human (High Staff Turnover, Repeated Guest Complaints, Low Productivity).

    • Compliance (Data Breach / GDPR Violation).

    The dashboard auto-populates:

    • Ishikawa/Fishbone Analysis across People, Method, Material/Machinery dimensions.

    • Corrective Action Plan with specific SOP references.

    • Preventive Measures and KPI targets.

    • Interactive 5-Whys Template — print-ready investigation form with guiding questions and F&B-specific examples.

    • CAP Tracker — issue resolution log with status dropdowns, closure rate metrics, and management review structure.

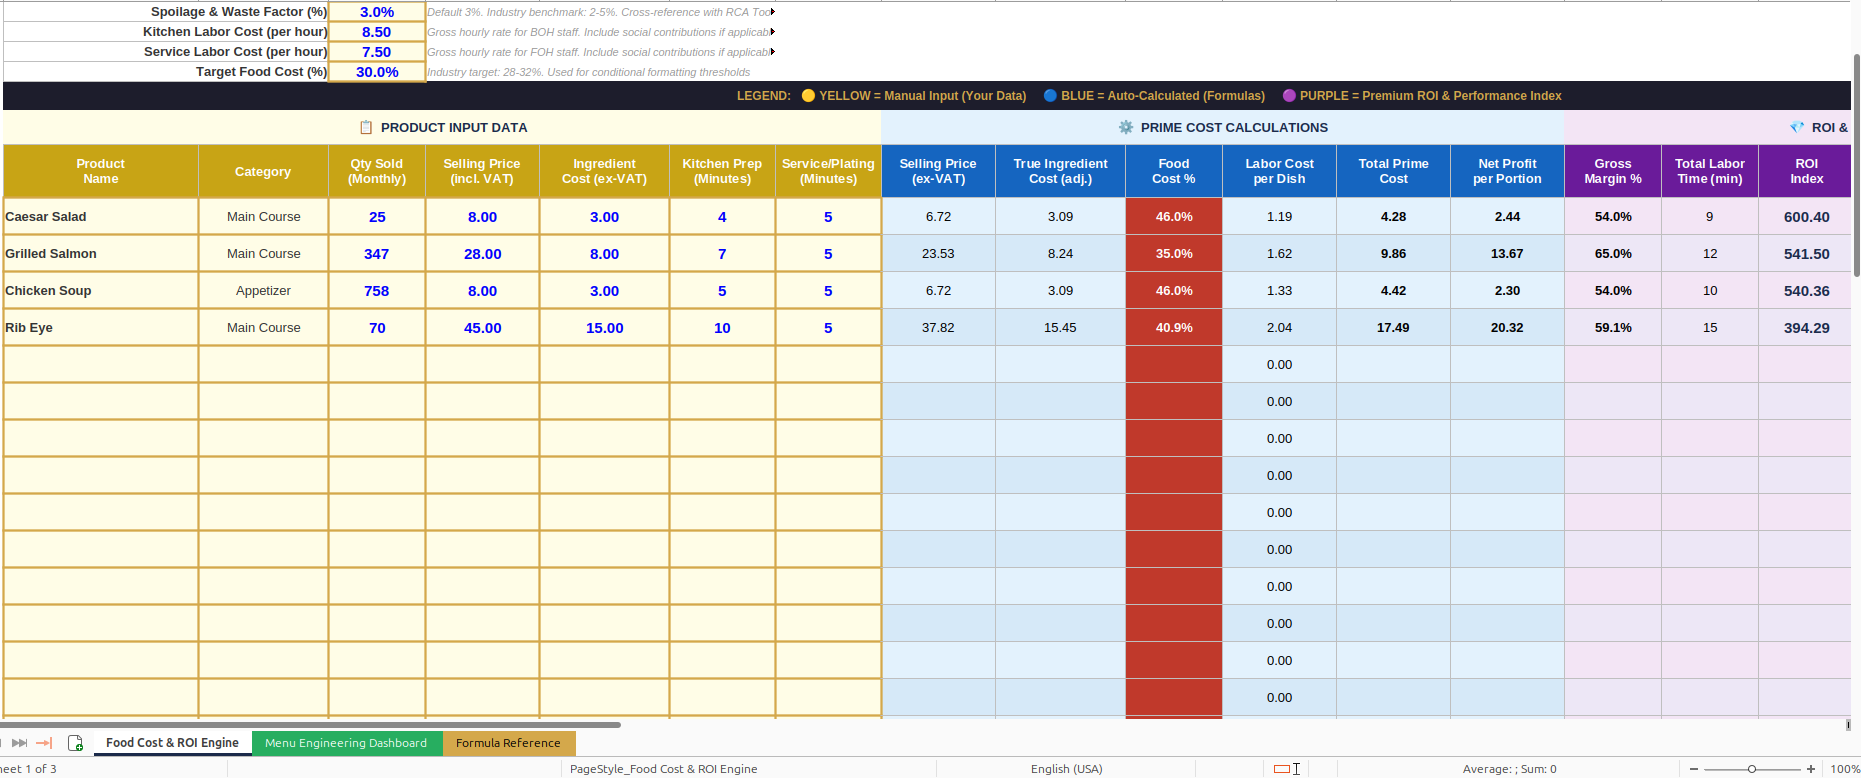
  1. Food Cost & ROI Tracker — 711 formulas, 3 sheets

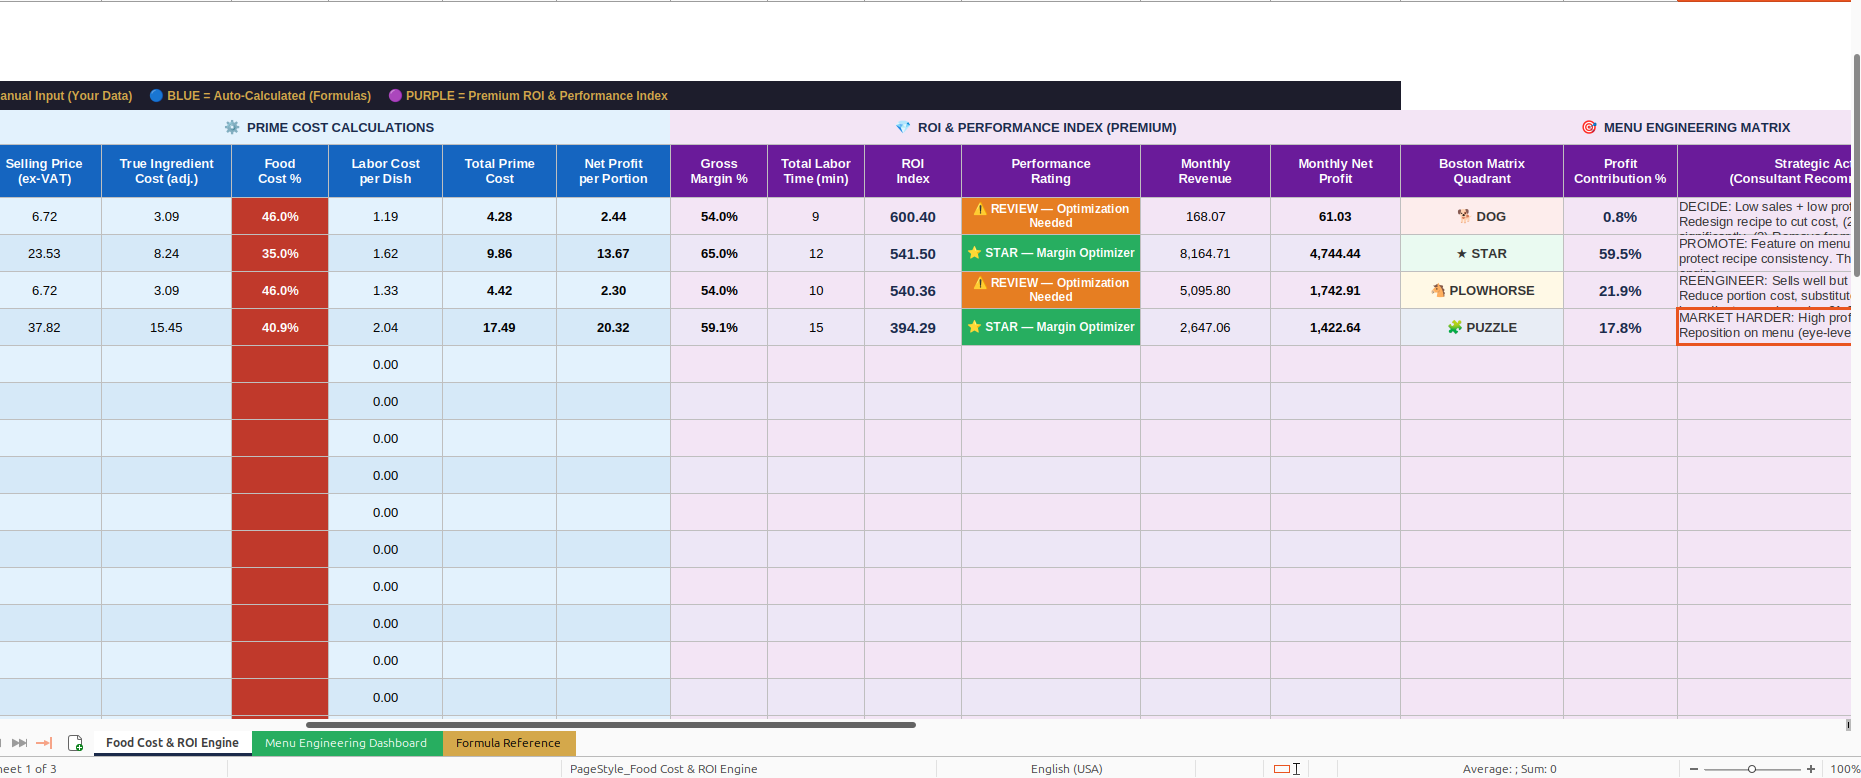
    The most formula-dense tool in the kit. Three integrated column zones on the main engine:

    • Prime Cost Engine:

      • Selling Price ex-VAT.

      • True Ingredient Cost (adjusted for spoilage).

      • Labor Cost per Dish (prep time × BOH rate + service time × FOH rate).

      • Total Prime Cost.

      • Net Profit per Portion.

      • Food Cost % with conditional formatting against a customizable target.

    • ROI & Performance Index:

      • Gross Margin %.

      • ROI Index (profit efficiency per minute of labor).

      • Composite Performance Rating evaluating net profit per portion AND labor efficiency (cannot be gamed).

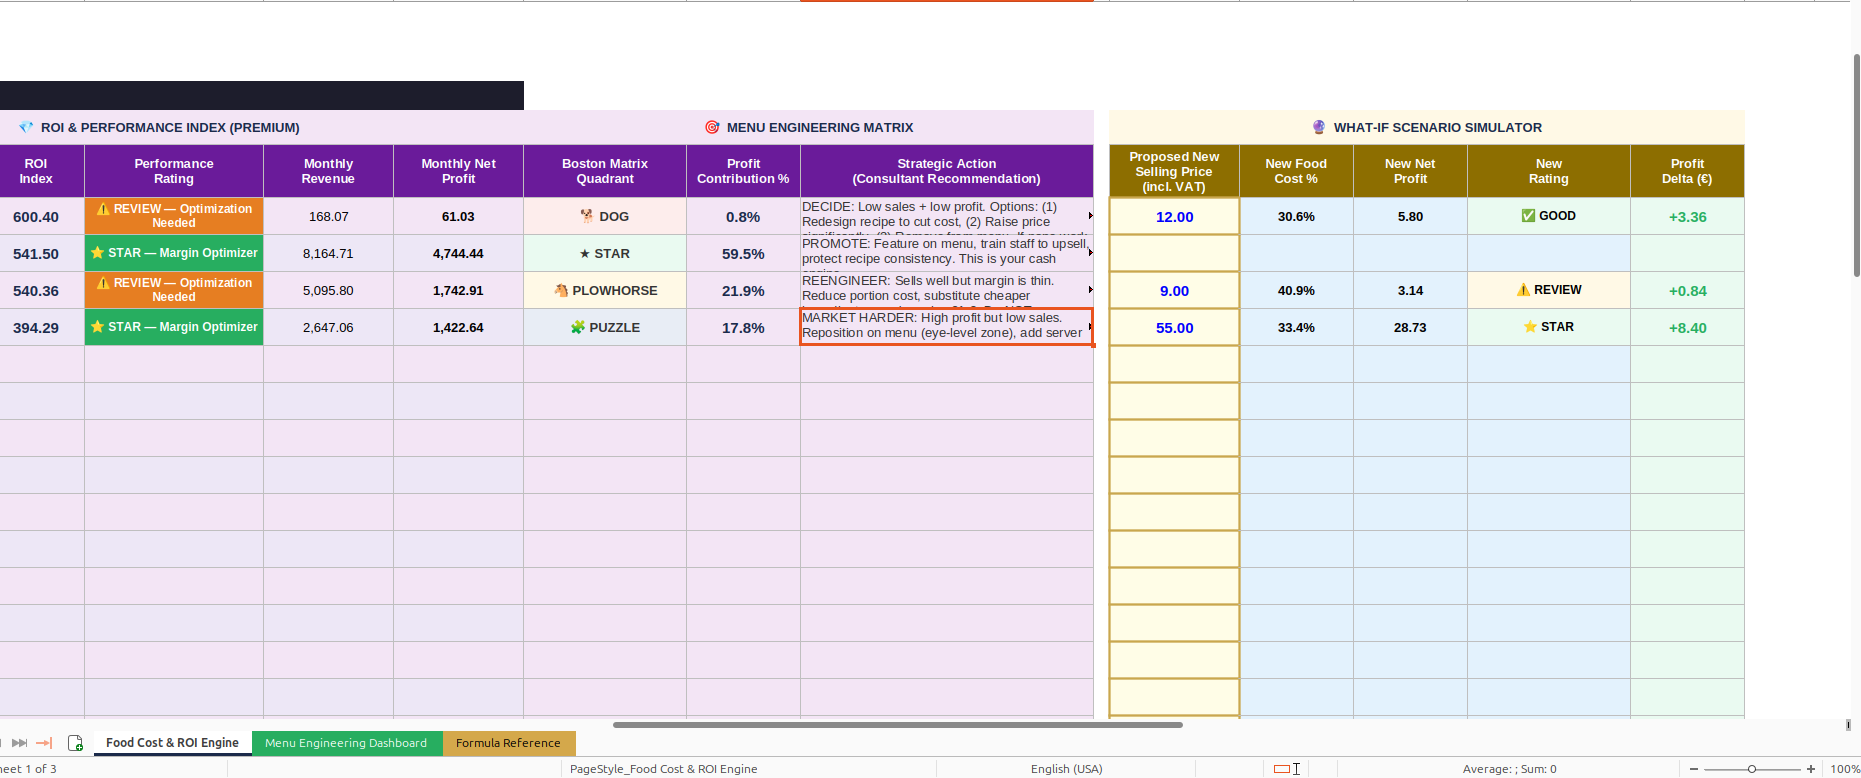
    • Menu Engineering Matrix (Boston Matrix):

      • Every dish auto-classified into quadrants:

        • ★ STAR (promote aggressively).

        • 🐴 PLOWHORSE (reengineer cost or raise price).

        • 🧩 PUZZLE (market harder — hidden gem).

        • 🐕 DOG (fix, reprice, or remove).

      • Classification based on popularity (qty sold vs. menu average) × profitability (net profit vs. menu average).

      • Each quadrant includes a Strategic Action recommendation.

    • Profit Contribution % — shows what share of total monthly profit each dish drives.

    • What-If Scenario Simulator — enter a proposed new selling price → instantly see recalculated food cost %, new net profit, new performance rating, and exact profit delta per portion.

    • Menu Engineering Dashboard — KPI summary bar, Top 5 Margin Optimizers vs. Bottom 5 Profit Killers (auto-ranked), Category-level Variance Analysis, Boston Matrix Summary, and Consultant Analysis Framework.

    • Formula Reference — complete documentation of every calculation.

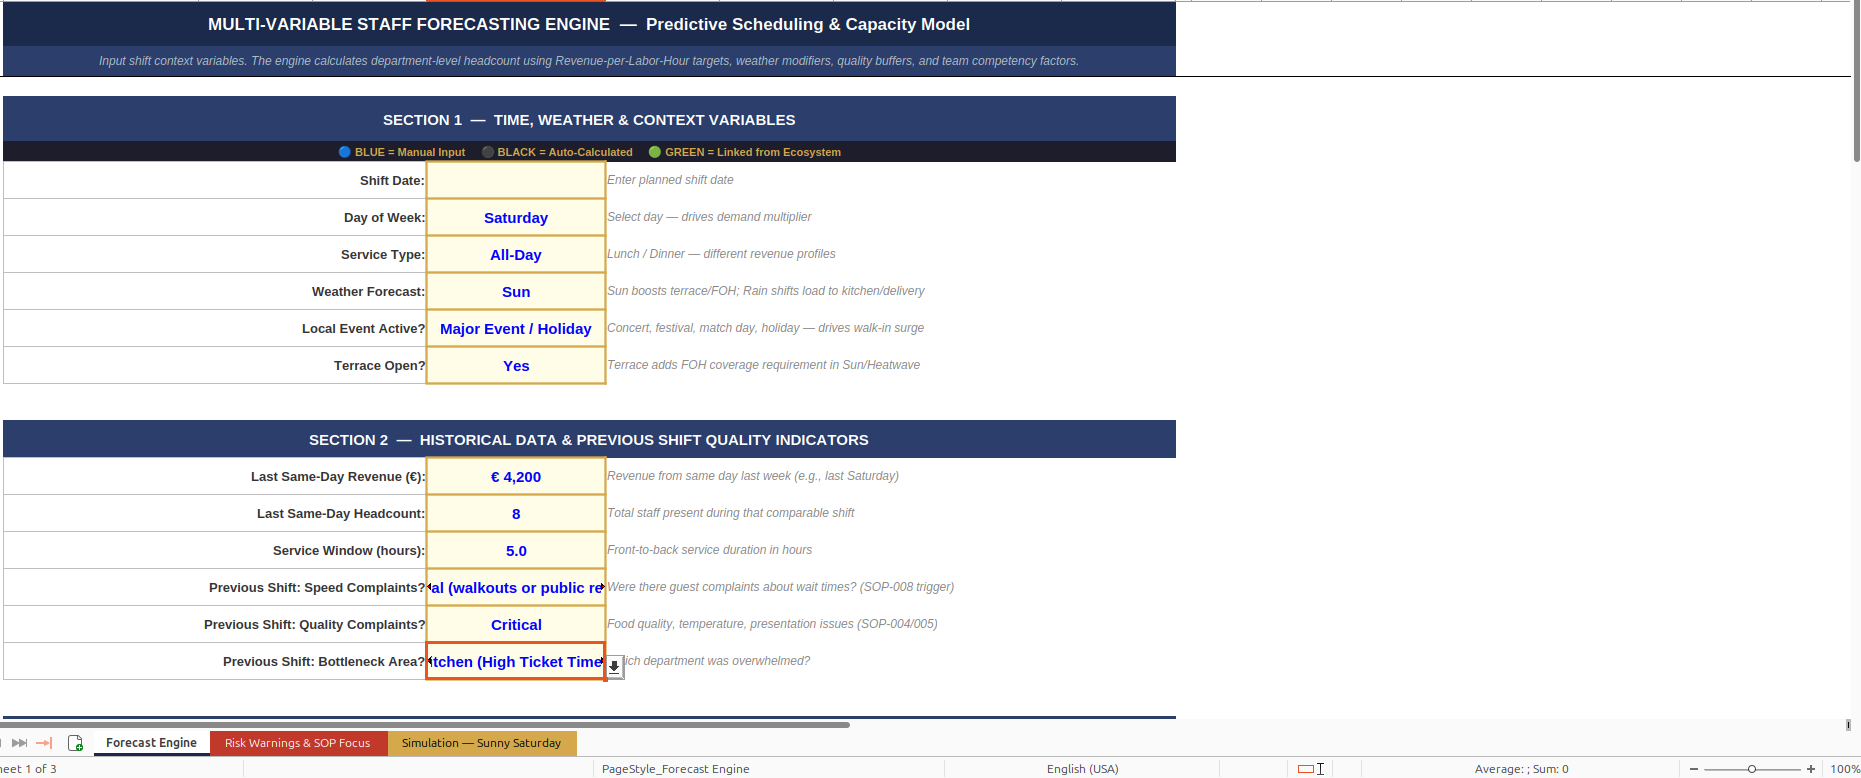
  1. Multi-Variable Staff Forecasting Engine — 65 formulas, 3 sheets

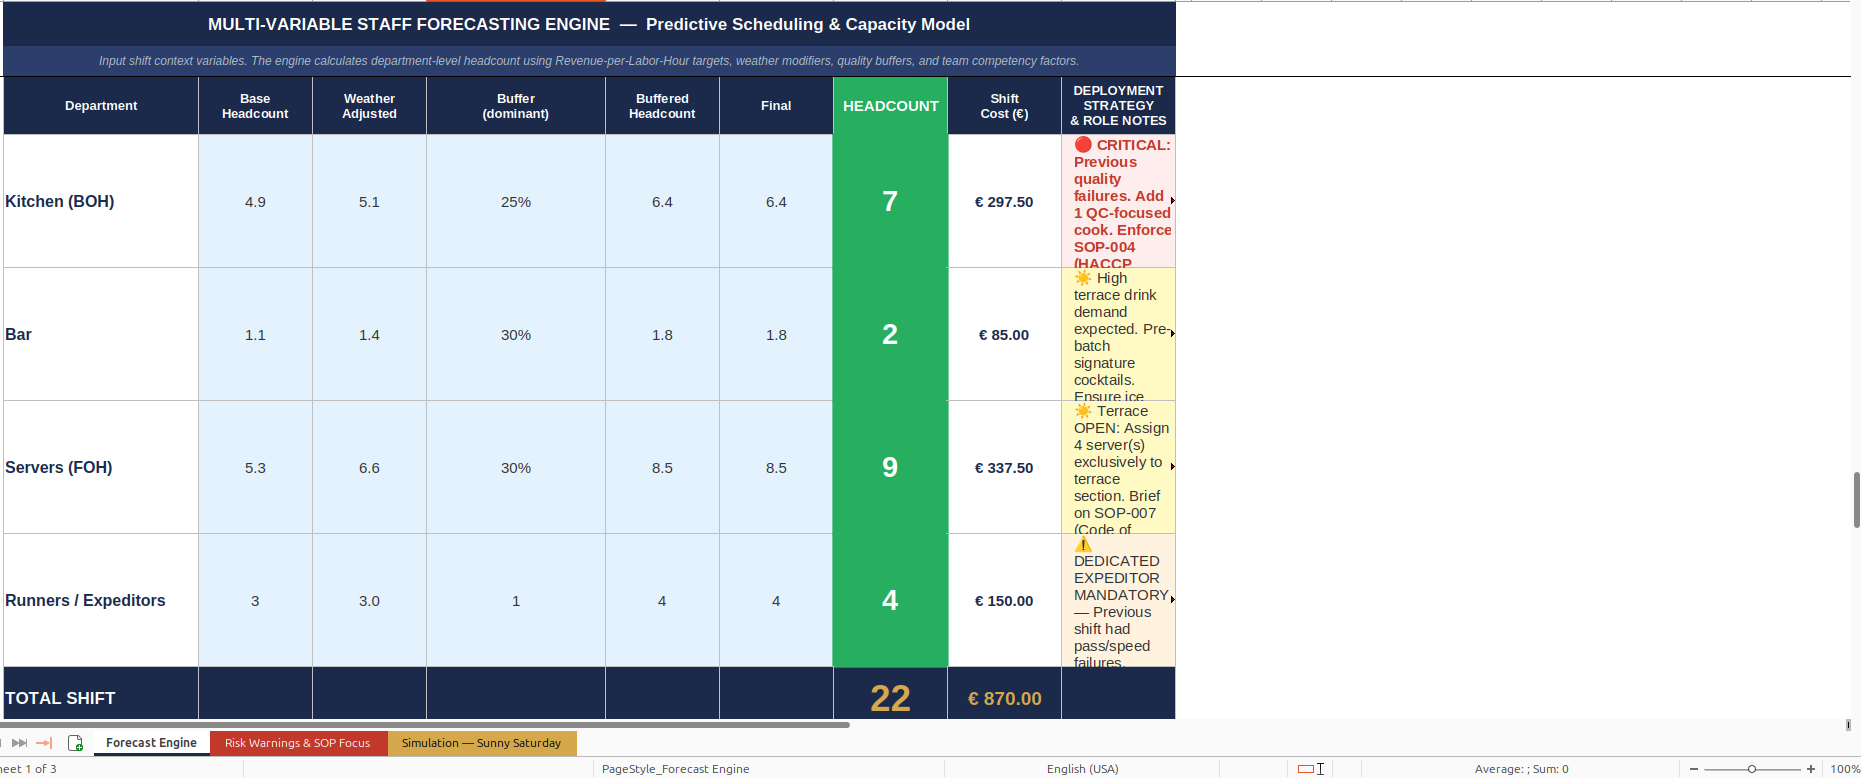
    Input shift context variables, and the engine calculates department-level headcount through a multi-stage pipeline:

    • Inputs:

      • Day of week.

      • Weather forecast (Sun/Rain/Heatwave/Storm).

      • Local events.

      • Terrace status.

      • Historical same-day revenue.

      • Previous shift quality indicators (speed complaints, quality complaints, bottleneck area).

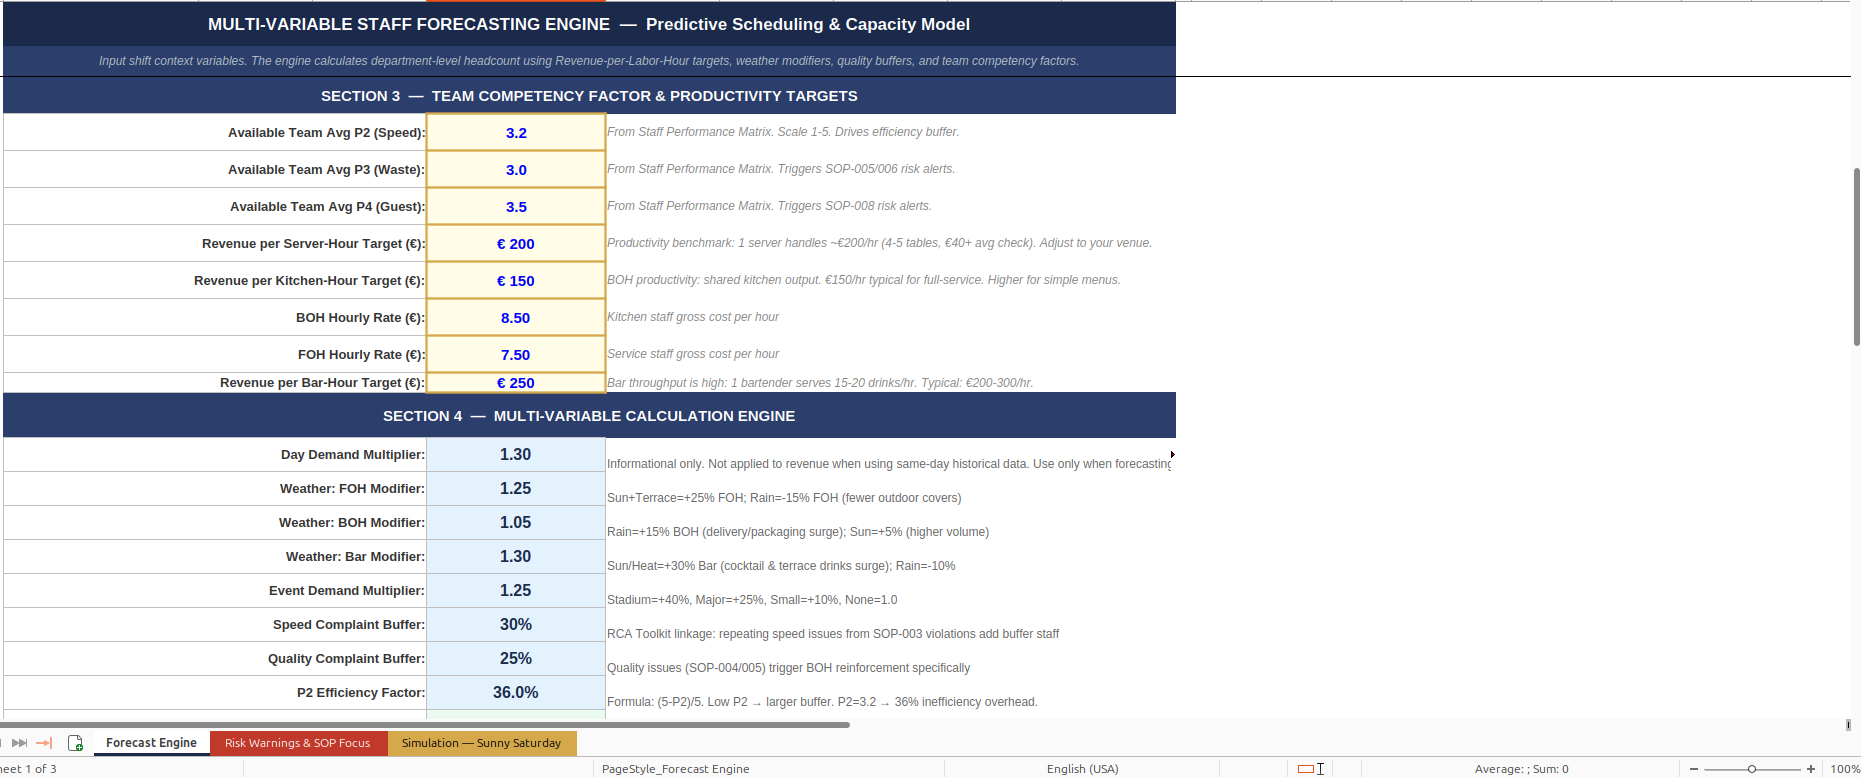
      • Team competency scores (P2 Speed, P3 Waste, P4 Guest averages from the Performance Matrix).

      • RevPLH targets per department.

    • Calculation Engine:

      • Revenue projection → revenue allocation by department (Kitchen 70%, Bar 25%, Servers 100%, Runners cover-derived).

      • Weather modifiers applied per department (Sun boosts Bar +30%, Rain shifts BOH +15%).

      • Dominant buffer selection (quality or efficiency, whichever is larger).

      • Headcount rounded up → shift cost calculated.

    • Outputs:

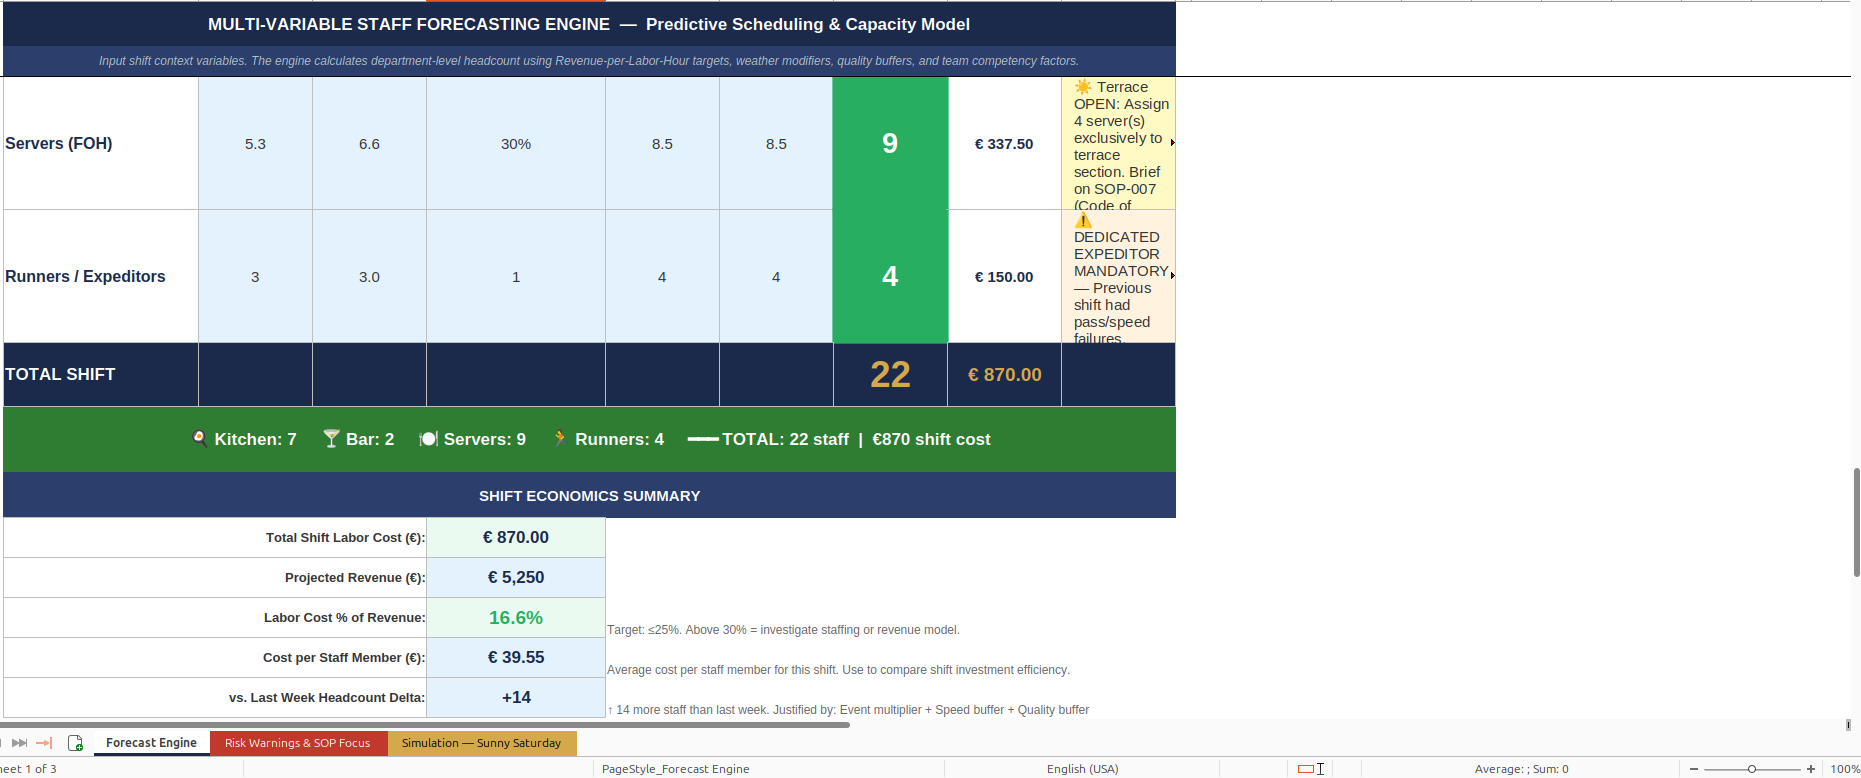
      • Department-level headcount (Kitchen, Bar, Servers, Runners/Expeditors) with conditional deployment notes.

      • Shift economics (total cost, labor cost % of revenue, cost per staff member).

      • Headcount delta vs. previous week with justification.

    • Risk Warnings & SOP Focus:

      • Automated alerts triggered by team P2/P3/P4 averages.

      • Low P3 triggers SOP-006 (Receiving) morning check reminder.

      • Low P4 triggers SOP-008 (Complaint Management) briefing + SOP-009 (GDPR) data handling reminder.

    • Pre-Shift Briefing — print-ready operational intelligence report with shift overview, volume breakdown, SOP focus areas, risk alerts, and sign-off section.

9 SOP Documents (Editable .docx)
  • SOP-001 — What Are SOPs & Why We Need Them | Onboarding foundation, how to use SOPs, mandatory compliance.

  • SOP-002 — Personal Hygiene | Danger zone (5-60°C), cooking temps, FIFO, cross-contamination, cooling.

  • SOP-003 — Workplace Safety | PPE, slip prevention, knife safety, burn protocol, PASS fire method.

  • SOP-004 — HACCP Principles | Danger zone (5-60°C), cooking temps, FIFO, cross-contamination, cooling.

  • SOP-005 — Cleaning & Disinfection | 5-step process, color-coded system (Red/Yellow/Blue/Green), chemical safety.

  • SOP-006 — Receiving & Verifying Goods | 8-step receiving, temperature checks, quality inspection, rejection protocol.

  • SOP-007 — Professional Code of Conduct | 10/5 Rule, L.A.S.T. method, zero-tolerance policies, reporting.

  • SOP-008 — Guest Complaint Management | L.E.A.R.N. Method, empowerment guidelines, difficult situations, documentation.

  • SOP-009 — Confidentiality & GDPR | 6 GDPR principles, guest rights, data breach 72-hour protocol, retention periods.

All documents follow a consistent professional format:
Purpose → Detailed procedures → FAQ → Summary → Golden Rule → Signatures → Revision History.

Fully editable — add your logo, company name, and customize for your operation.


Industries & Use Cases
  • Full-service restaurants (fine dining, casual dining, bistro, brasserie).

  • Hotel F&B departments (multi-outlet, room service, banqueting).

  • HoReCa consulting engagements (client-ready diagnostic framework).

  • Franchise and multi-unit operations (standardization and benchmarking).

  • Catering companies and event F&B operations.

  • River cruise, resort, and seasonal hospitality F&B.

  • Restaurant management training programs and hospitality schools.

Author Background

12+ years in European F&B operations.
Certifications:

  • HACCP.

  • ISO 22000:2018.

  • BarSmarts Professional (Pernod Ricard).

  • ESSEC Hotel Revenue & Distribution Management.
    Degree in Agronomy Engineering — understanding the food supply chain from raw material quality through to guest plate.

This toolkit codifies the operational frameworks, diagnostic logic, and SOP standards developed across fine dining, European river cruise, and hotel F&B environments. Every formula, every diagnostic rule, and every SOP procedure comes from real operational experience — not from a textbook.

This Best Practice includes
This premium ecosystem consists of 4 Advanced Diagnostic Engines (Excel) and 9 Comprehensive SOPs (docx)

Acquire business license for $149.00

Add to cart

Add to bookmarks

Discuss

Further information

The most comprehensive F&B operational toolkit on any marketplace. 4 integrated Excel workbooks with 1,057 formulas (zero errors) plus 9 professional SOP documents. The Staff Performance Matrix identifies 7 behavioral archetypes and auto-generates corrective action plans. The RCA Toolkit diagnoses 10 operational symptoms using Ishikawa analysis. The Food Cost & ROI Tracker goes beyond basic costing — it includes a composite Performance Rating system, Boston Matrix quadrant classification (Star/Plowhorse/Puzzle/Dog), Profit Contribution analysis, and a What-If Scenario Simulator for testing price changes before implementation. The Staff Forecasting Engine calculates department-level headcount using weather modifiers, quality buffers, and team competency factors. Every tool cross-references the same 9 SOPs (001-009, including GDPR). Built by a consultant with 12+ years in European F&B operations across River Cruises, fine dining, and hotel environments. Not a template pack — an integrated management intelligence system.

Who is this for?


Restaurant owners who want consultant-grade tools without consultant-grade fees


F&B Managers stepping into their first GM role


Hotel F&B Directors standardizing operations across outlets


HoReCa consultants who need a ready-made diagnostic framework for client engagements


Franchise operators building SOPs for multi-unit consistency

Who is this NOT for?


Someone looking for a simple food cost calculator (use a free one)


Operations that don't want to measure, diagnose, or improve (this toolkit demands data)


0.0 / 5 (0 votes)

please wait...