


Originally published: 16/02/2018 14:23
Publication number: ELQ-84601-1
View all versions & Certificate
Publication number: ELQ-84601-1
View all versions & Certificate

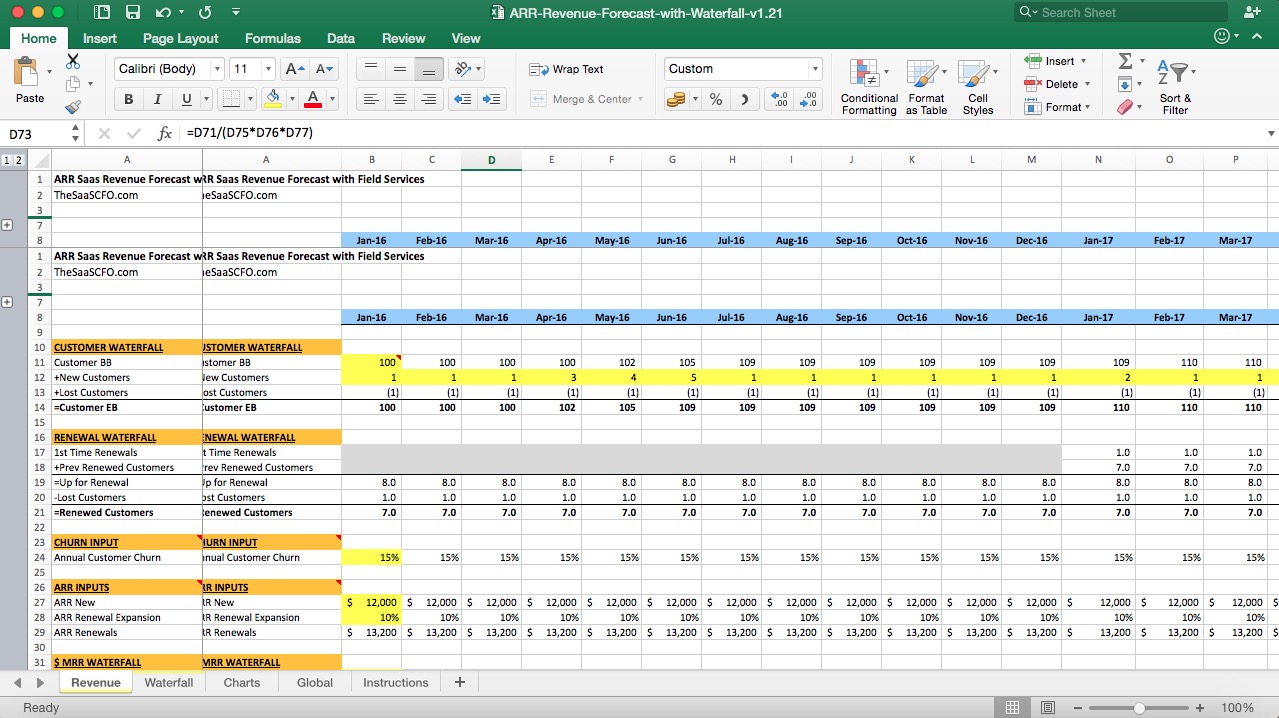
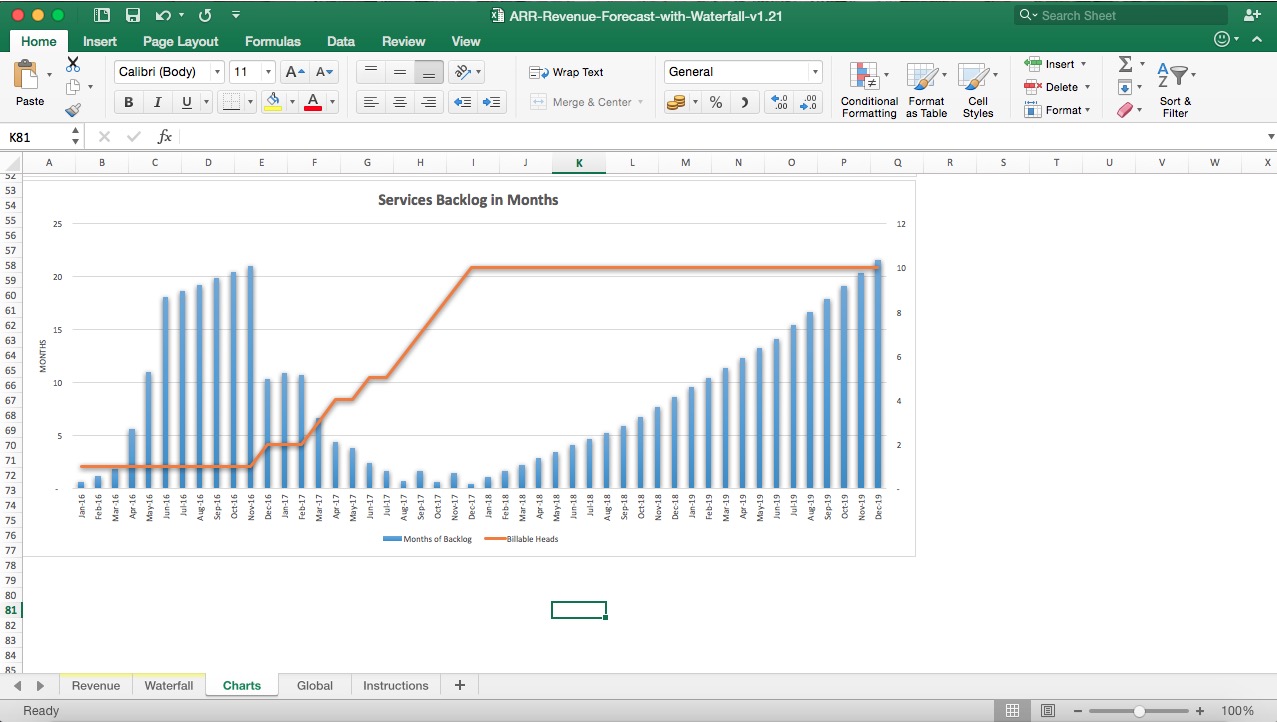
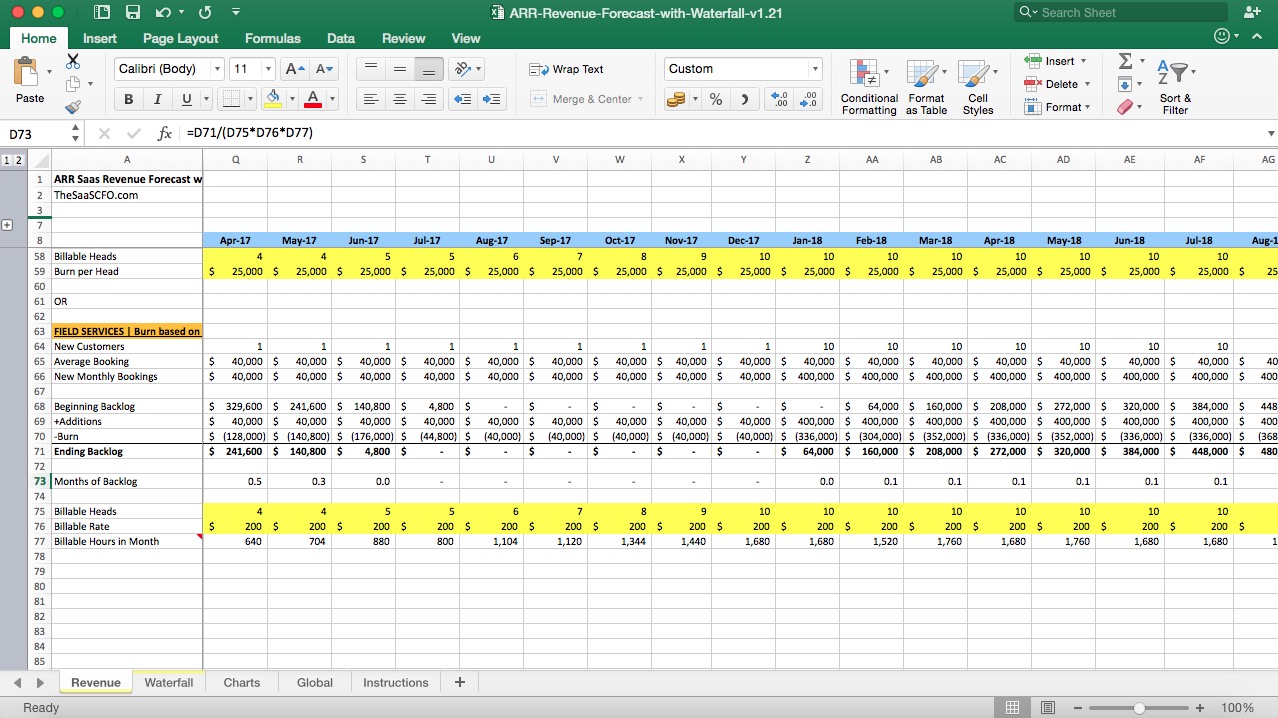
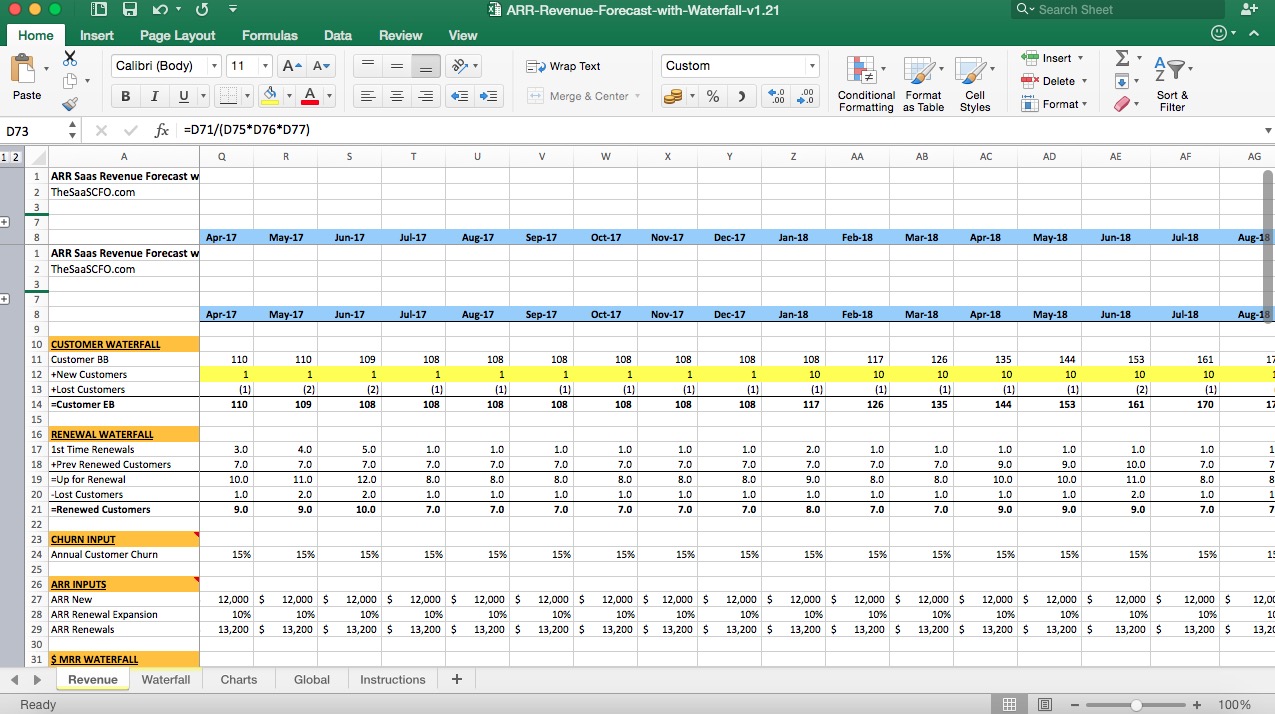
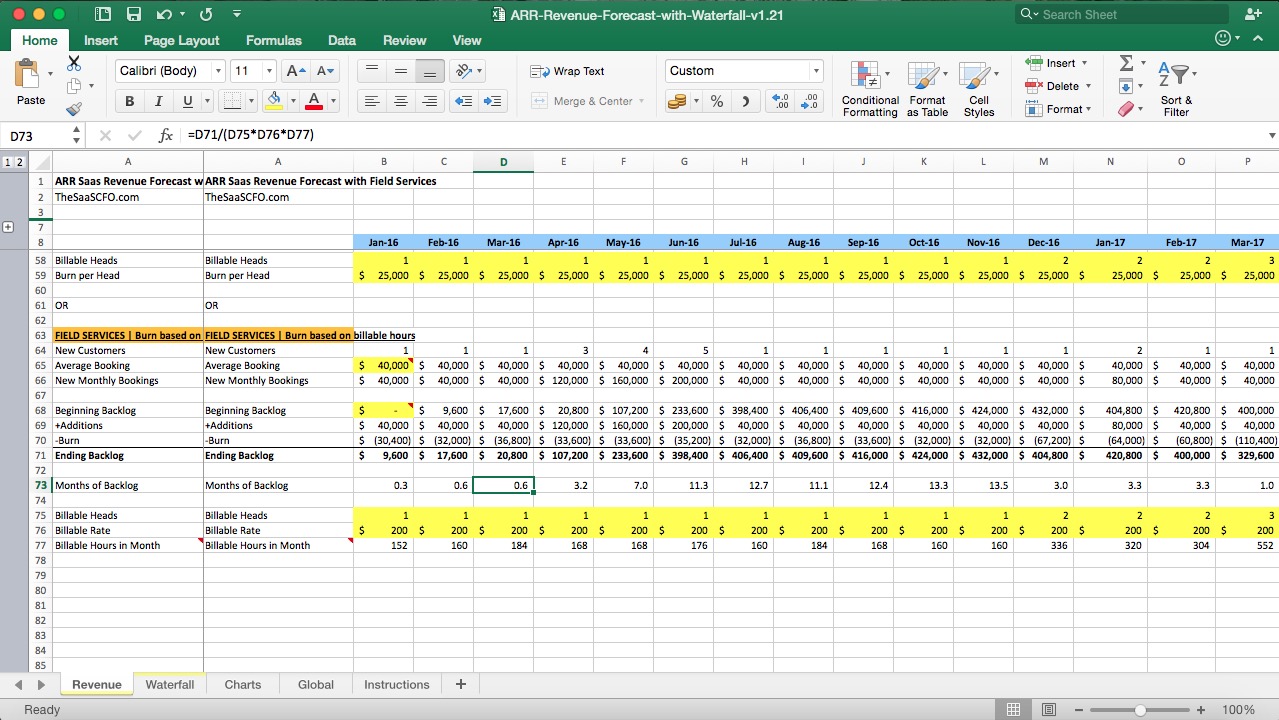
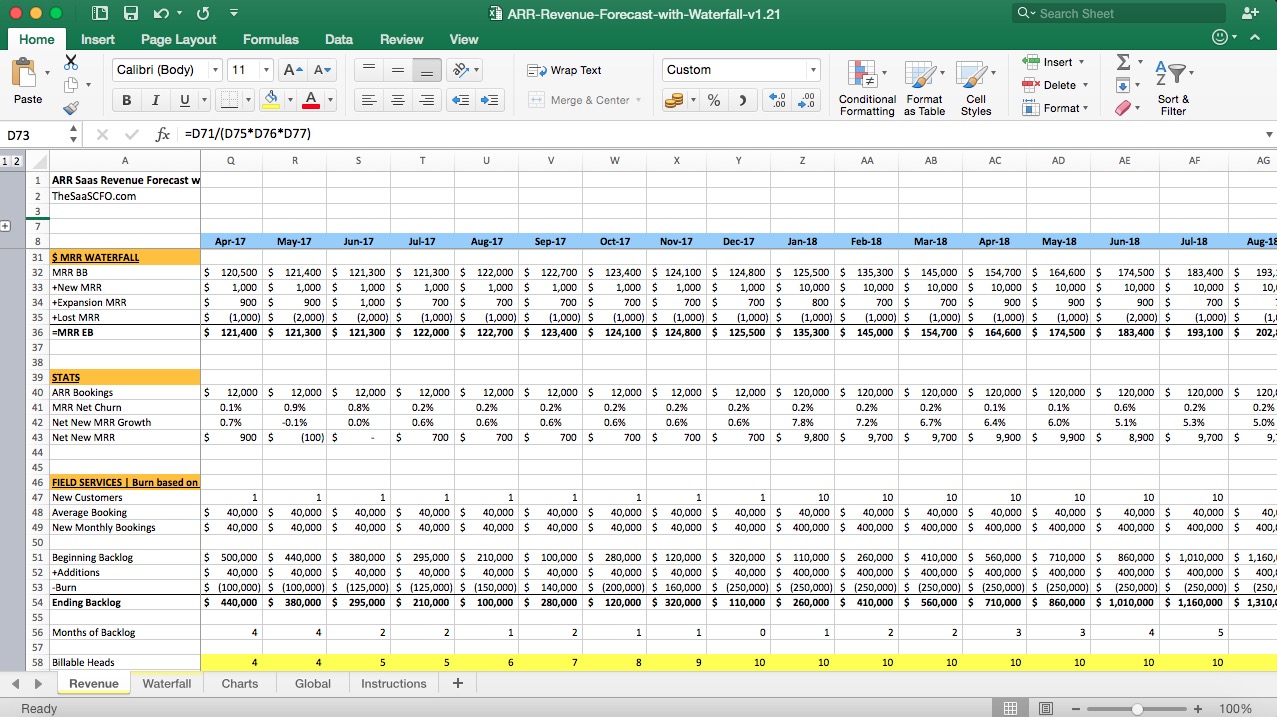
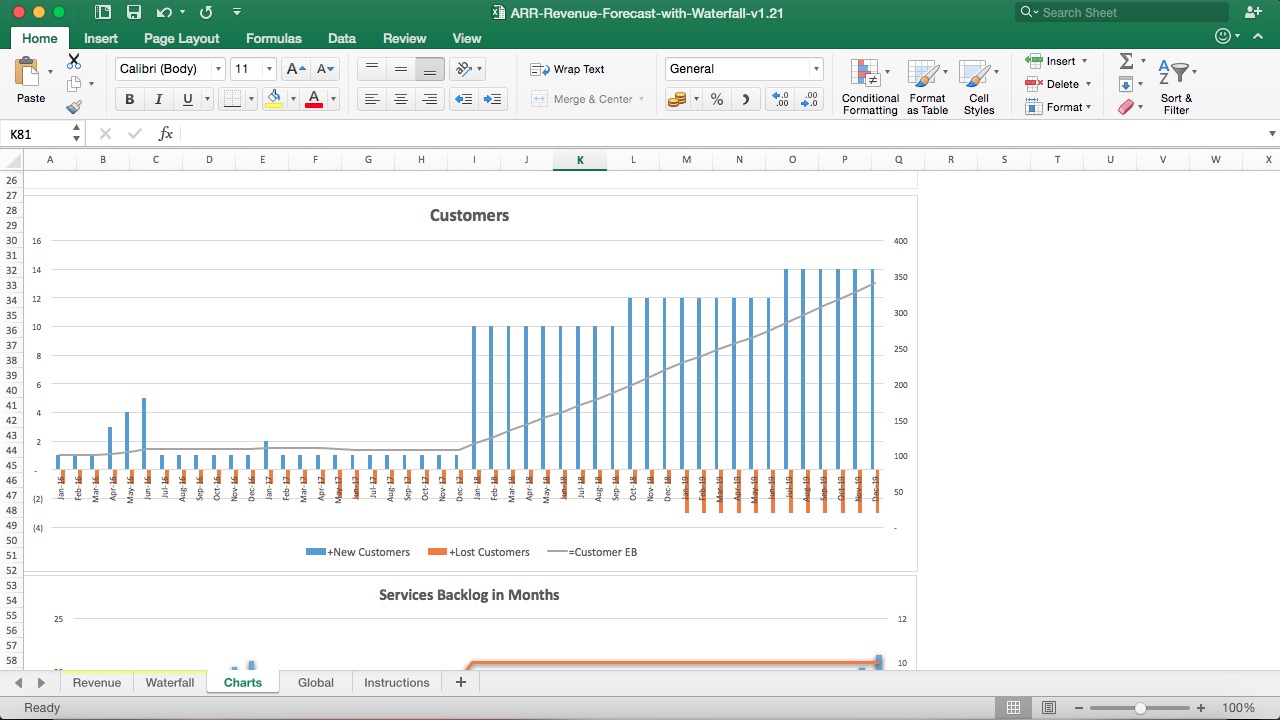
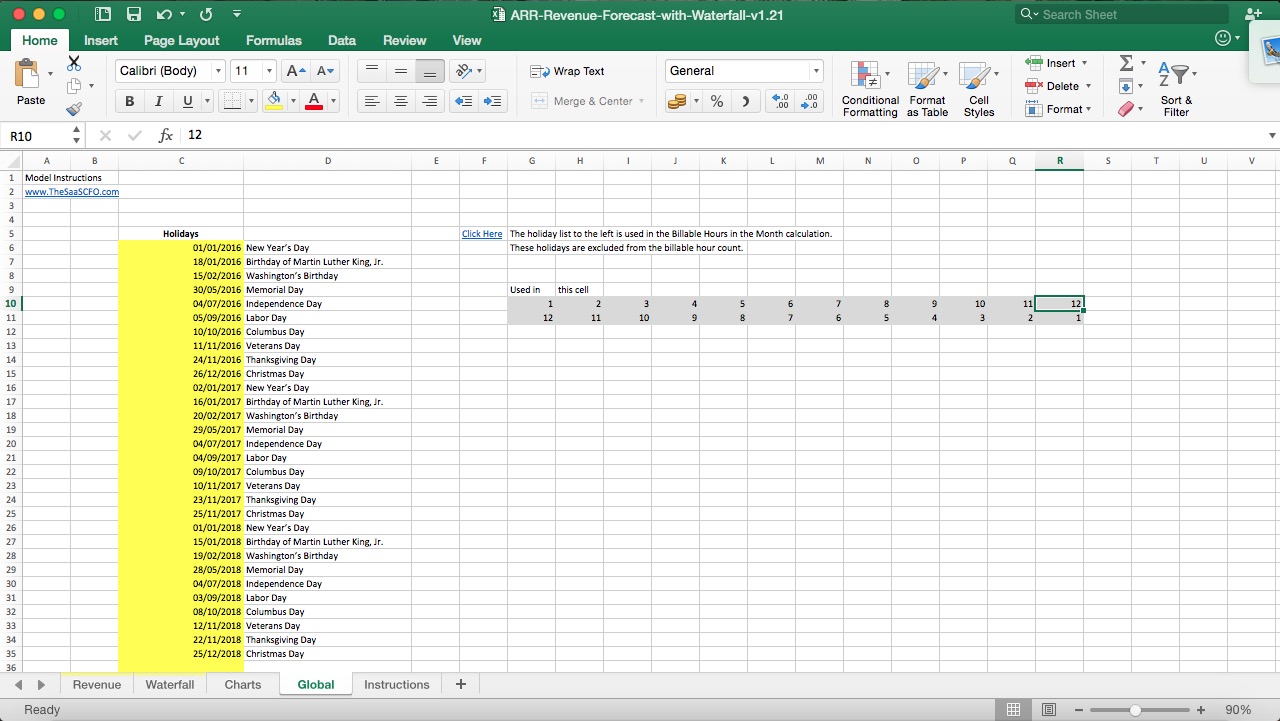
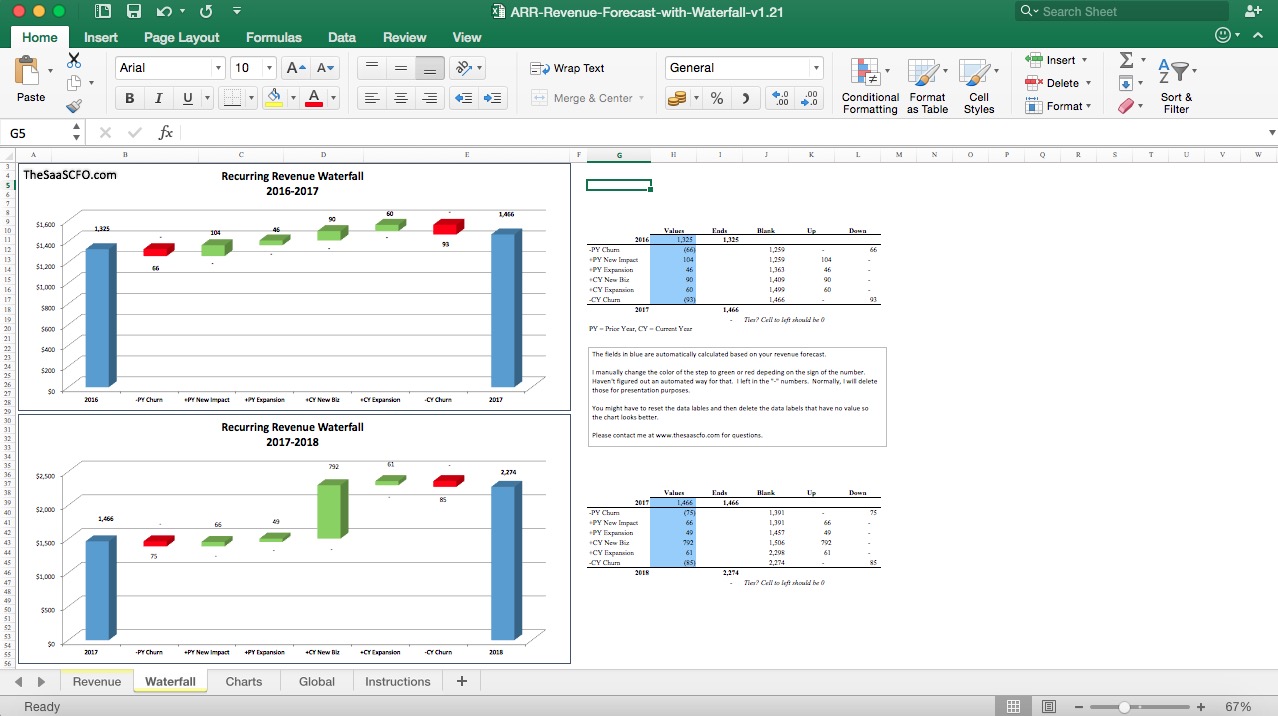
SaaS Revenue Waterfall Excel Chart Template
A SaaS Excel Model to help you forecast revenue waterfall in simple, automated charts.
