
Originally published: 19/05/2021 16:22
Last version published: 13/03/2025 09:11
Publication number: ELQ-76203-9
View all versions & Certificate
Last version published: 13/03/2025 09:11
Publication number: ELQ-76203-9
View all versions & Certificate

10-Year Lending Business Startup Model: Scaling 3 Loan Types
A lending business startup financial model with 10-year monthly and annual outputs. Includes 3-statement model. Includes option for rolling credit facility.
lending businessstatement modelfinancial modelyearloan amortizationscalingdcf analysisequity requirementirr
Description
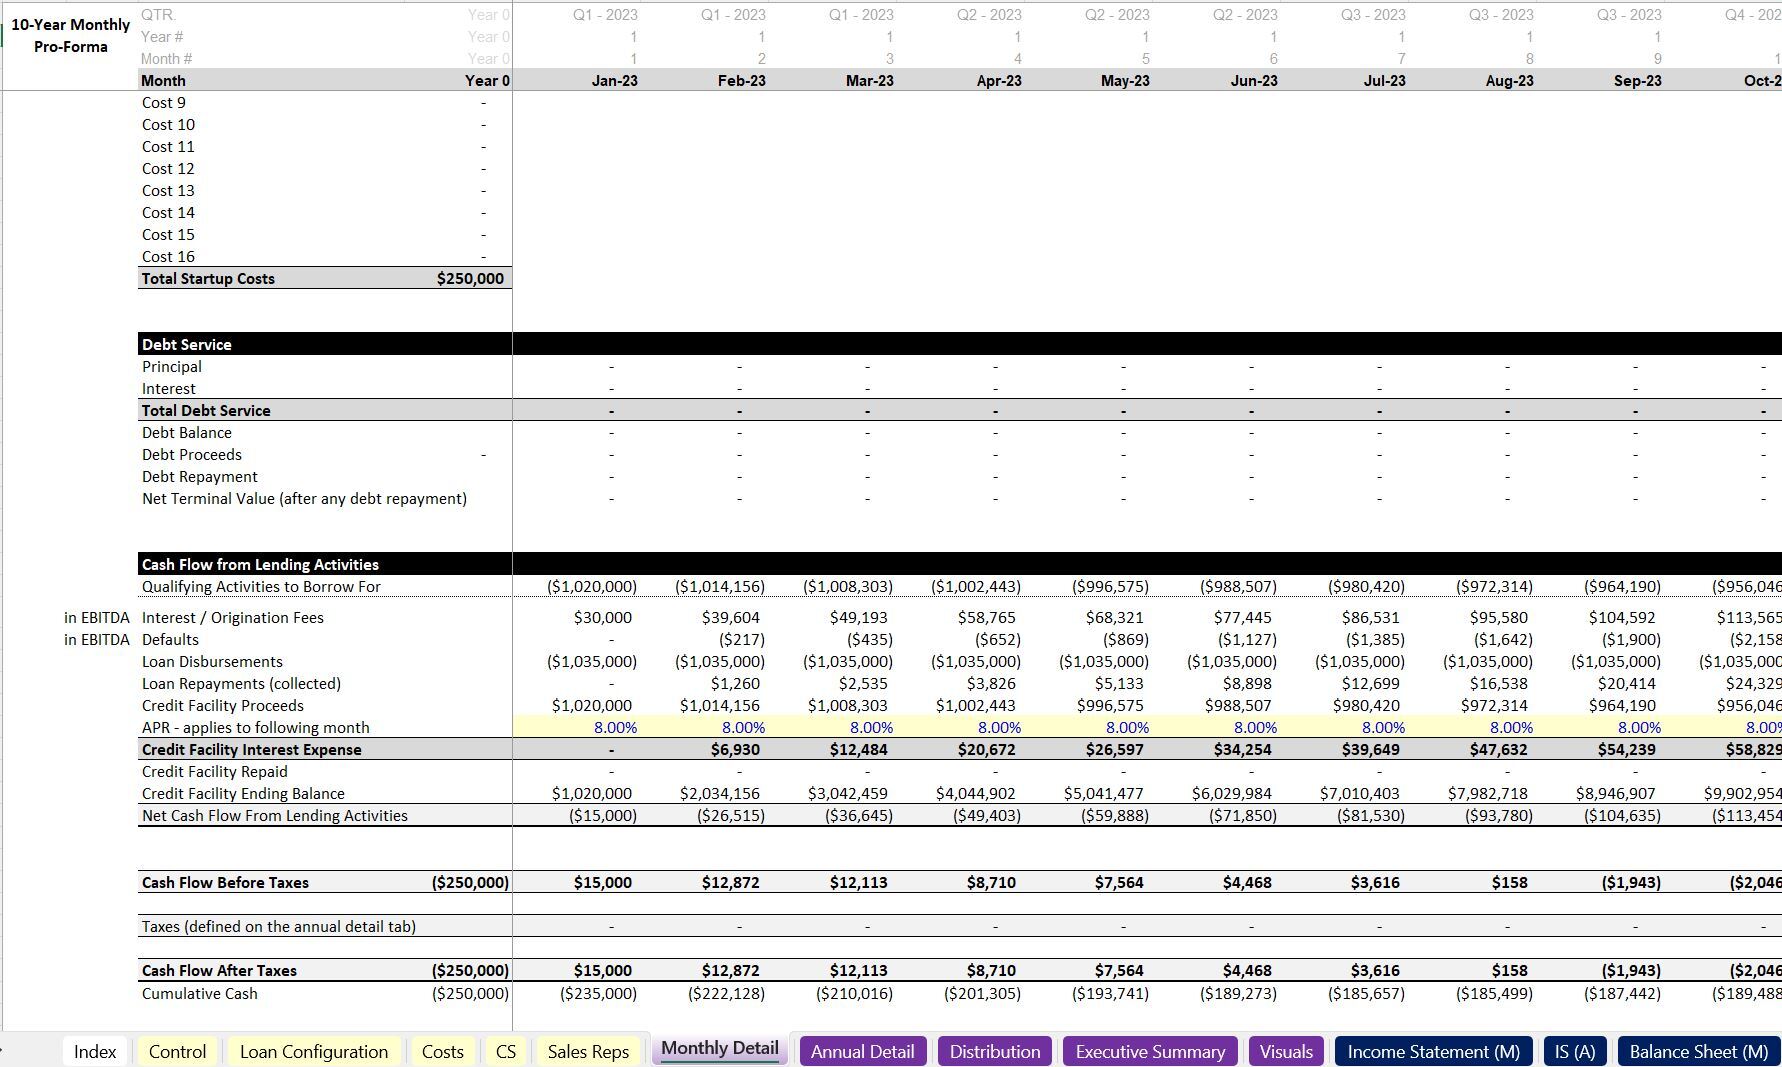
Recent upgrade: Added option to use a credit facility to fund a percentage of lending activity, added a percentage to define how much of the interest and fee revenue is recycled into new loans vs. used as working capital. Also, updated distribution / equity line items to work on an as needed basis rather than calculating the minimum equity required and assuming that is contributed up front in year 0.
Scaling the capital costs and general cash flow with various loan logic assumptions across time gets complicated really fast. If you are thinking about joining a p2p lender as a lending participate or starting and operating a lending business, this financial model will give you the most granular and accurate financial forecast based on up to 3 loan configurations that can be scaled to any loan count over time.
The first loan type is that of an interest-only period followed by a principal and interest repayment schedule. This on its own took 800 rows of logic on multiple tabs in order to solve. The timing of each months' new loan cohorts has to be referenced accurately i.e. how long the interest only period is and when the p+i period starts. Each has its own separate timeline and the number of months each one has been going for must be called out in order to work properly. This is all aggregated up to the primary 10-year monthly timeline.
The second loan type is interest-only, which is a bit easier than type 1 above because only the total loans originated and the average loan amount each month must be tracked and interest is charged each month according to the interest only rate input for as long as the term is. The term can be any number and can change over the 10-year period.
The third loan type is principal and interest so think more like a mortgage for homes on this type.
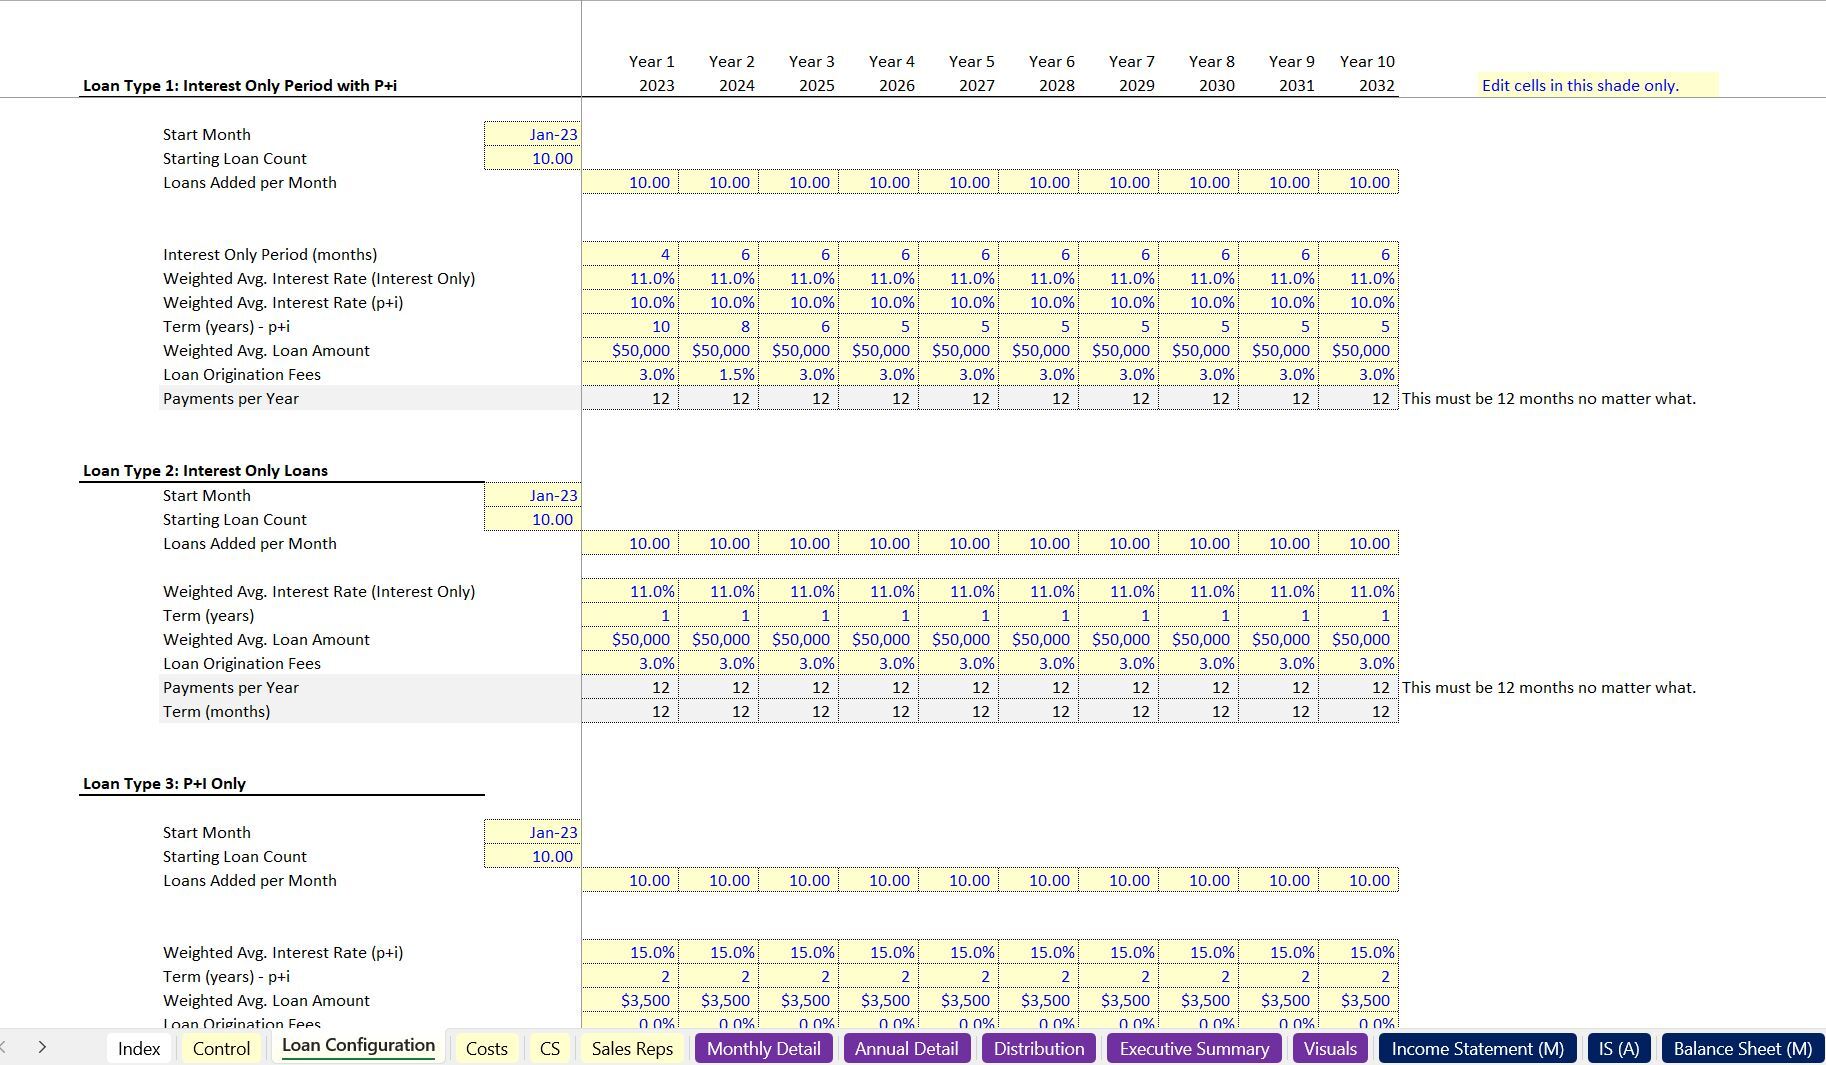
The start month and starting loan originations are defined per each type.
The following are configurable for loan type 1 in each of the 10-years:
1. Loans added per month
2. Interest-only term (months)
3. Interest-only period interest rate
4. Loan amount
5. p+i term (years)
6. p+i interest rate
7. Origination fee percentage
A default rate is defined once and applied to all loan repayments. When you are entering the assumptions for these loan types, think of them as weighted averages of what you expect loan originations to look like over time.
Similar inputs were built for interest-only loans and principal + interest loans.
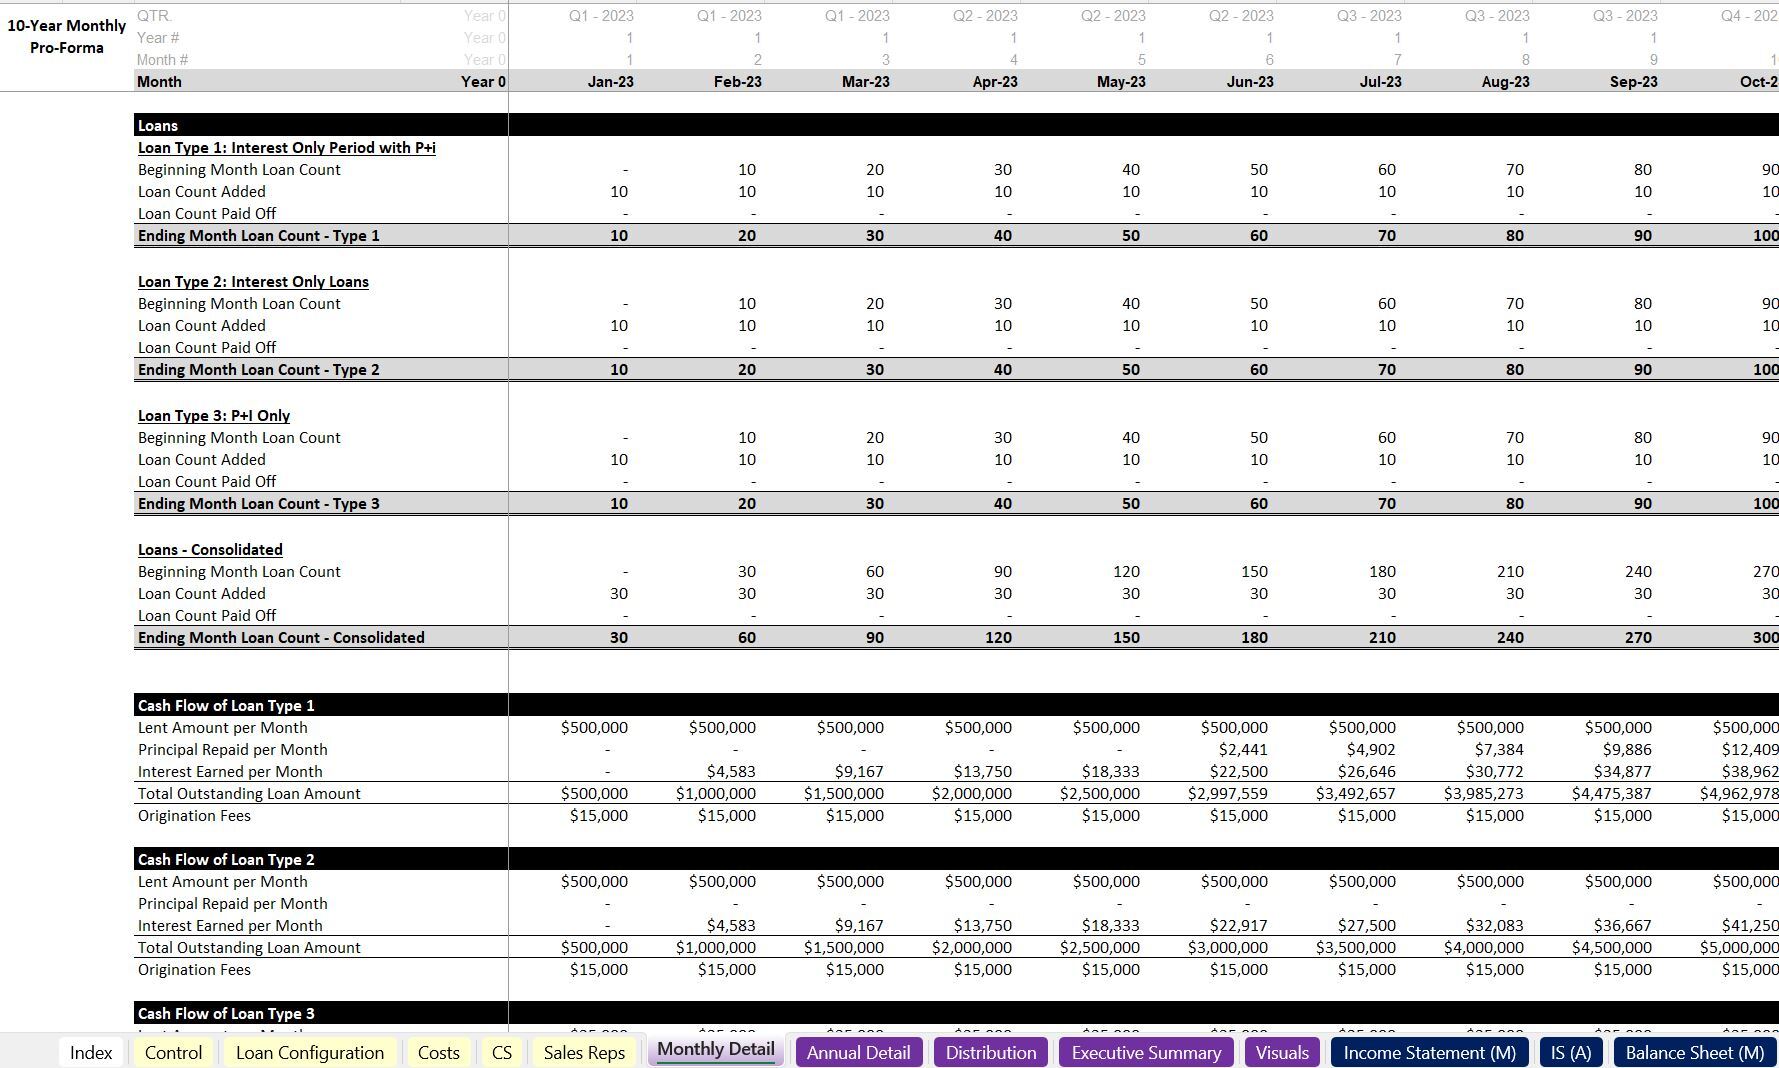
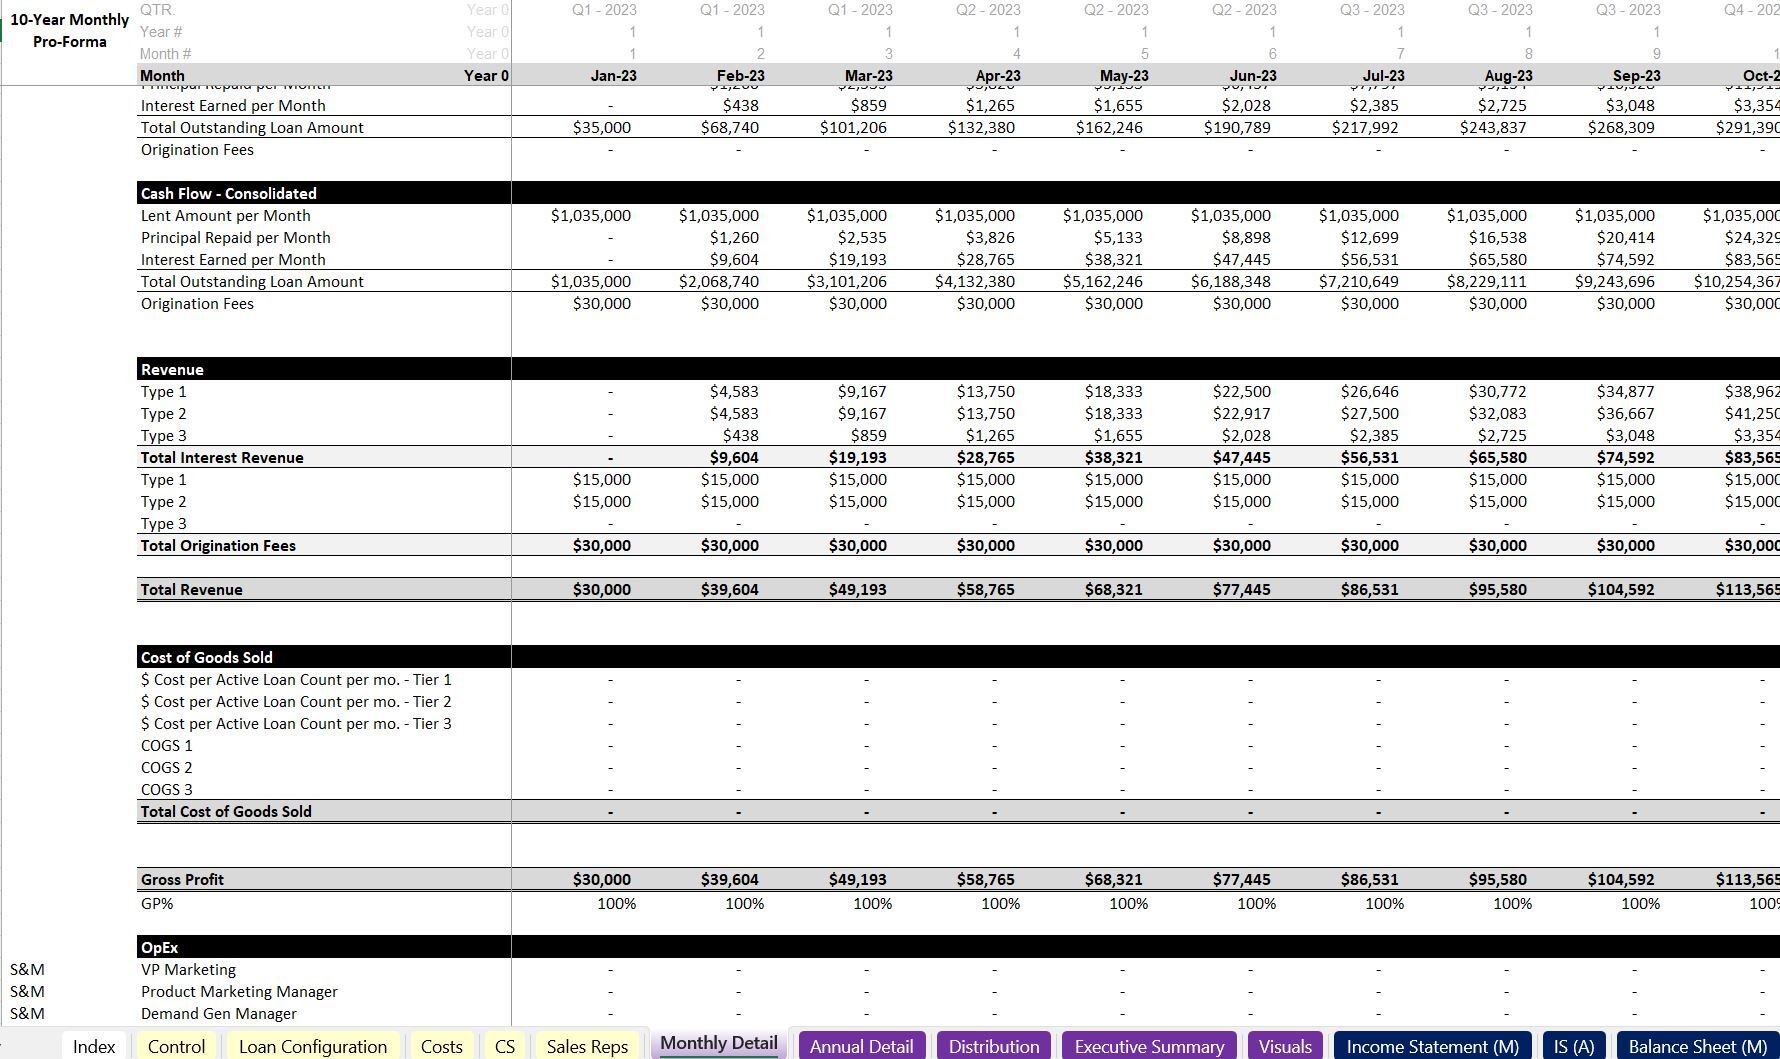
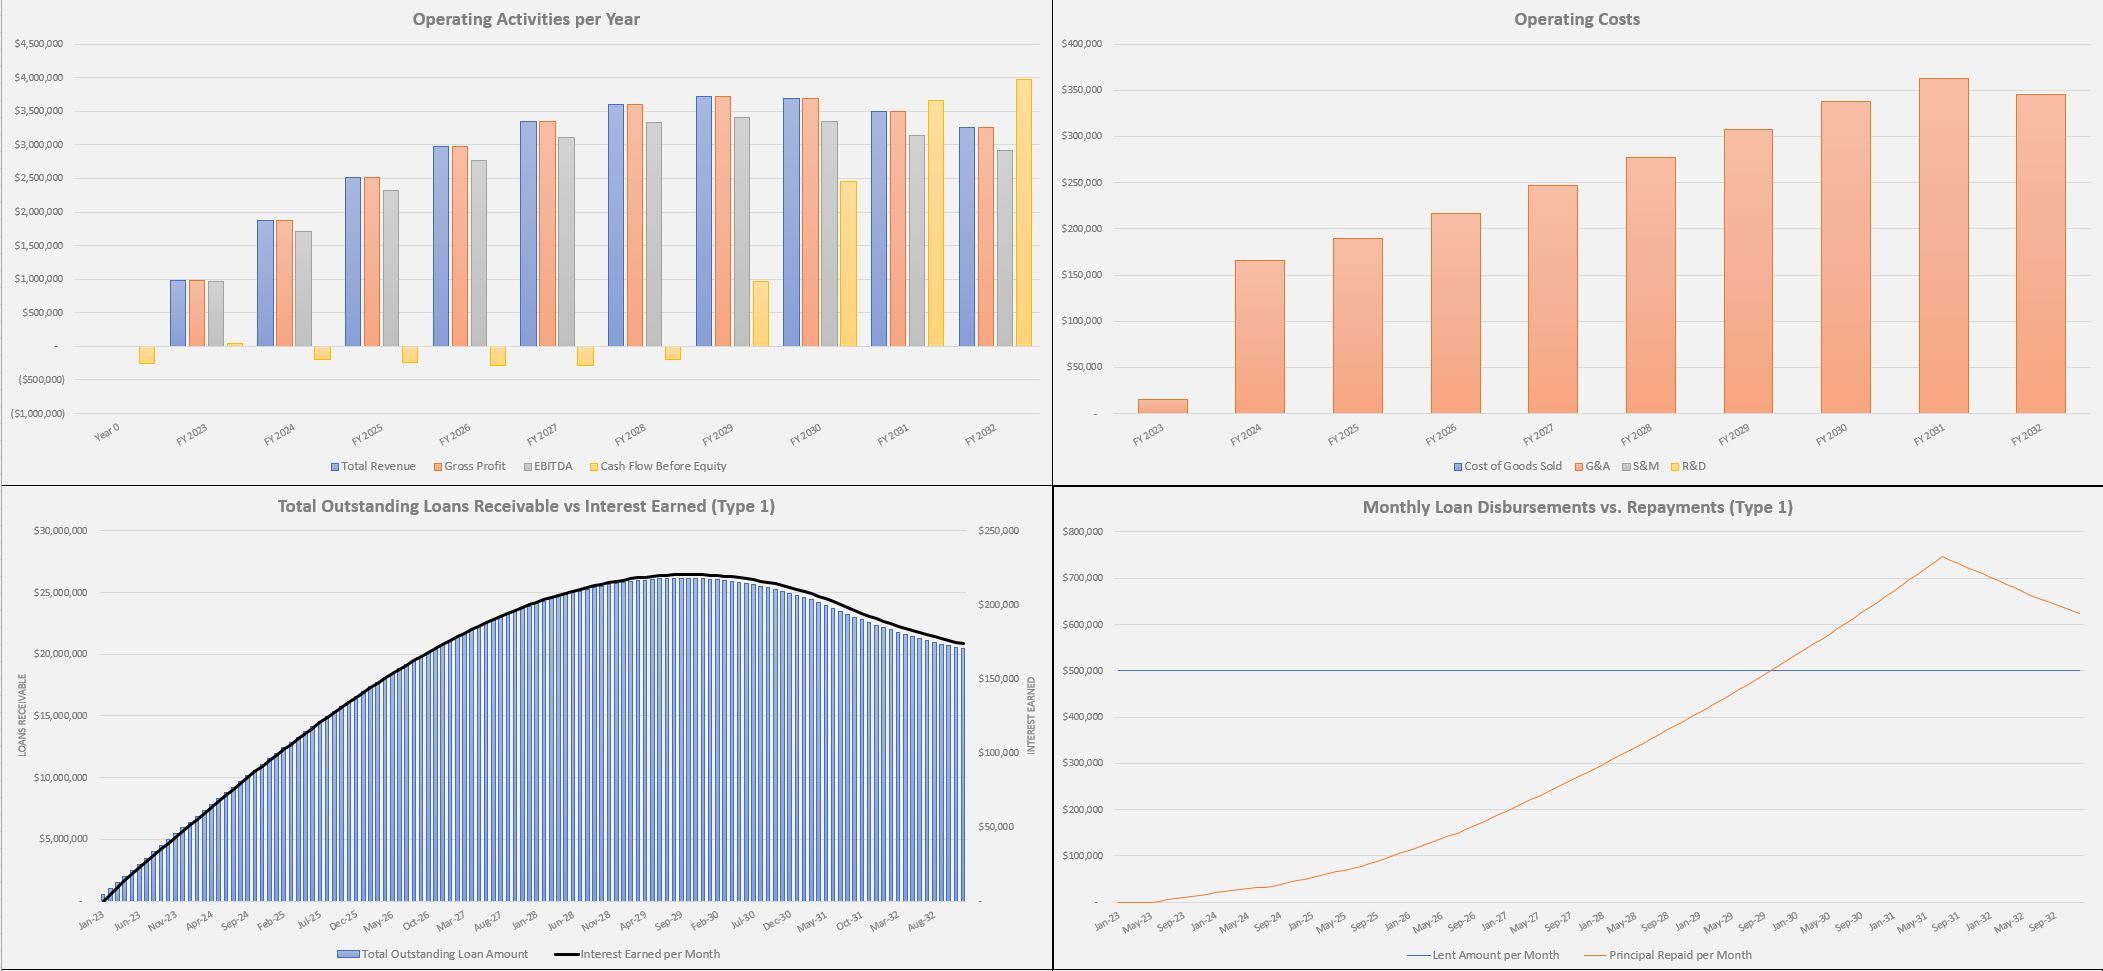
Based on those assumptions, the loan disbursements, principal repayments, origination fees, and interest revenue are all calculated per month in aggregate. It is assumed that repayments always start one month after the loans are settled. This is some of the most difficult logic to do without your standard amortization schedule. Essentially, the matrix tabs are amortization schedules, but they are done in a monthly cohort style where the timing, principal/interest payments, and repayments can all be calculated across the same timeline correctly.
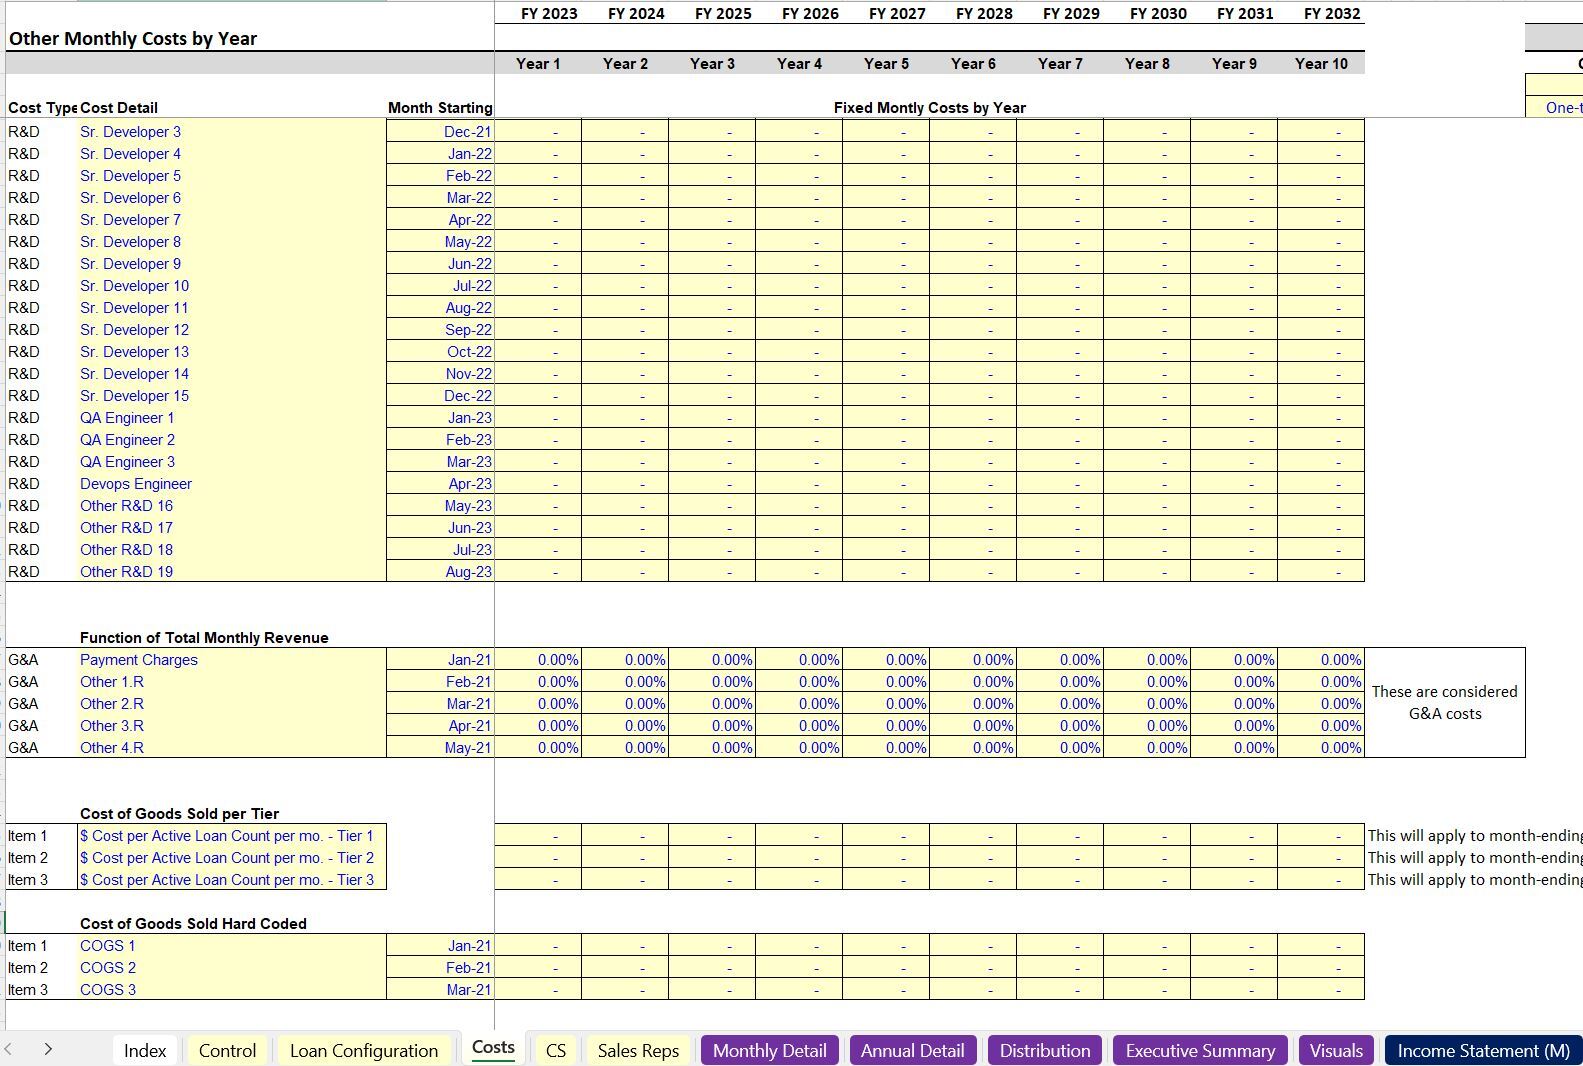
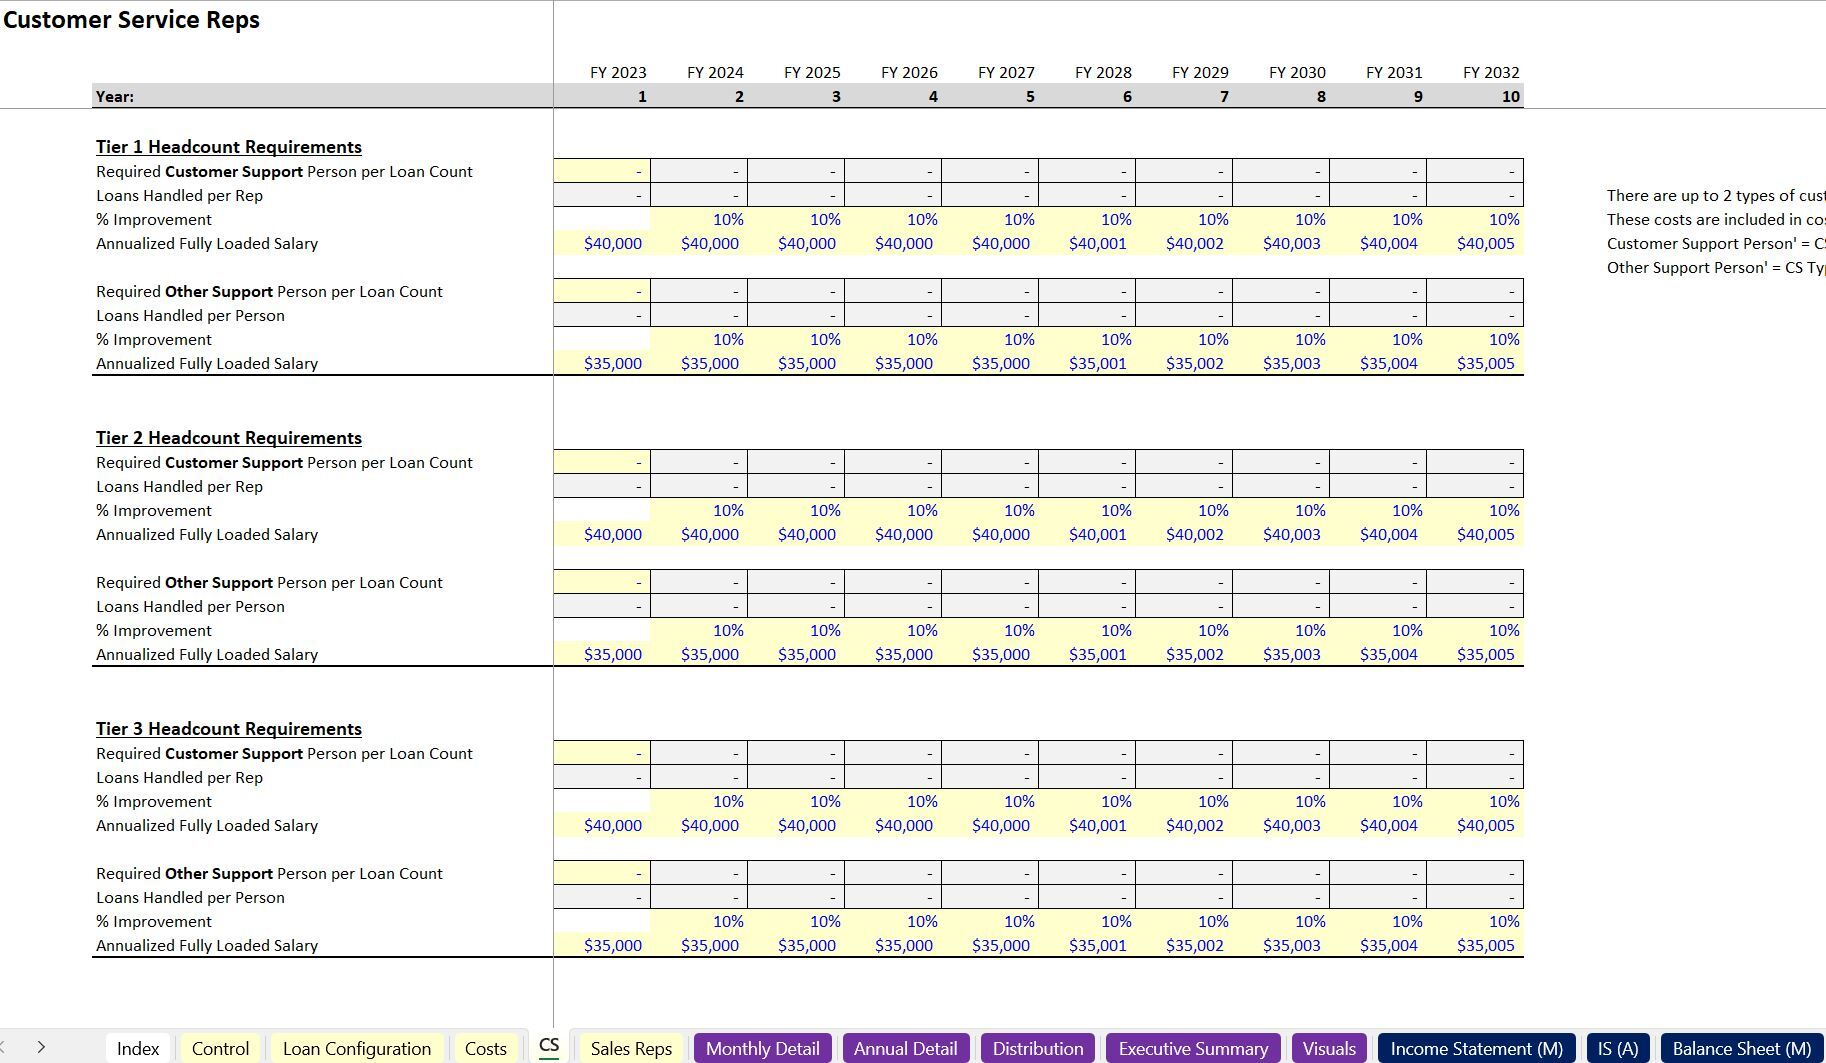
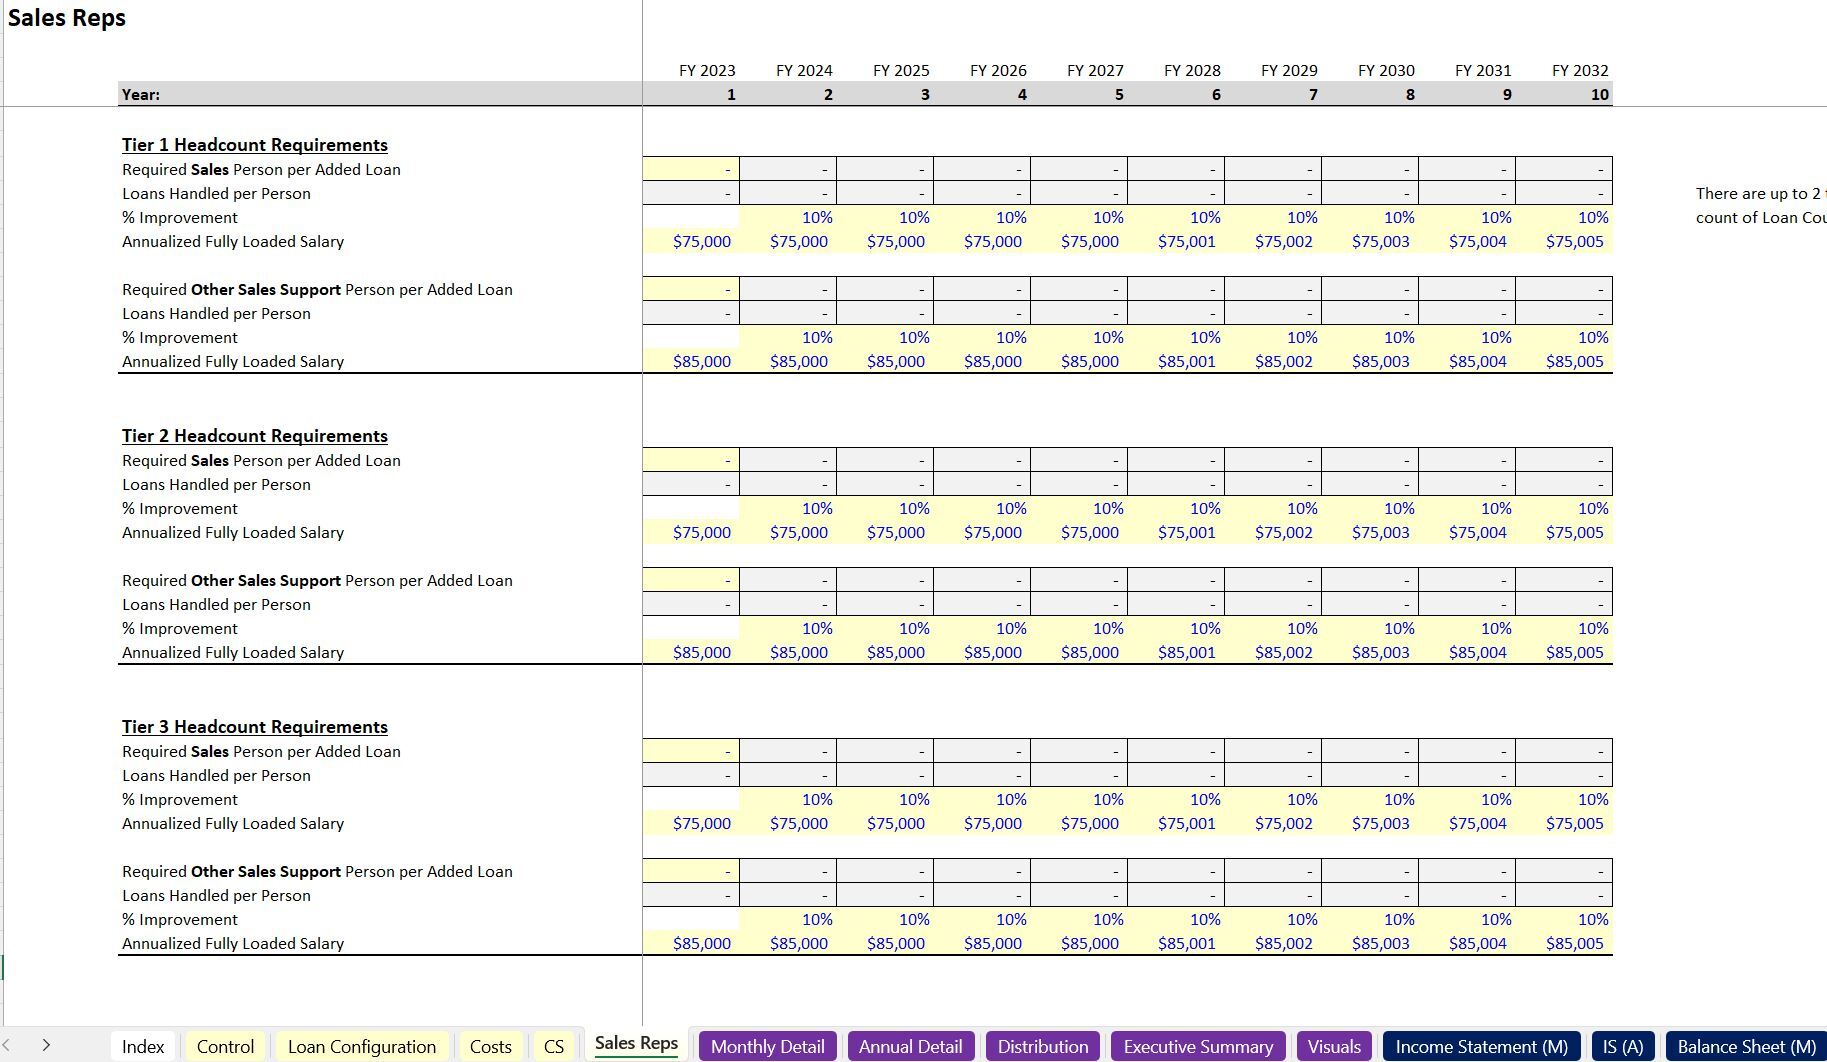
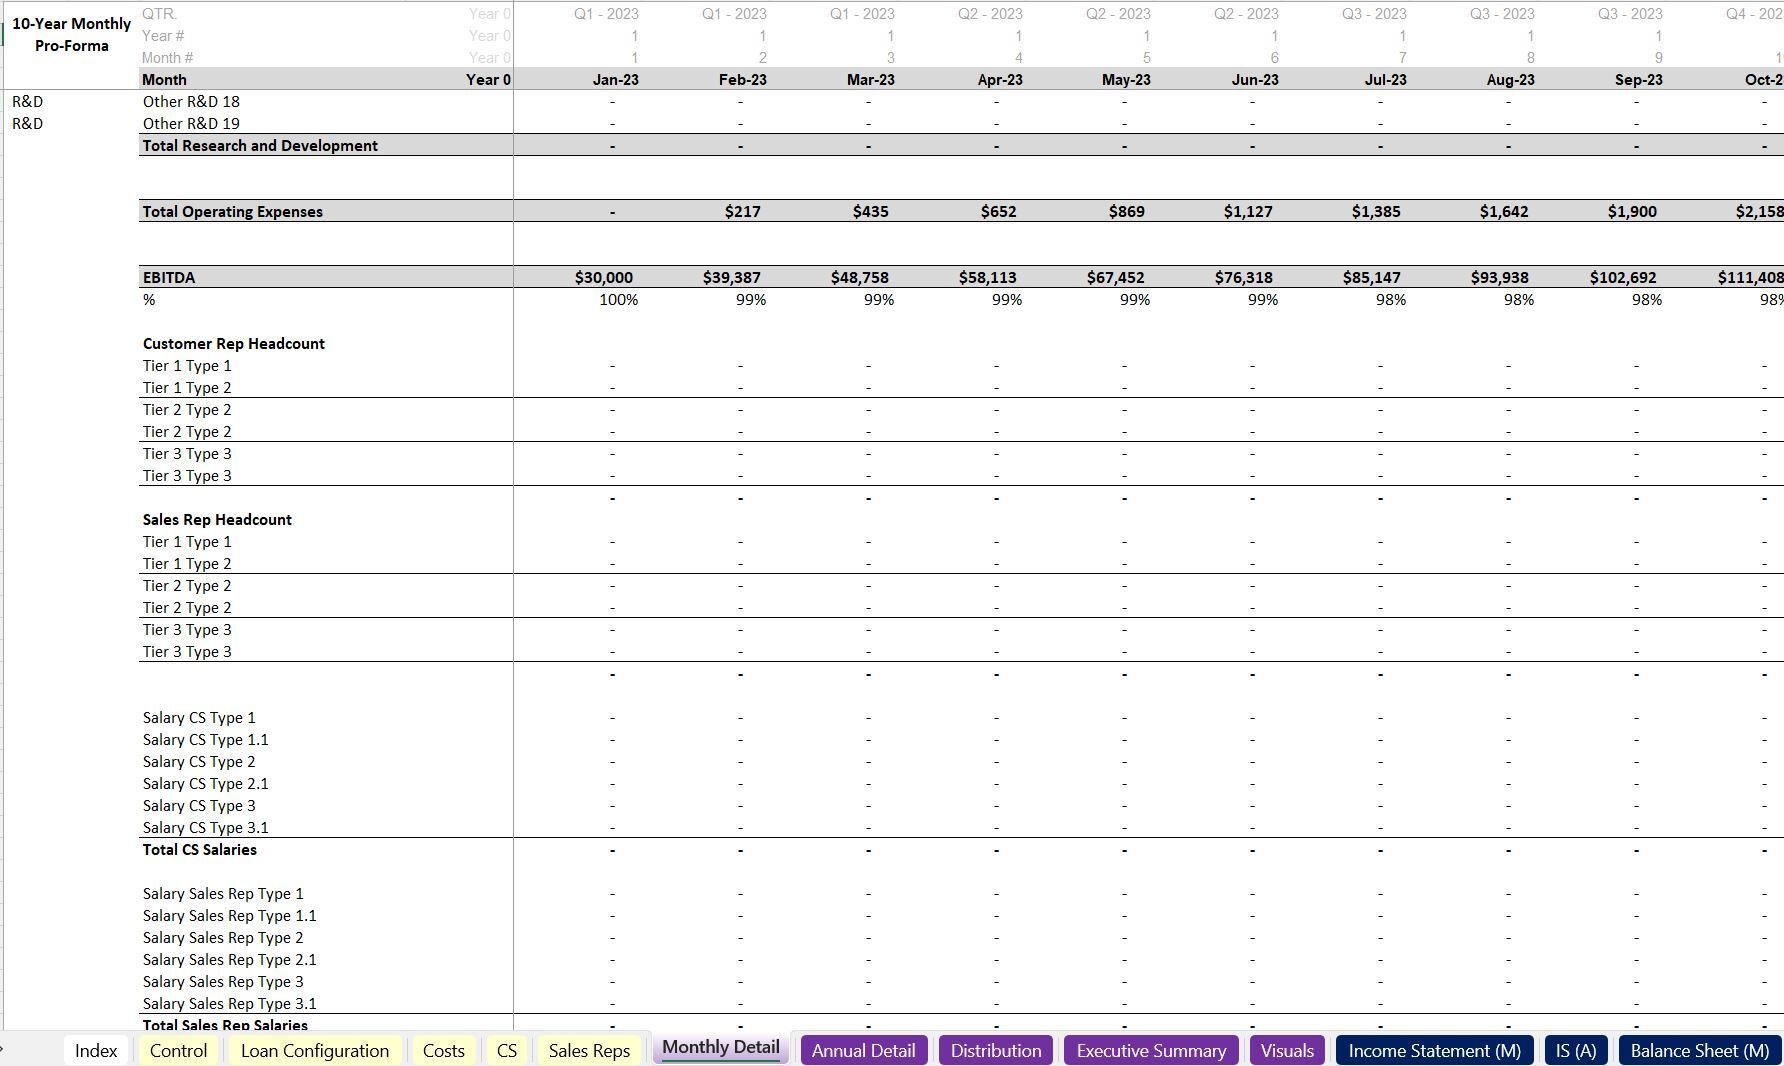
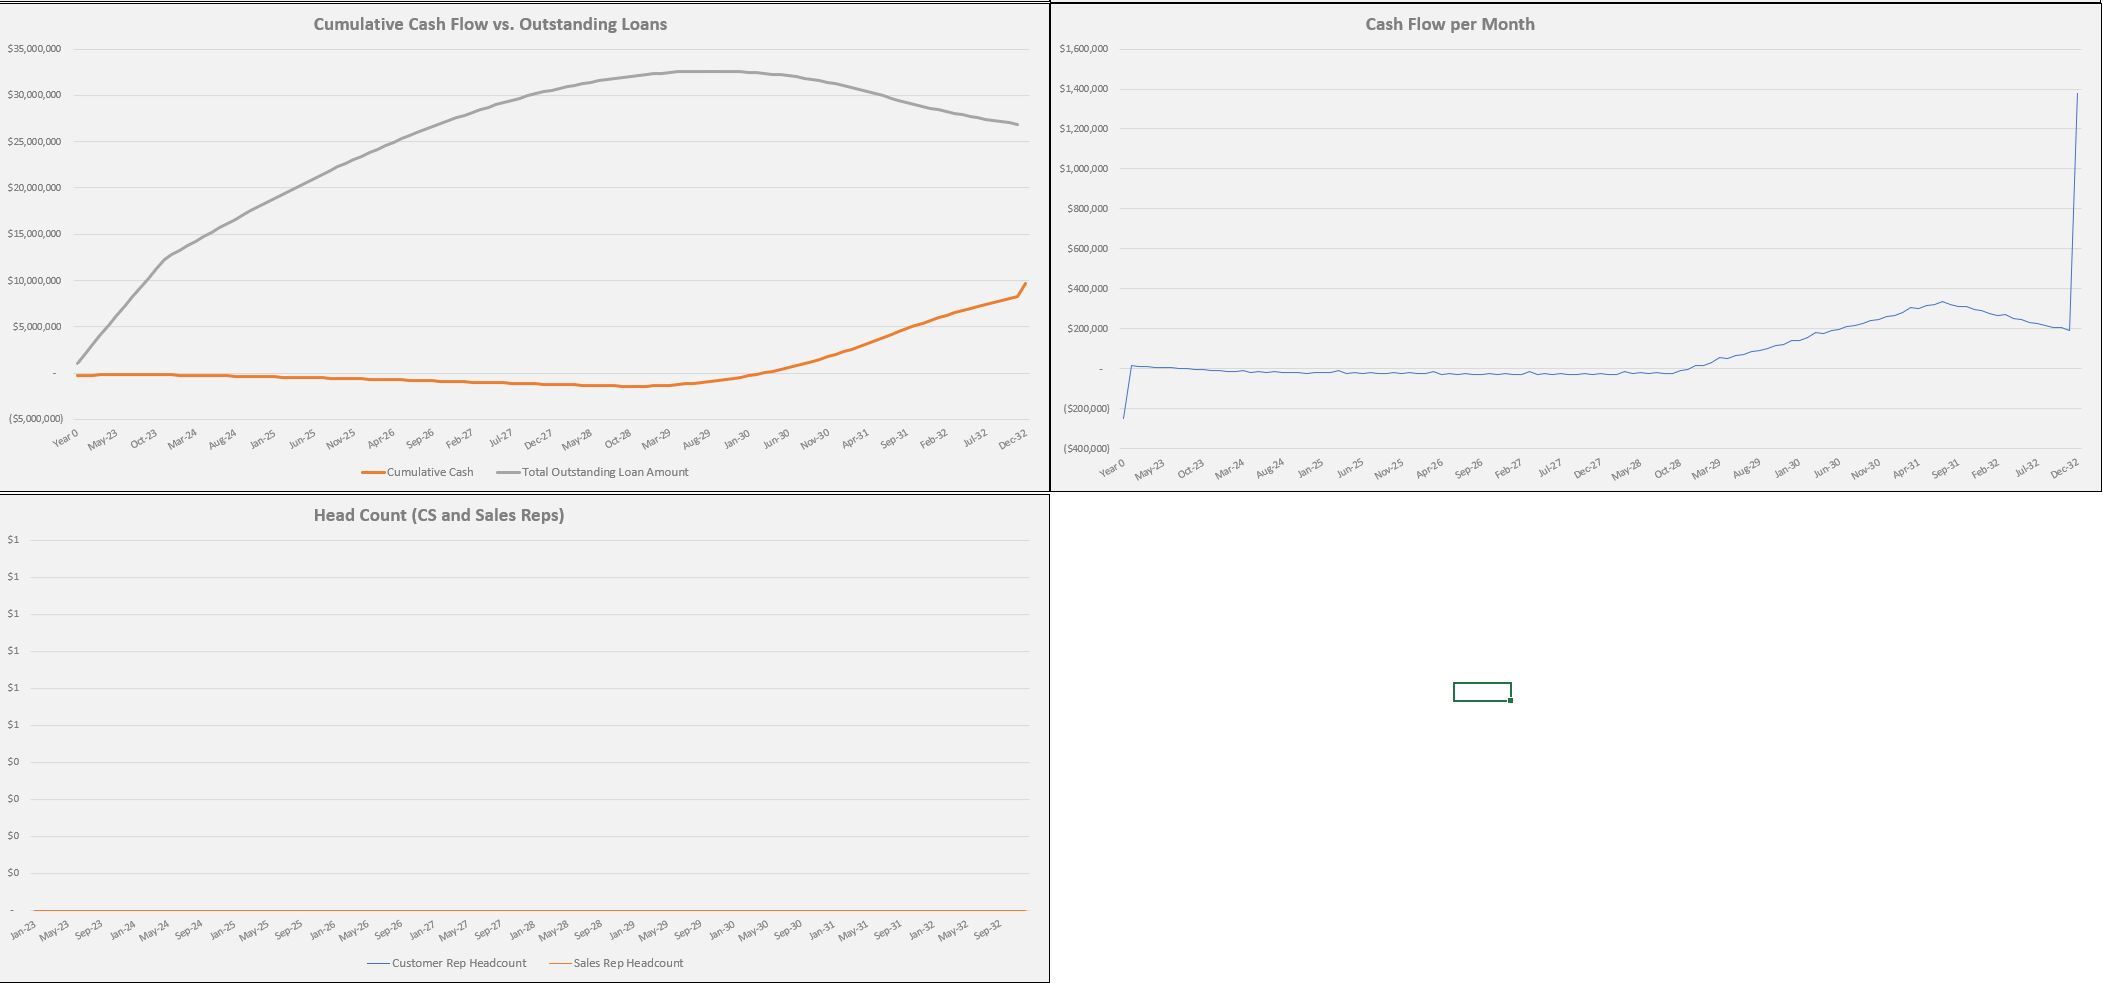
If this is a business startup that requires staff and general opex, there is a full cost schedule for S&M, G&A, and R&D as well as cost of goods sold and startup costs as well as capex. The customer service reps have two types for each loan type and scale based on a ratio against existing loan counts. Sales reps also have two types per loan type and scaled based on new loans originated per month. Both headcount types have their own configurable fully loaded salaries.
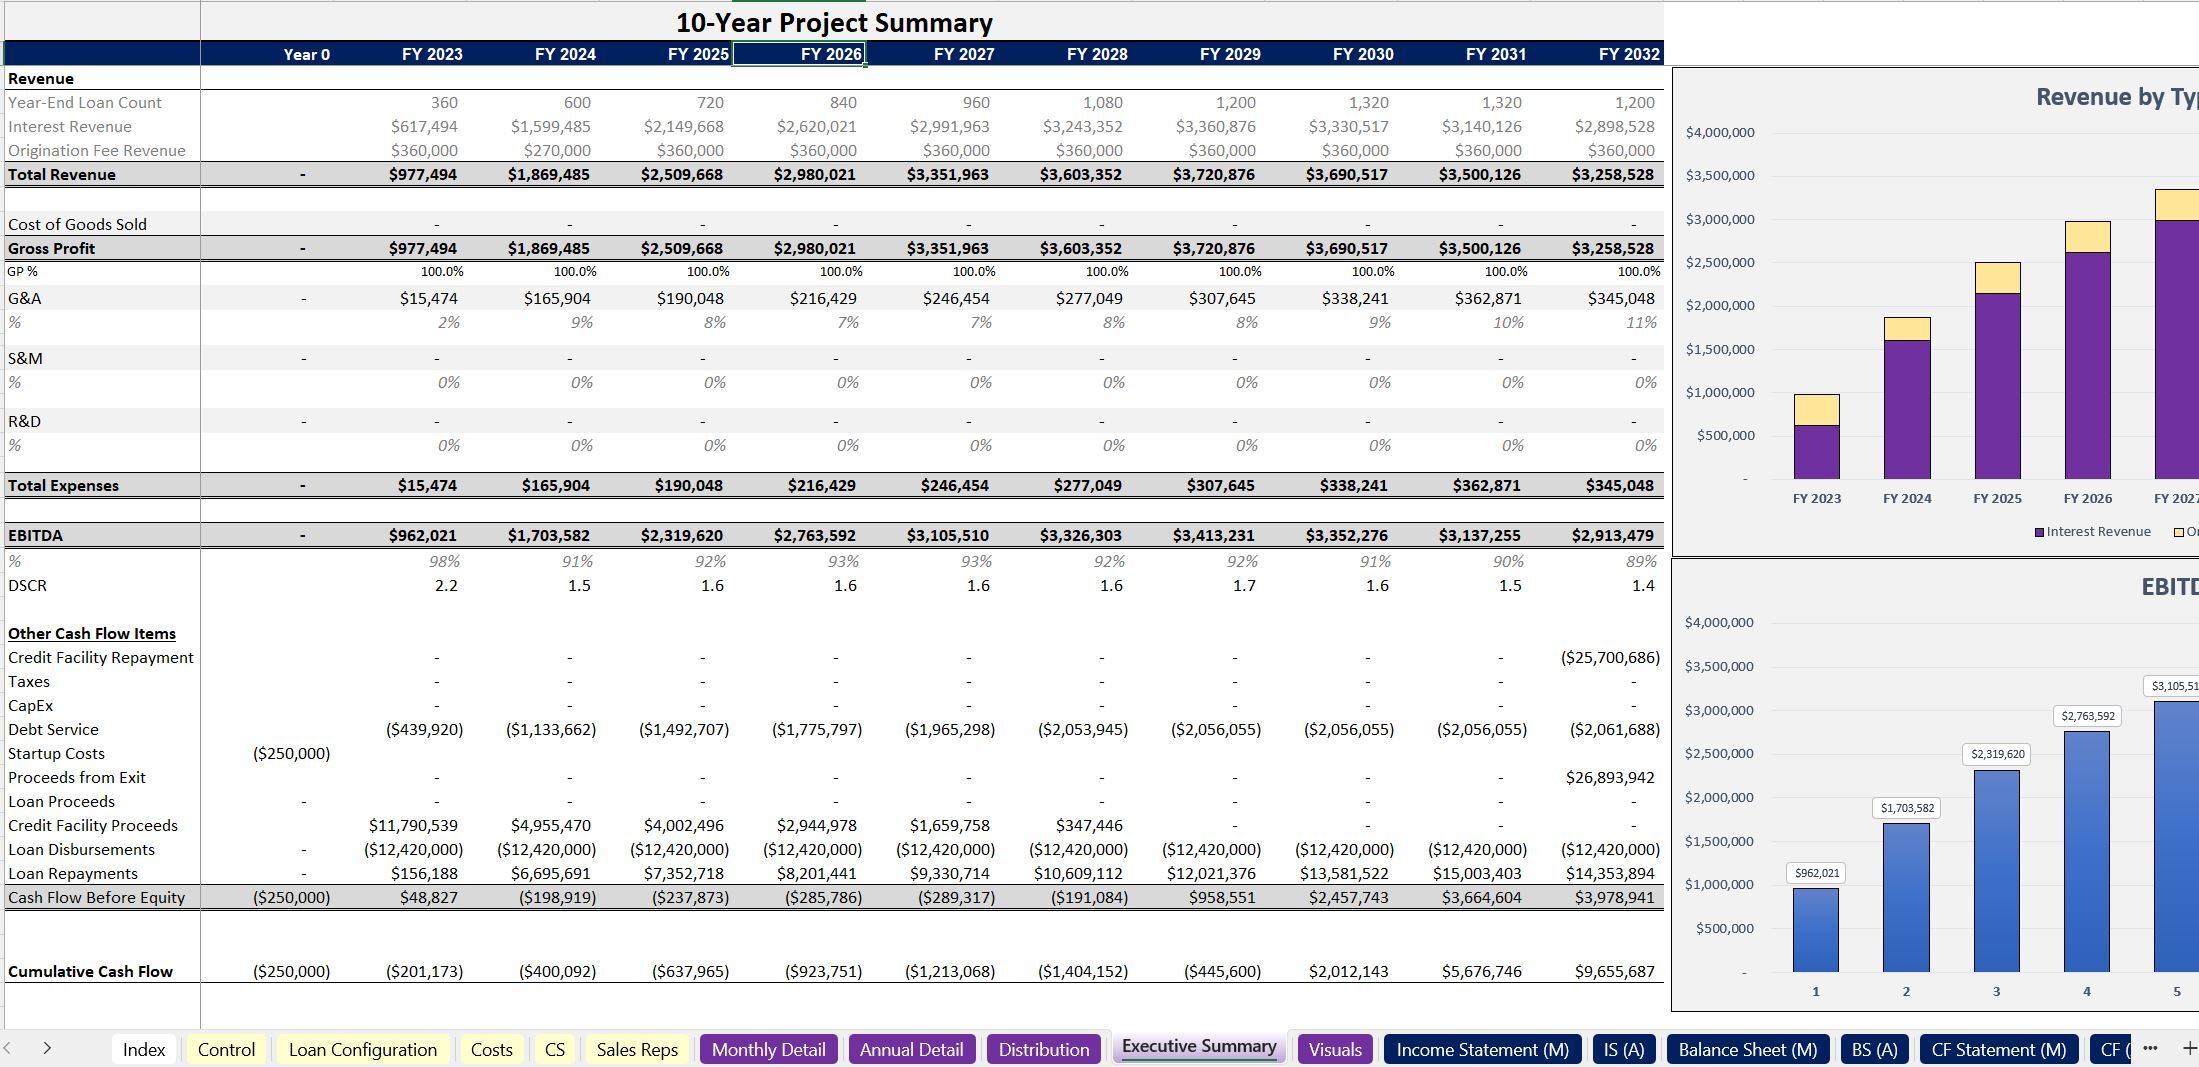
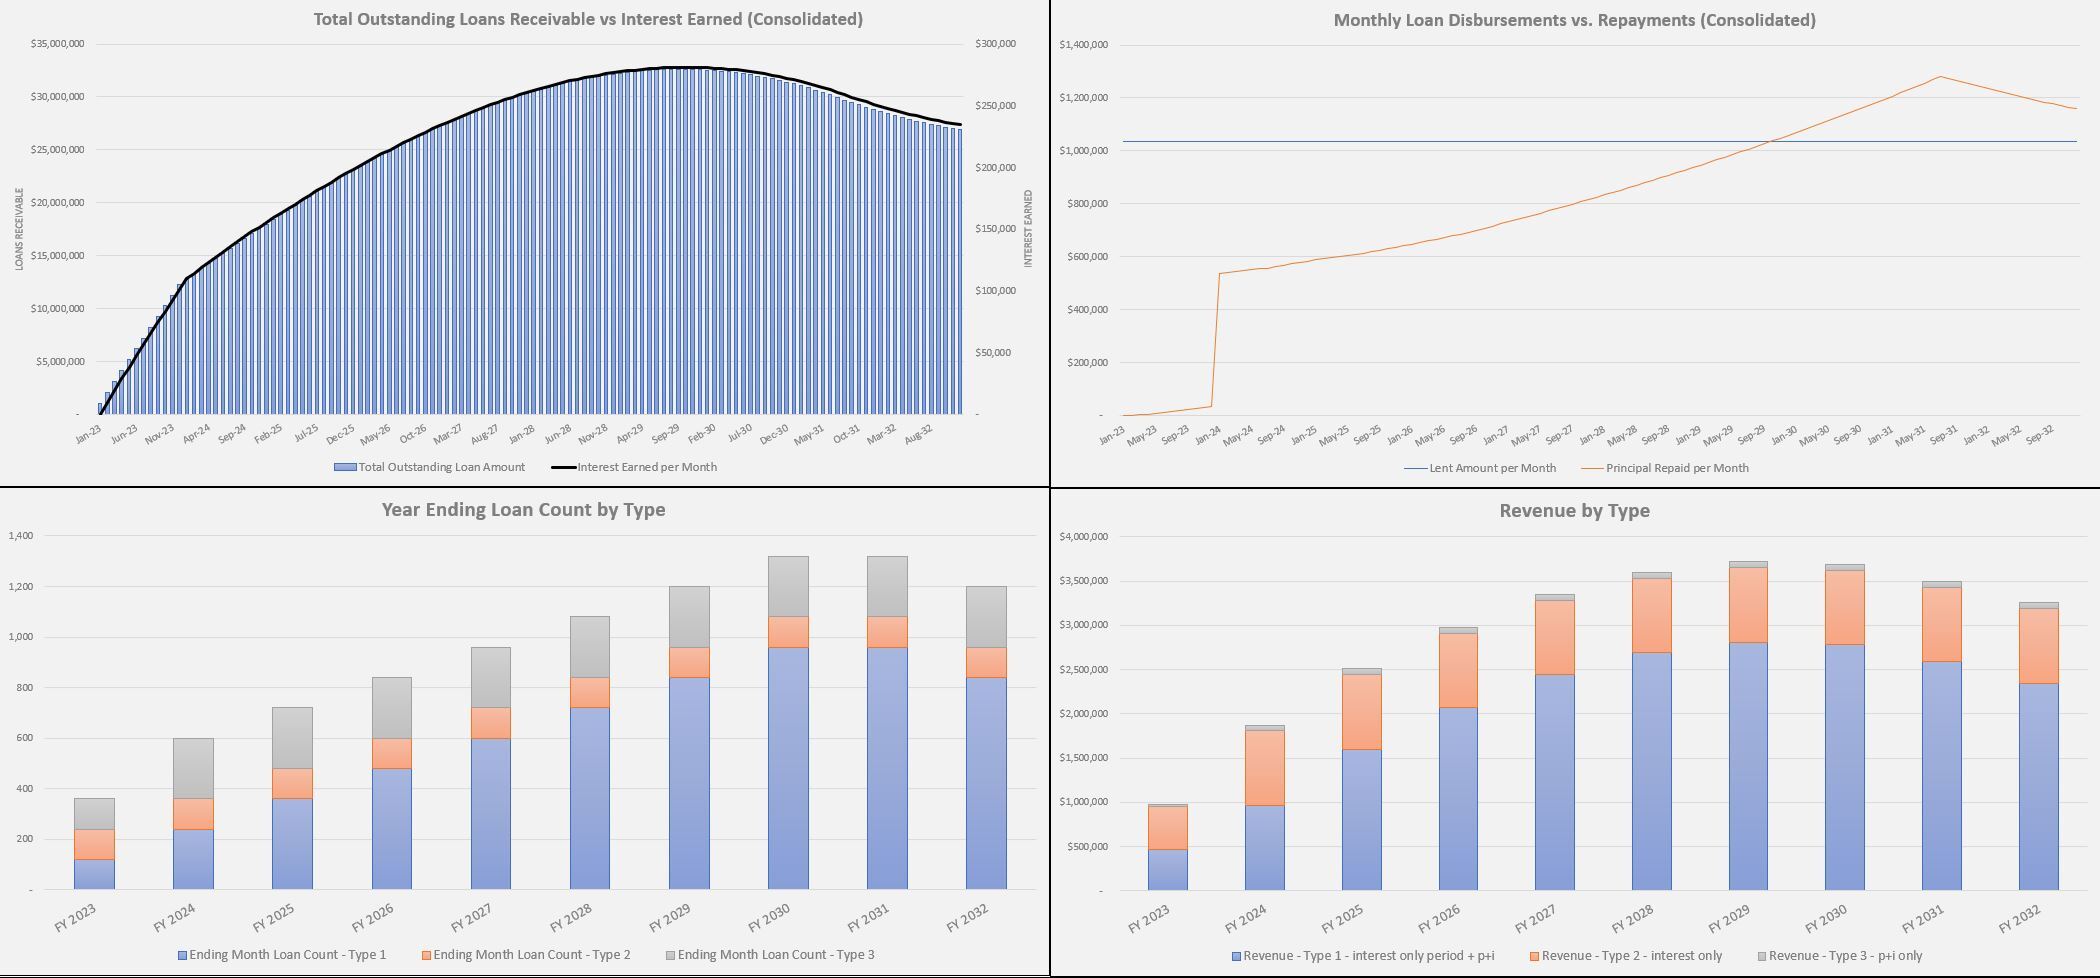
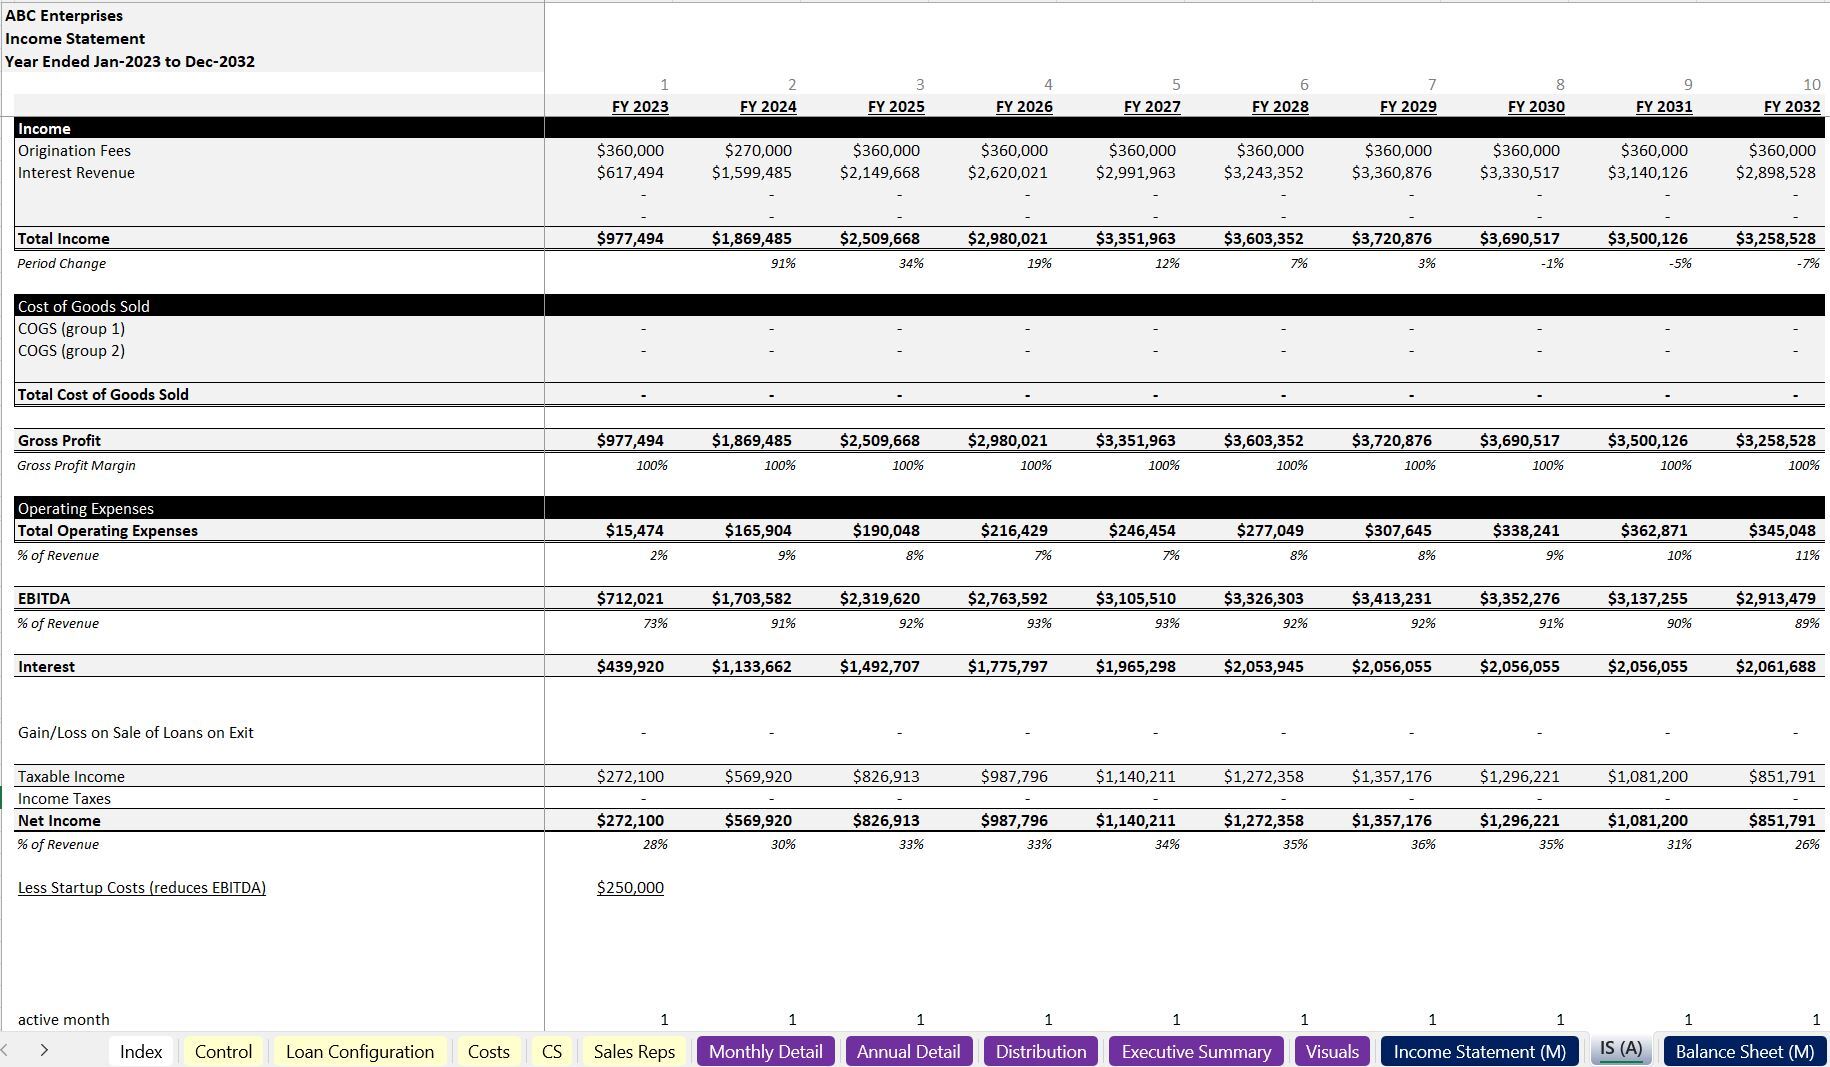
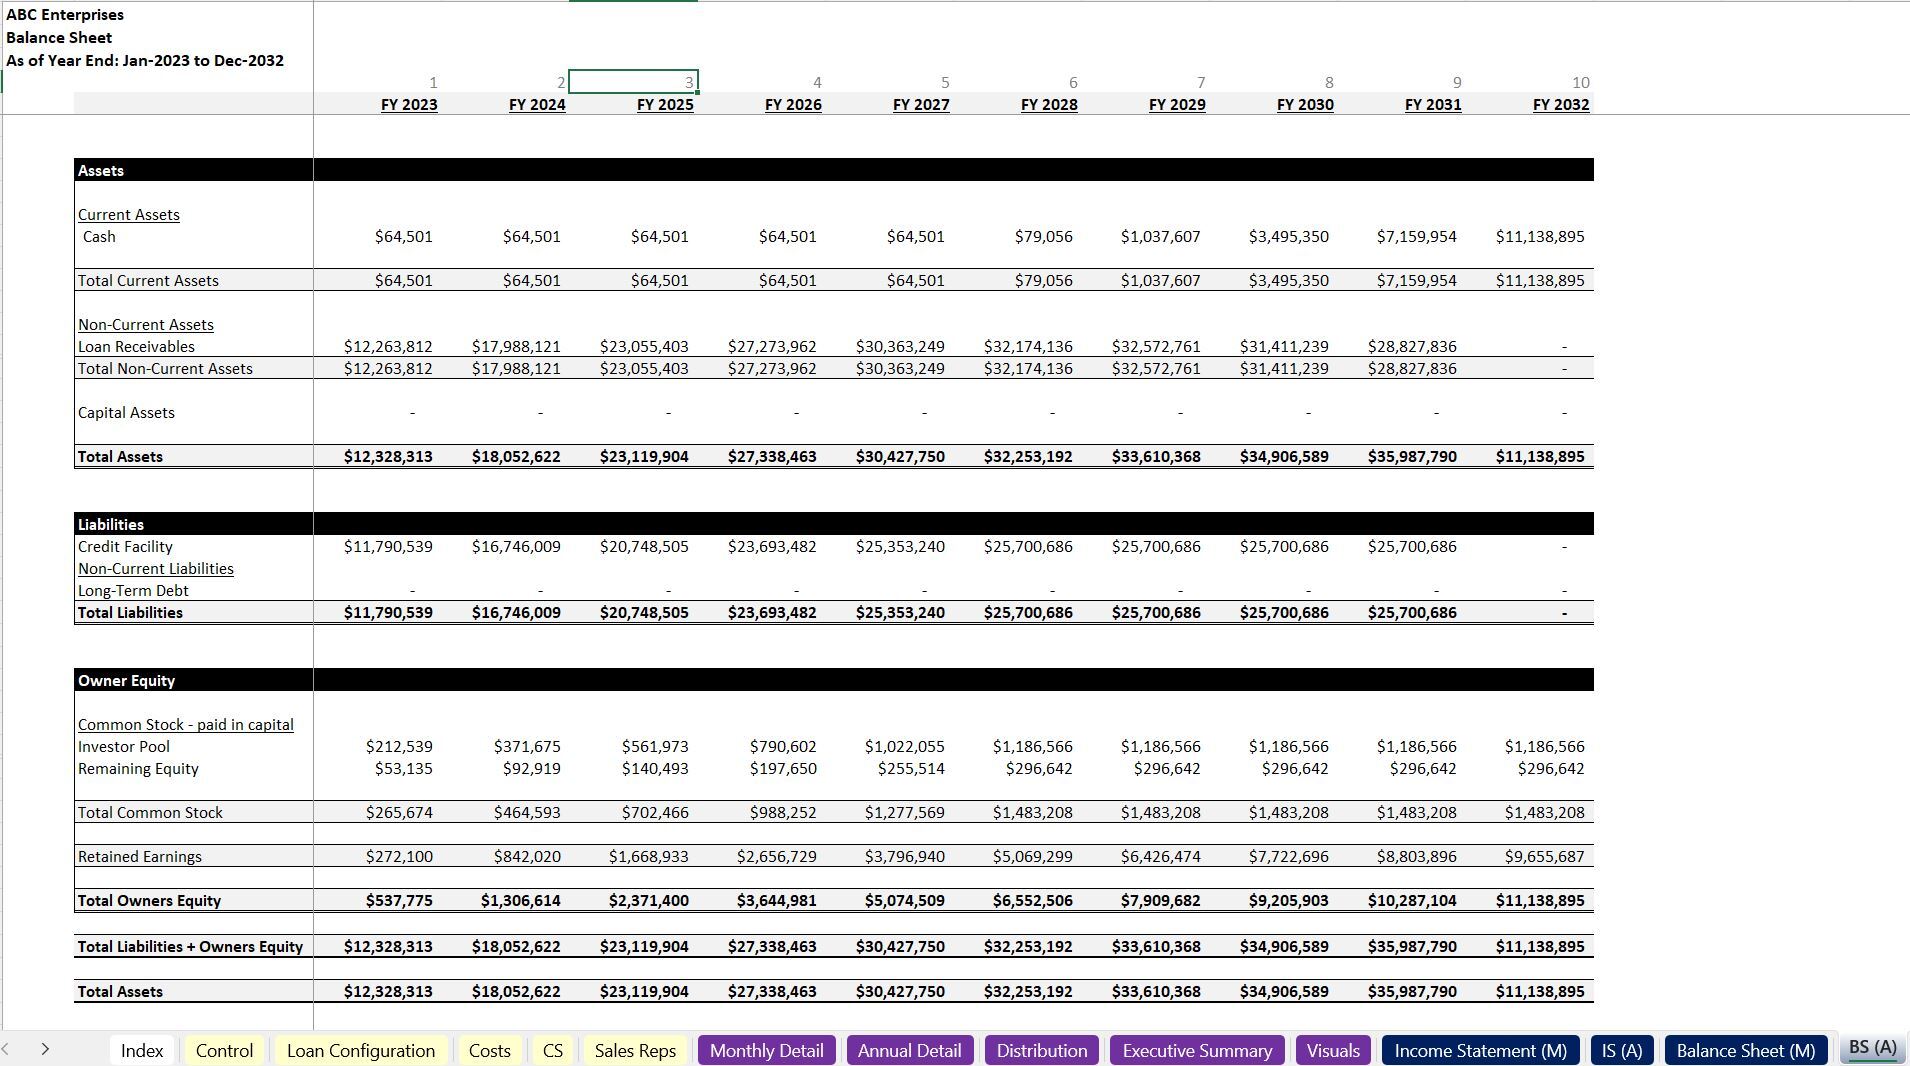
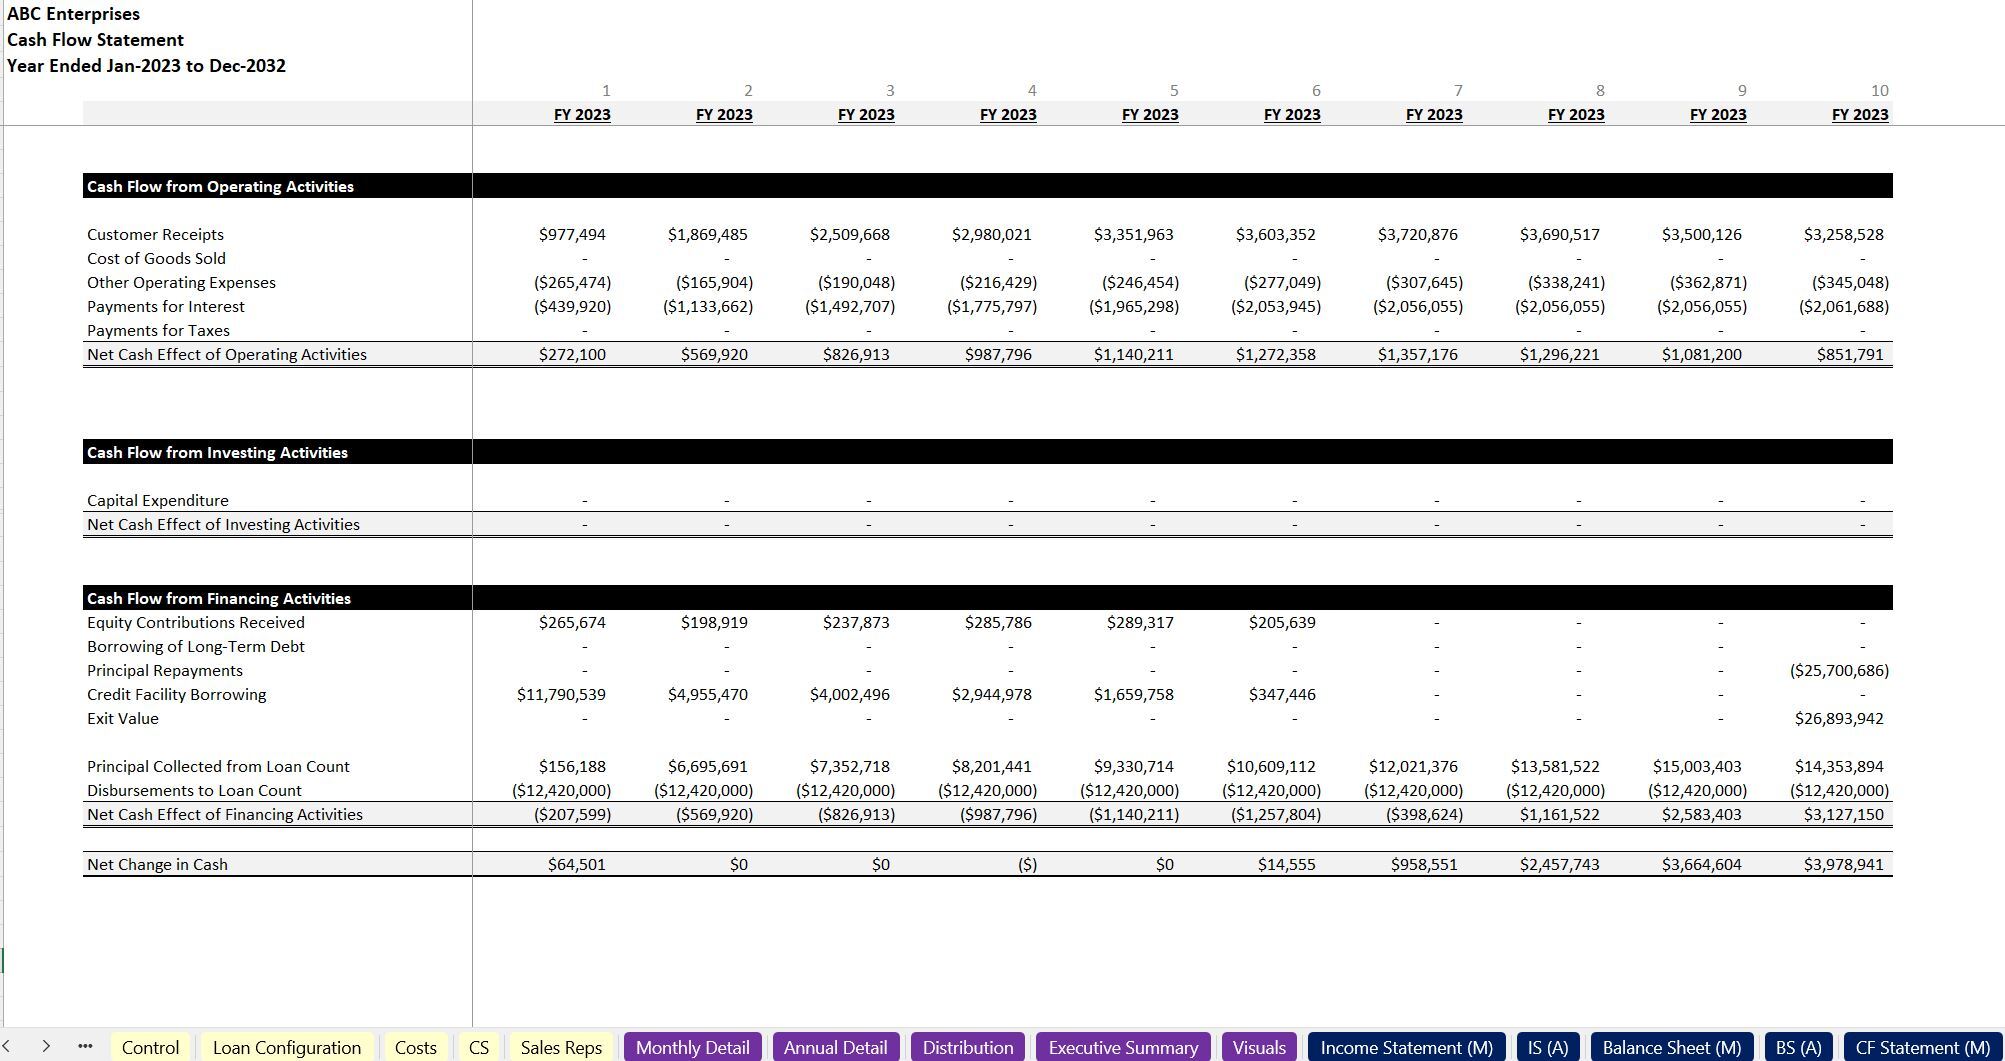
The output summaries and visuals are extensive. After all the assumptions have been populated, there will be a monthly and annual detail that populate to show the effects of all assumptions in the context of EBITDA and down to cash flow. To get even more formal, there is a 3-statement model built into this that has an Income Statement, Balance Sheet, and Cash Flow Statement (monthly and annual) to better see the financial effects of this kind of business.
An exit valuation (terminal value) is calculated based on a multiple of net assets, which means the value of total loans receivable at exit month less any debt owed less any seller fees.
An executive summary is also shown on an annual basis for high level financial analysis.
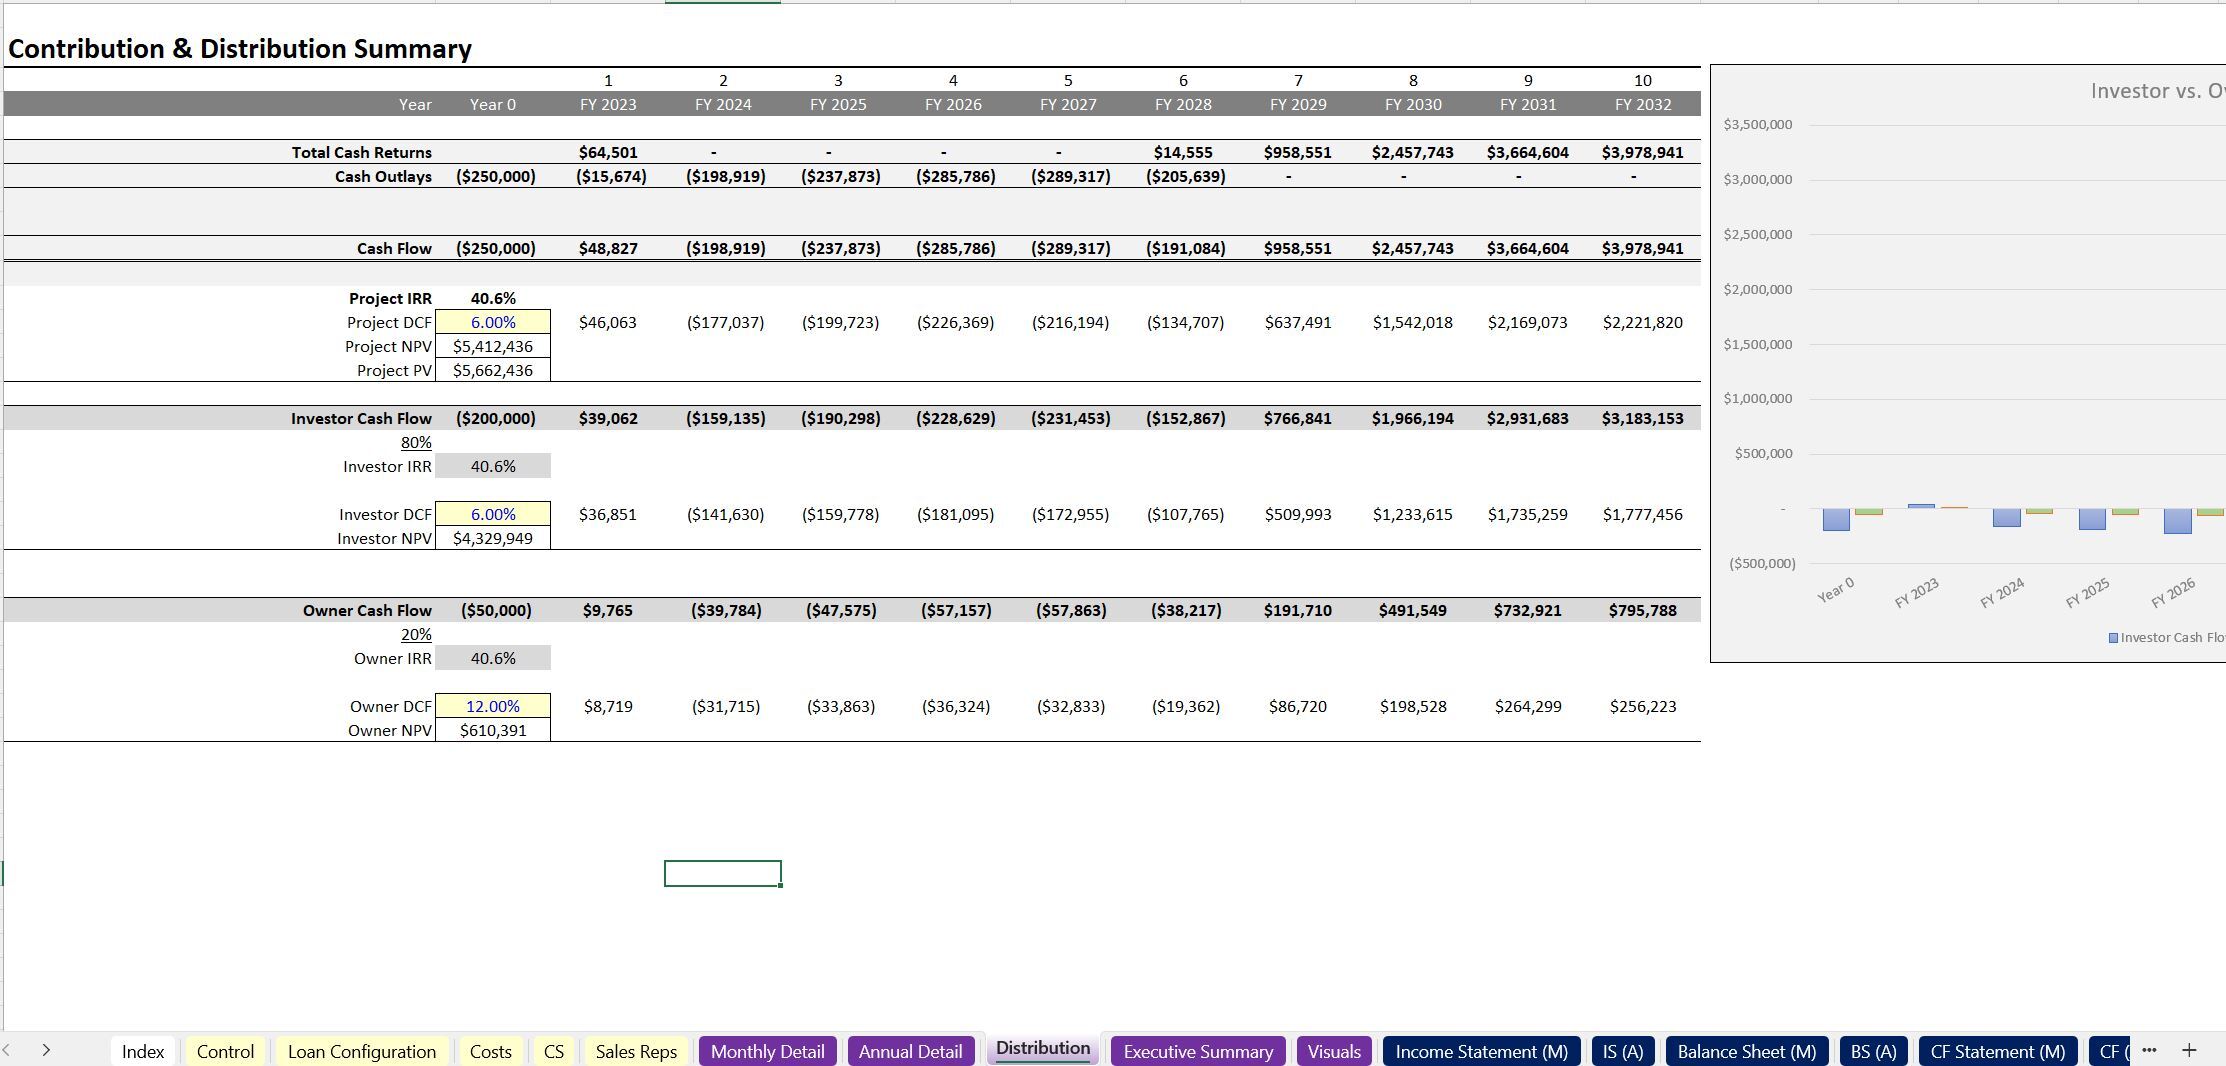
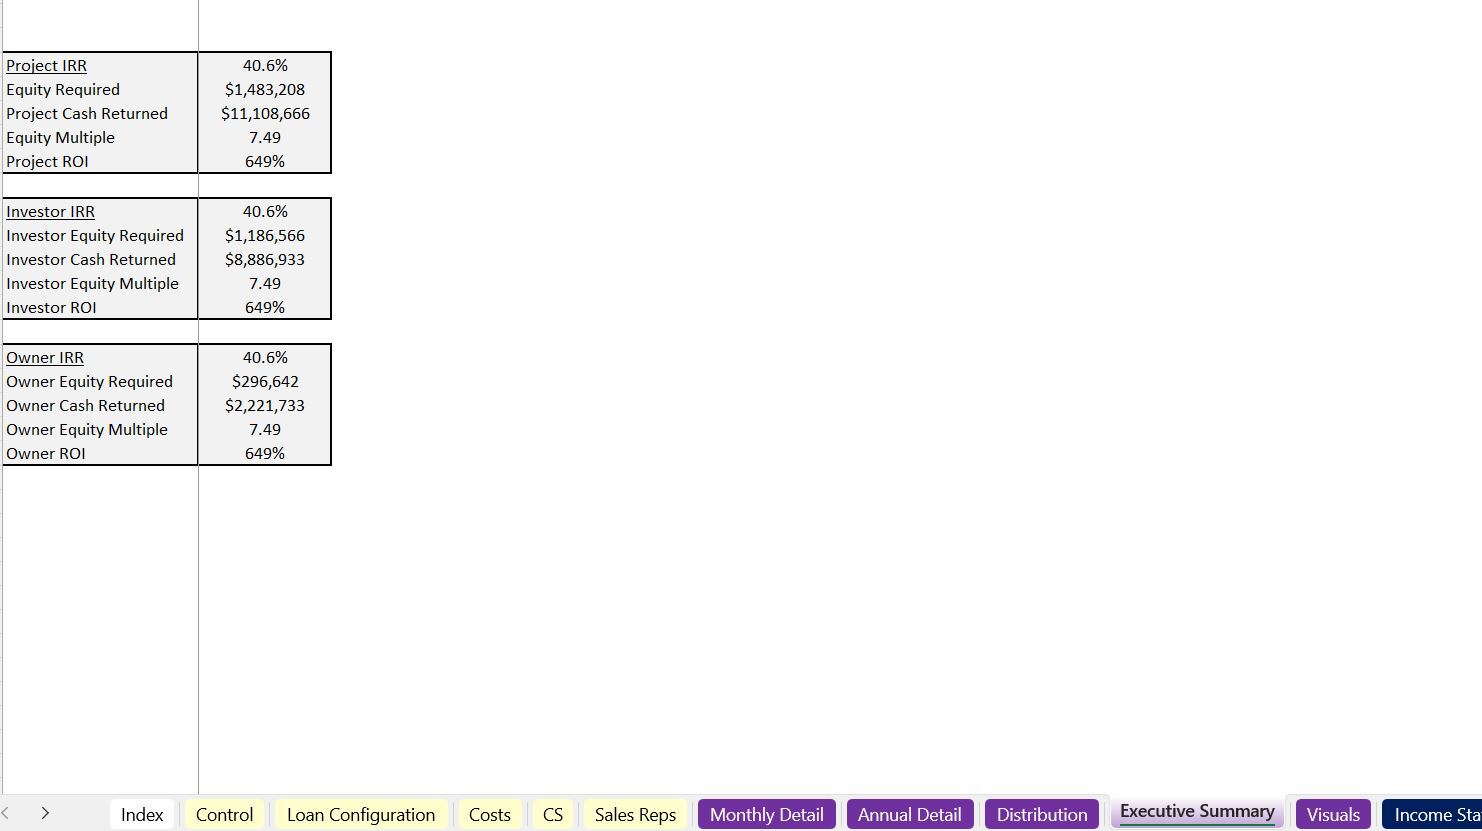
A contribution and distribution summary is shown to see the required up front equity and resulting cash out flow over time. Any positive operating income is automatically re-invested into the on-going operations (originating more loans) until the net cash flow is positive. This will be positive as soon as the net income is greater than loan repayments less loans disbursed. This summary shows the project level performance as well as the investor and owner cash flows based on percentage splits. All have a DCF analysis, IRR, and equity multiple result.
General timing assumptions, exit month, and multiple are defined globally.
This template is also included in two bundles:
- All Models Bundle: https://www.eloquens.com/tool/P8Y4TX4v/finance/financial-forecasting-models/financial-models-120-useful-and-usable-logic
- Accounting Tools: https://www.eloquens.com/tool/axKzHNRV/finance/accounting/accounting-bundle-useful-excel-templates-for-accounting-department
Recent upgrade: Added option to use a credit facility to fund a percentage of lending activity, added a percentage to define how much of the interest and fee revenue is recycled into new loans vs. used as working capital. Also, updated distribution / equity line items to work on an as needed basis rather than calculating the minimum equity required and assuming that is contributed up front in year 0.
Scaling the capital costs and general cash flow with various loan logic assumptions across time gets complicated really fast. If you are thinking about joining a p2p lender as a lending participate or starting and operating a lending business, this financial model will give you the most granular and accurate financial forecast based on up to 3 loan configurations that can be scaled to any loan count over time.
The first loan type is that of an interest-only period followed by a principal and interest repayment schedule. This on its own took 800 rows of logic on multiple tabs in order to solve. The timing of each months' new loan cohorts has to be referenced accurately i.e. how long the interest only period is and when the p+i period starts. Each has its own separate timeline and the number of months each one has been going for must be called out in order to work properly. This is all aggregated up to the primary 10-year monthly timeline.
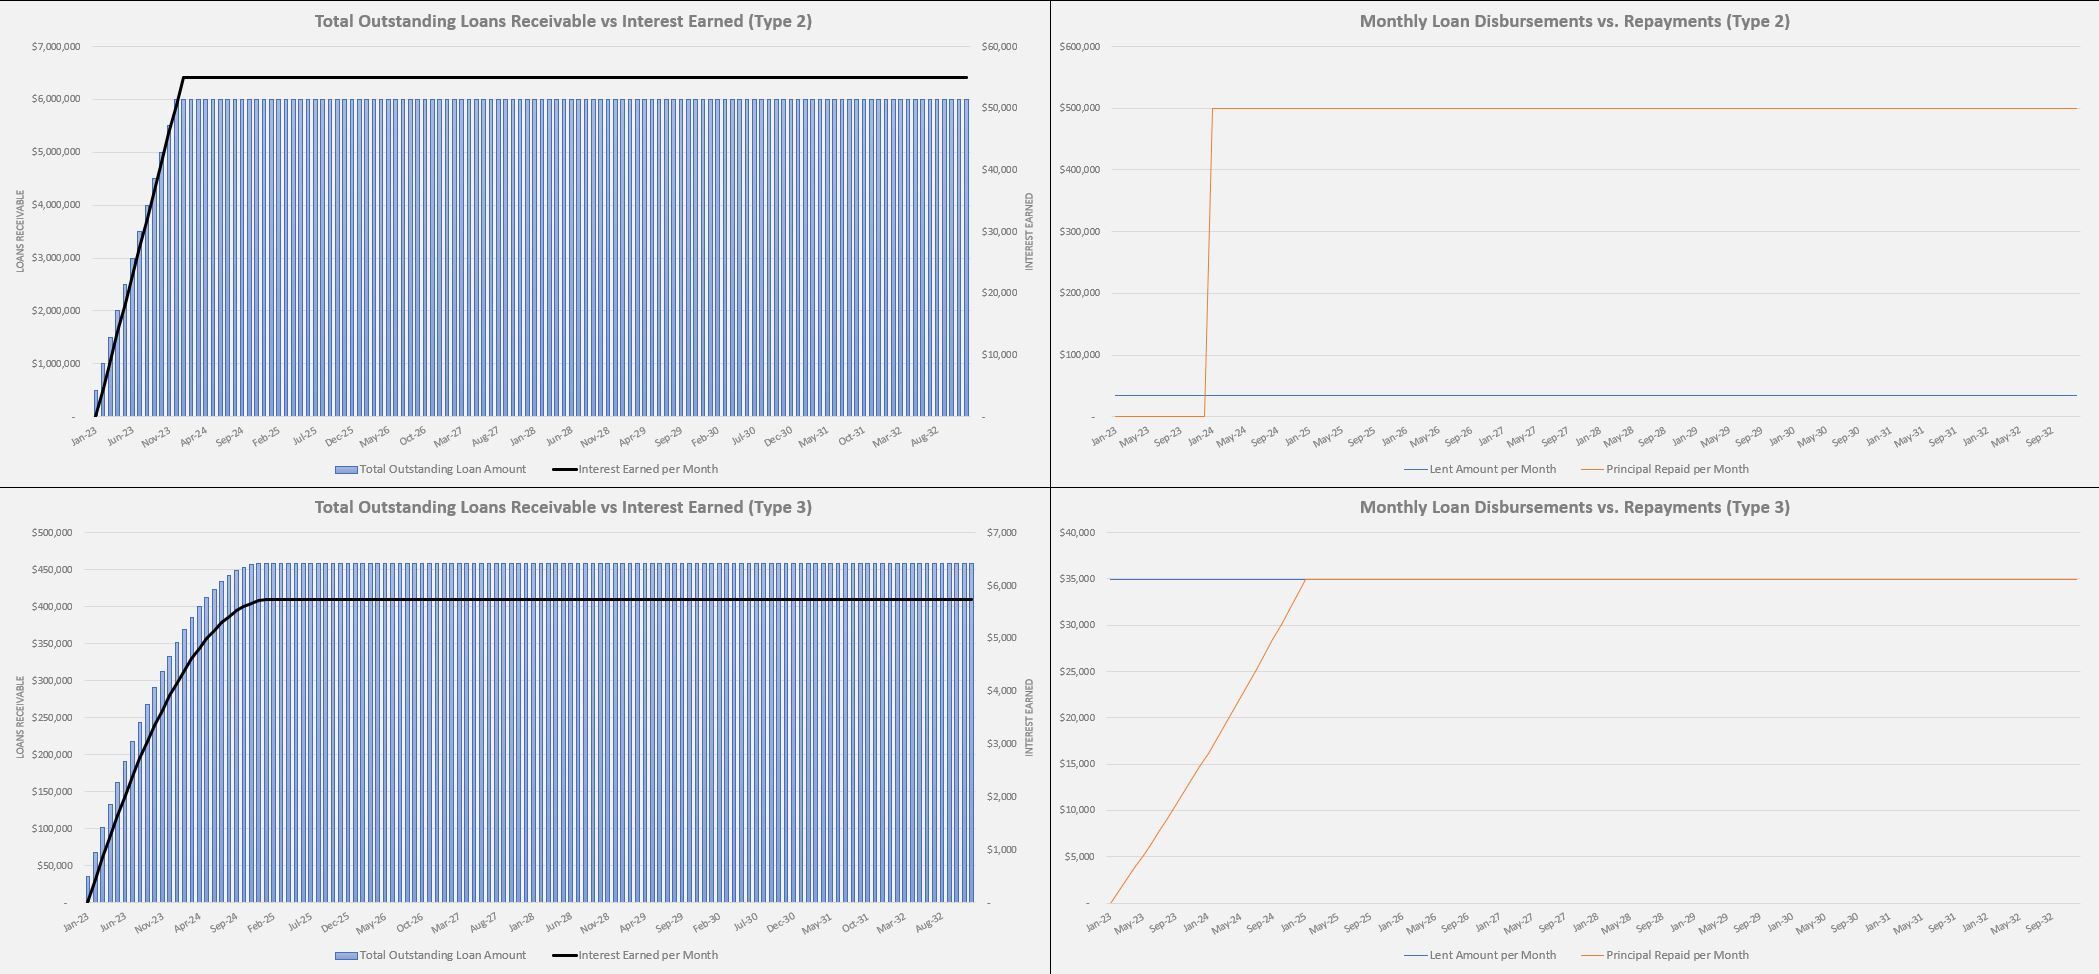
The second loan type is interest-only, which is a bit easier than type 1 above because only the total loans originated and the average loan amount each month must be tracked and interest is charged each month according to the interest only rate input for as long as the term is. The term can be any number and can change over the 10-year period.
The third loan type is principal and interest so think more like a mortgage for homes on this type.
The start month and starting loan originations are defined per each type.
The following are configurable for loan type 1 in each of the 10-years:
1. Loans added per month
2. Interest-only term (months)
3. Interest-only period interest rate
4. Loan amount
5. p+i term (years)
6. p+i interest rate
7. Origination fee percentage
A default rate is defined once and applied to all loan repayments. When you are entering the assumptions for these loan types, think of them as weighted averages of what you expect loan originations to look like over time.
Similar inputs were built for interest-only loans and principal + interest loans.
Based on those assumptions, the loan disbursements, principal repayments, origination fees, and interest revenue are all calculated per month in aggregate. It is assumed that repayments always start one month after the loans are settled. This is some of the most difficult logic to do without your standard amortization schedule. Essentially, the matrix tabs are amortization schedules, but they are done in a monthly cohort style where the timing, principal/interest payments, and repayments can all be calculated across the same timeline correctly.
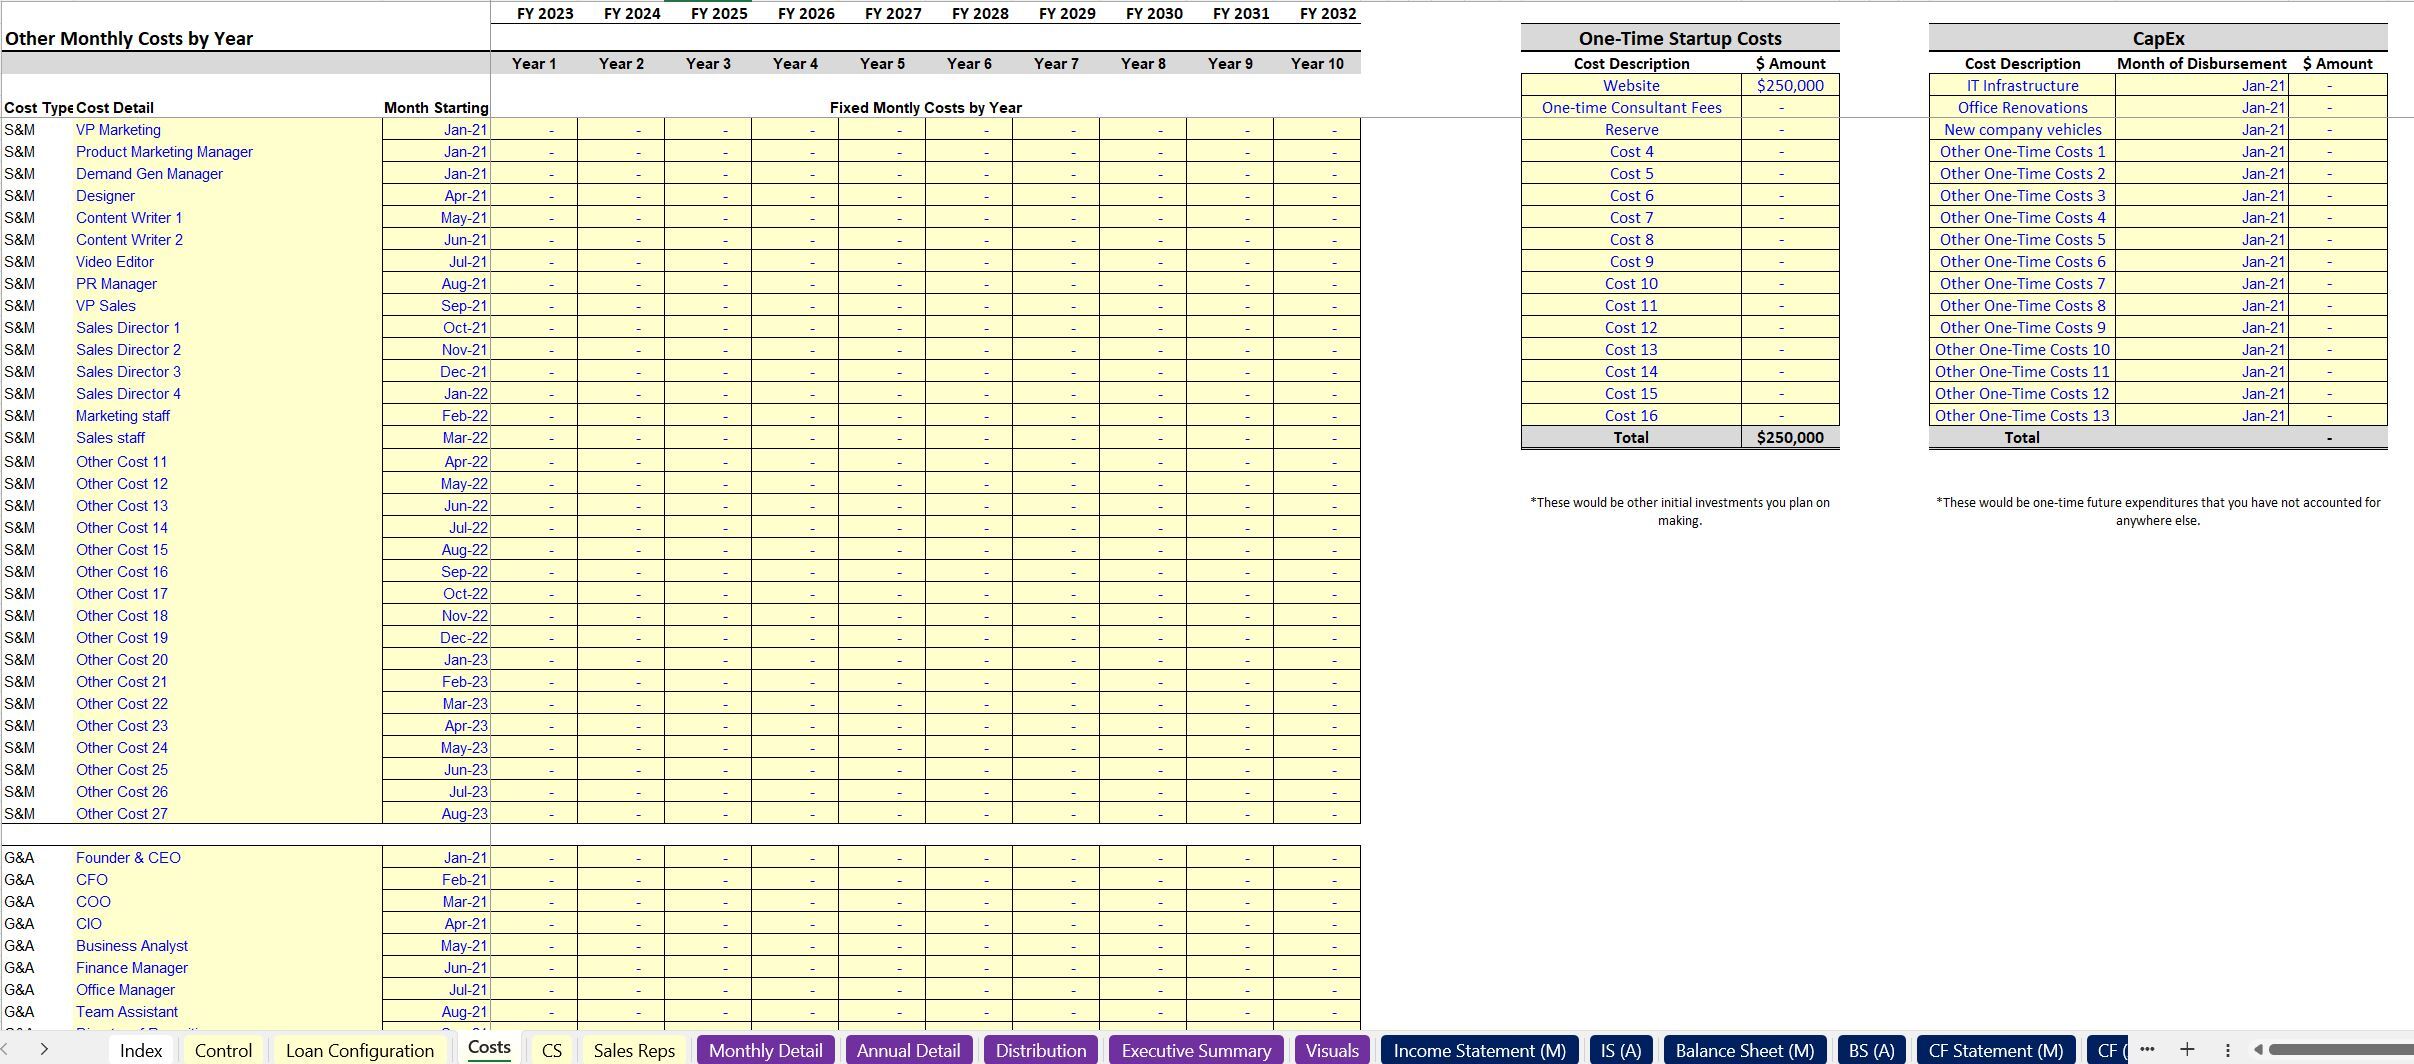
If this is a business startup that requires staff and general opex, there is a full cost schedule for S&M, G&A, and R&D as well as cost of goods sold and startup costs as well as capex. The customer service reps have two types for each loan type and scale based on a ratio against existing loan counts. Sales reps also have two types per loan type and scaled based on new loans originated per month. Both headcount types have their own configurable fully loaded salaries.
The output summaries and visuals are extensive. After all the assumptions have been populated, there will be a monthly and annual detail that populate to show the effects of all assumptions in the context of EBITDA and down to cash flow. To get even more formal, there is a 3-statement model built into this that has an Income Statement, Balance Sheet, and Cash Flow Statement (monthly and annual) to better see the financial effects of this kind of business.
An exit valuation (terminal value) is calculated based on a multiple of net assets, which means the value of total loans receivable at exit month less any debt owed less any seller fees.
An executive summary is also shown on an annual basis for high level financial analysis.
A contribution and distribution summary is shown to see the required up front equity and resulting cash out flow over time. Any positive operating income is automatically re-invested into the on-going operations (originating more loans) until the net cash flow is positive. This will be positive as soon as the net income is greater than loan repayments less loans disbursed. This summary shows the project level performance as well as the investor and owner cash flows based on percentage splits. All have a DCF analysis, IRR, and equity multiple result.
General timing assumptions, exit month, and multiple are defined globally.
This template is also included in two bundles:
- All Models Bundle: https://www.eloquens.com/tool/P8Y4TX4v/finance/financial-forecasting-models/financial-models-120-useful-and-usable-logic
- Accounting Tools: https://www.eloquens.com/tool/axKzHNRV/finance/accounting/accounting-bundle-useful-excel-templates-for-accounting-department
This Best Practice includes
1 Excel model and 1 Tutorial Video
Further information
Build a 10-year financial forecast for a lending business based on entering key assumptions.
Any situation that involves lending money out over time in return for interest and principal repayments.
If the loan type doesn't match any of the three types defined.
