
Originally published: 05/05/2021 08:49
Last version published: 02/01/2024 09:49
Publication number: ELQ-27565-2
View all versions & Certificate
Last version published: 02/01/2024 09:49
Publication number: ELQ-27565-2
View all versions & Certificate

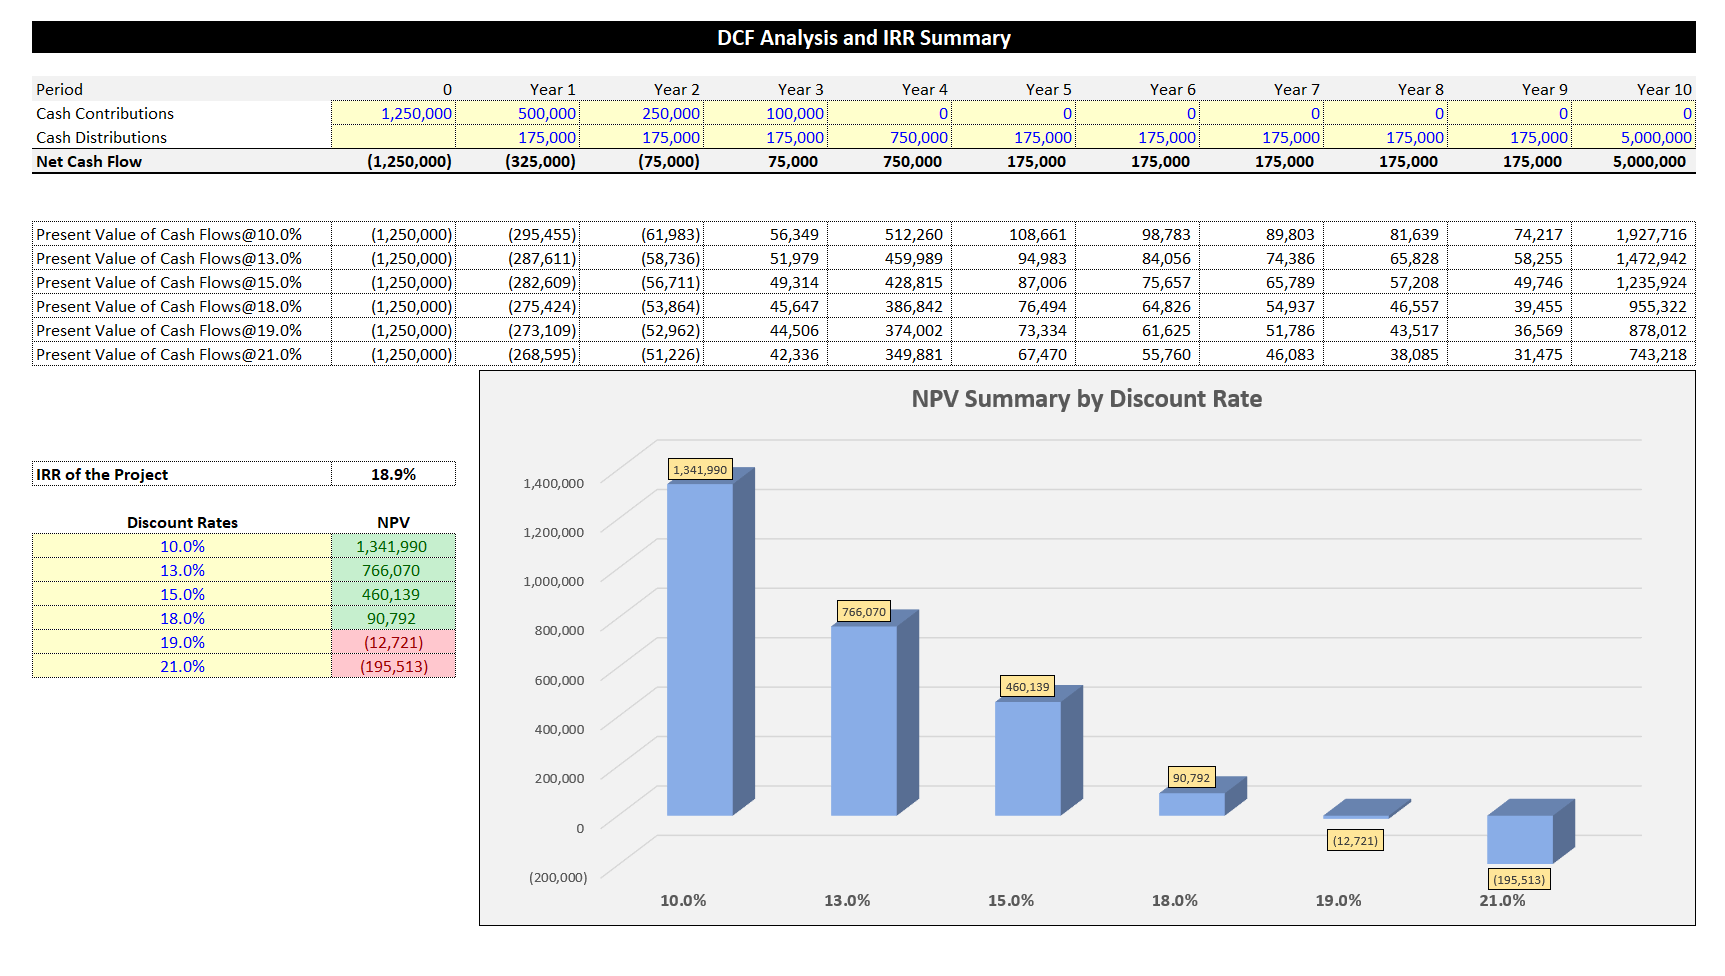
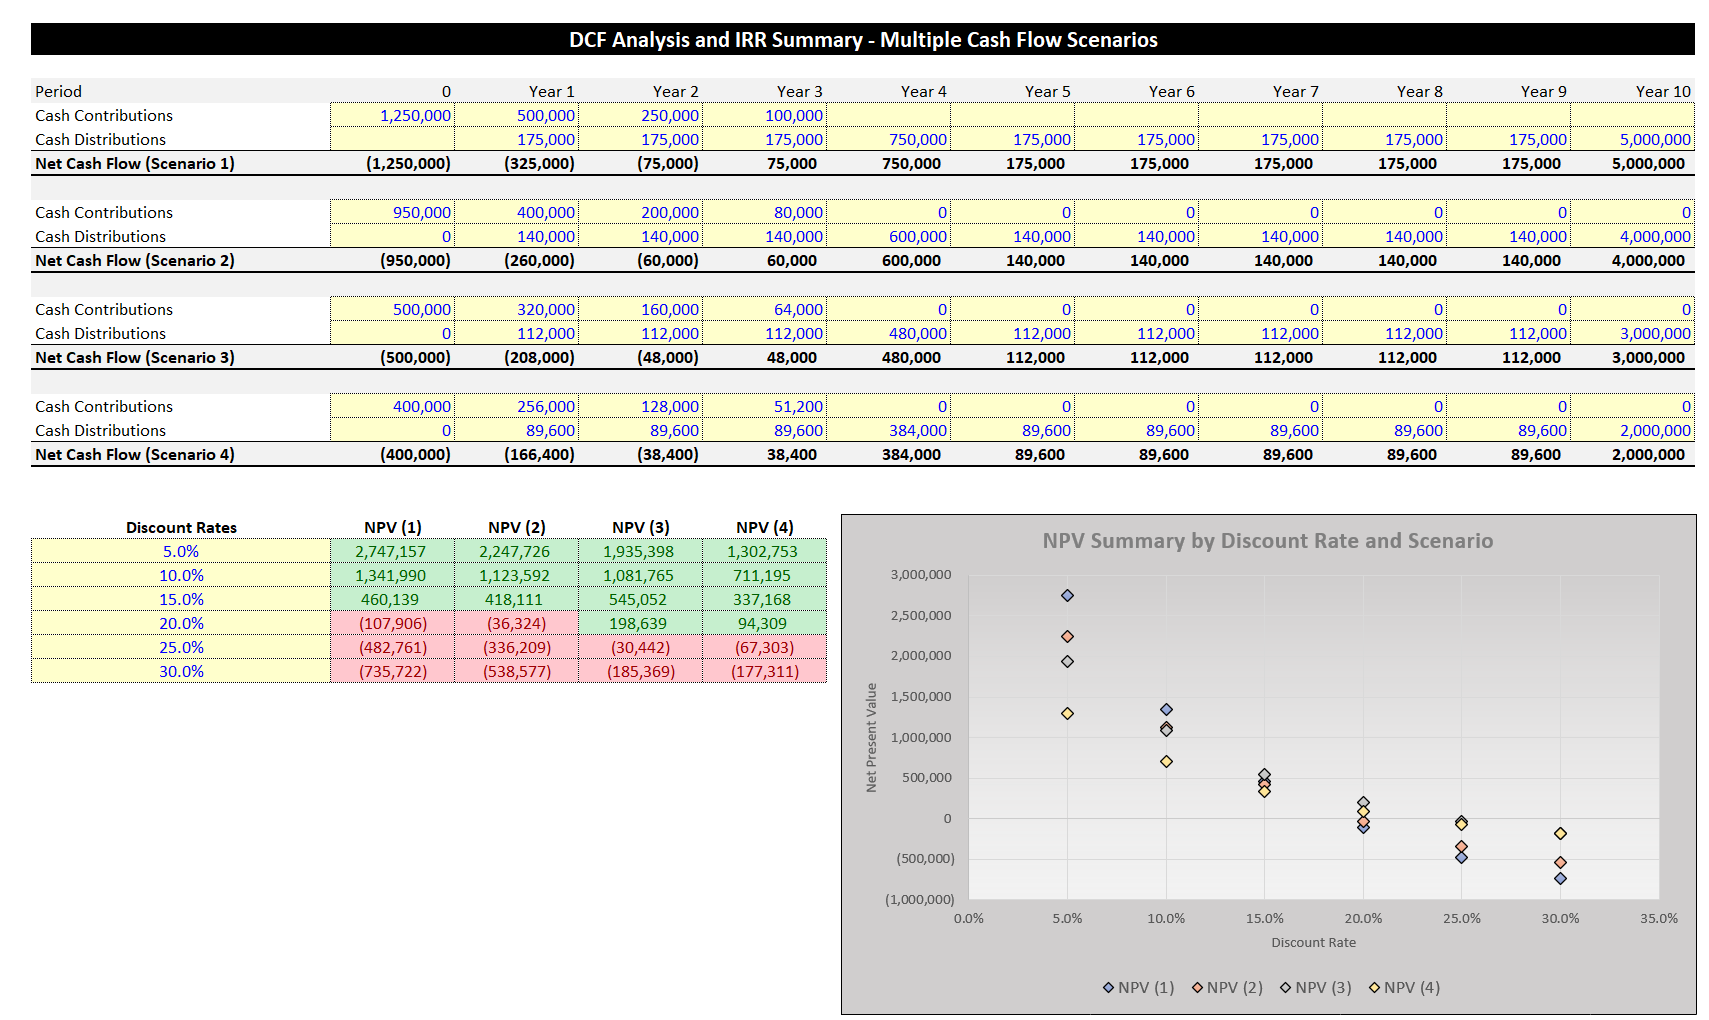
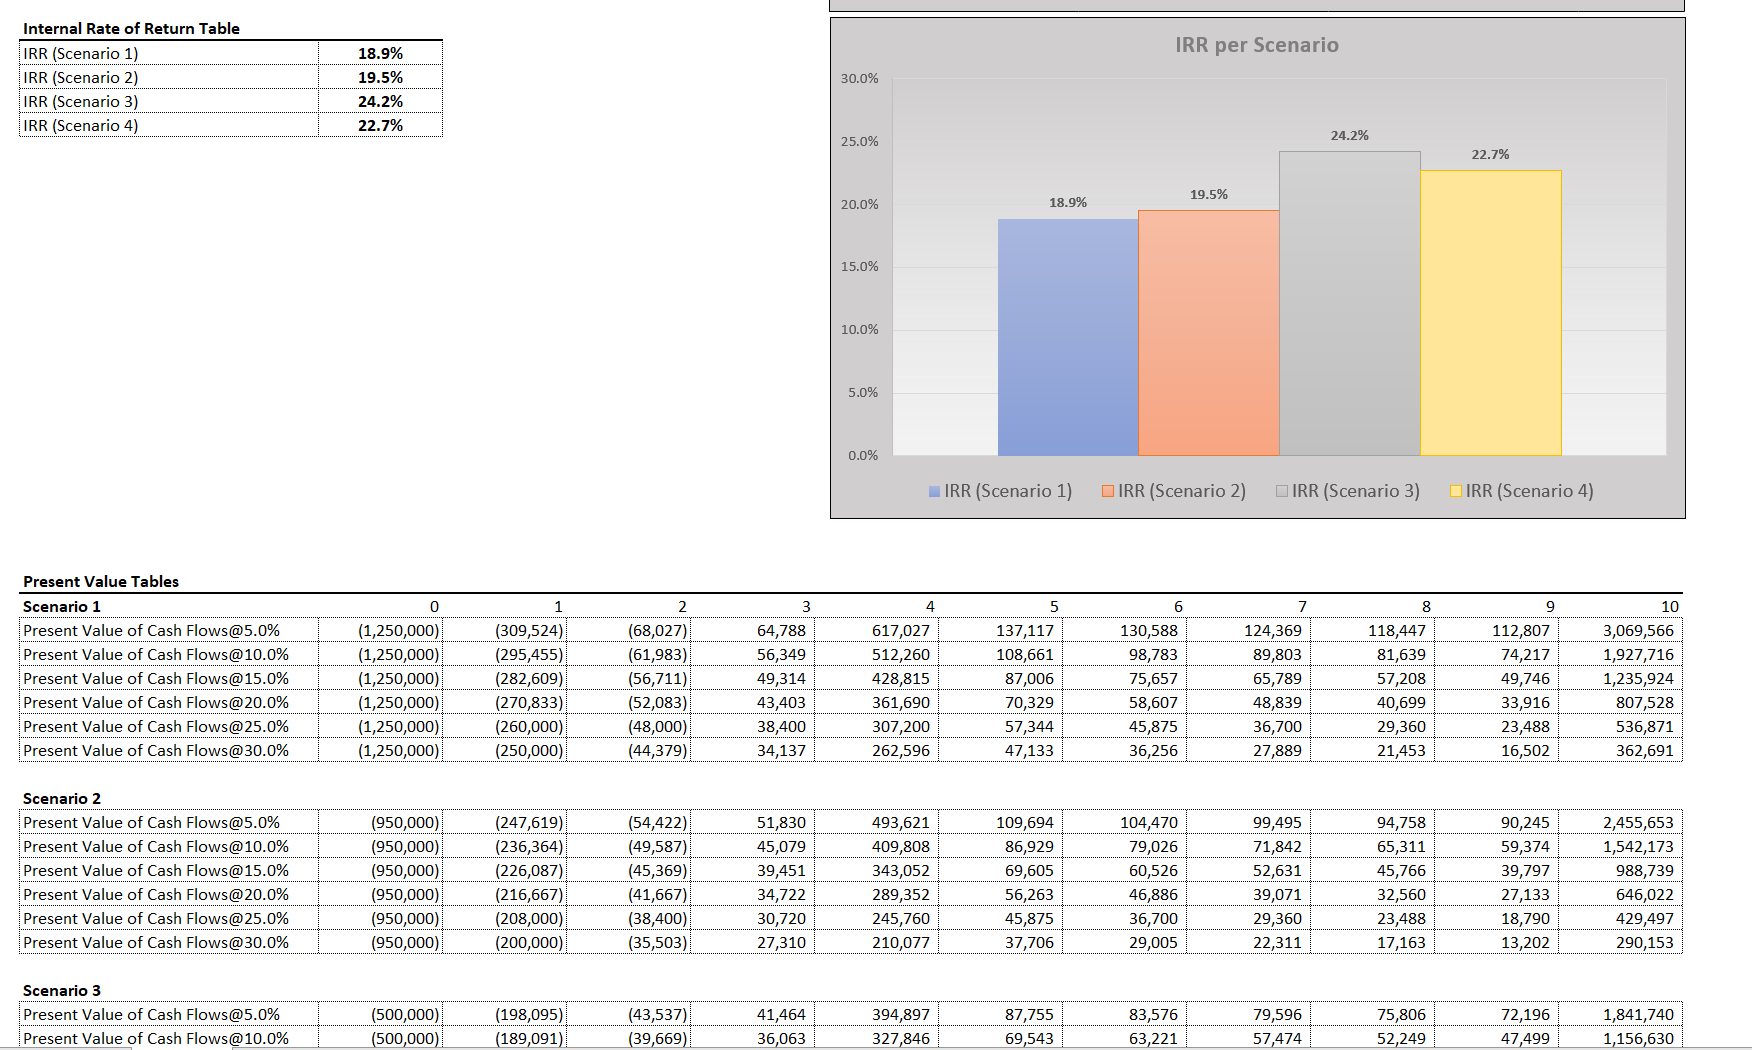
10-Year DCF Analysis with Robust Sensitivity Tables and IRR
Input expected cash flows for up to 10 periods and up to 6 discount rates to view the resulting DCF analysis table.
Further information
Display various NPV results based on input data.
Up to 10 years of cash flow.
Cash flows greater than 10 years.
