


Originally published: 24/04/2018 12:50
Last version published: 16/10/2018 09:19
Publication number: ELQ-41939-2
View all versions & Certificate
Last version published: 16/10/2018 09:19
Publication number: ELQ-41939-2
View all versions & Certificate

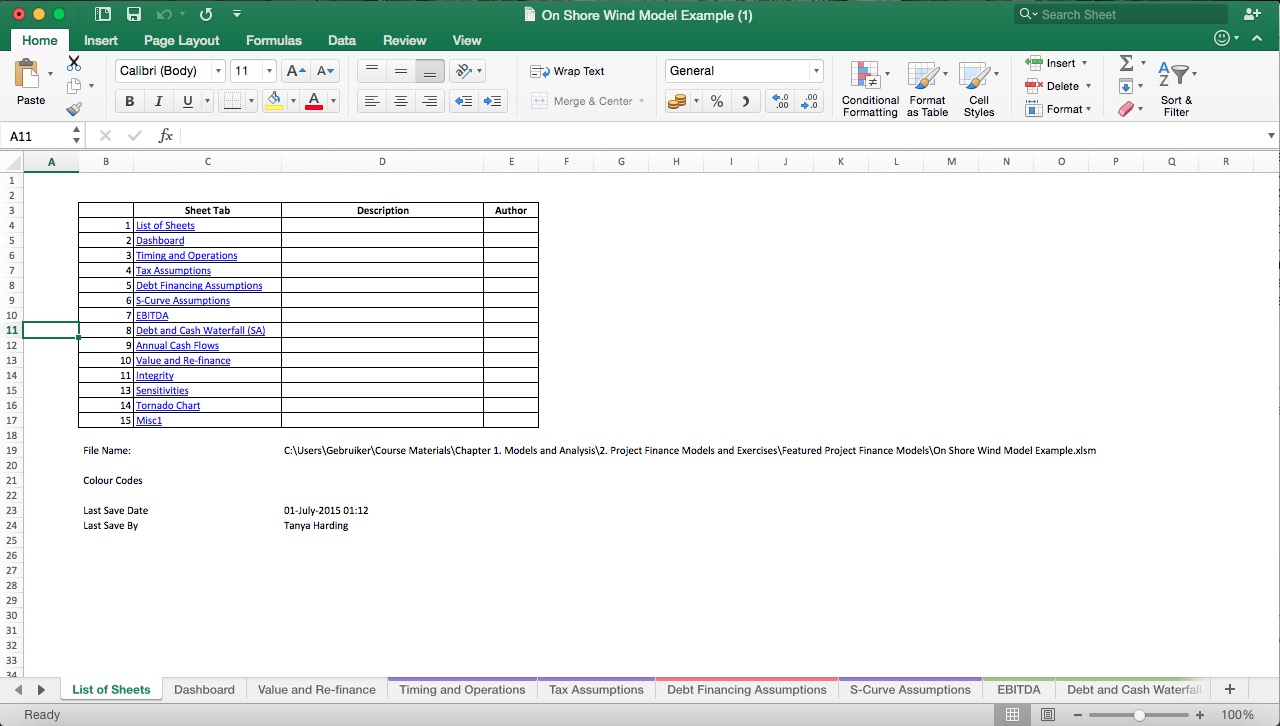
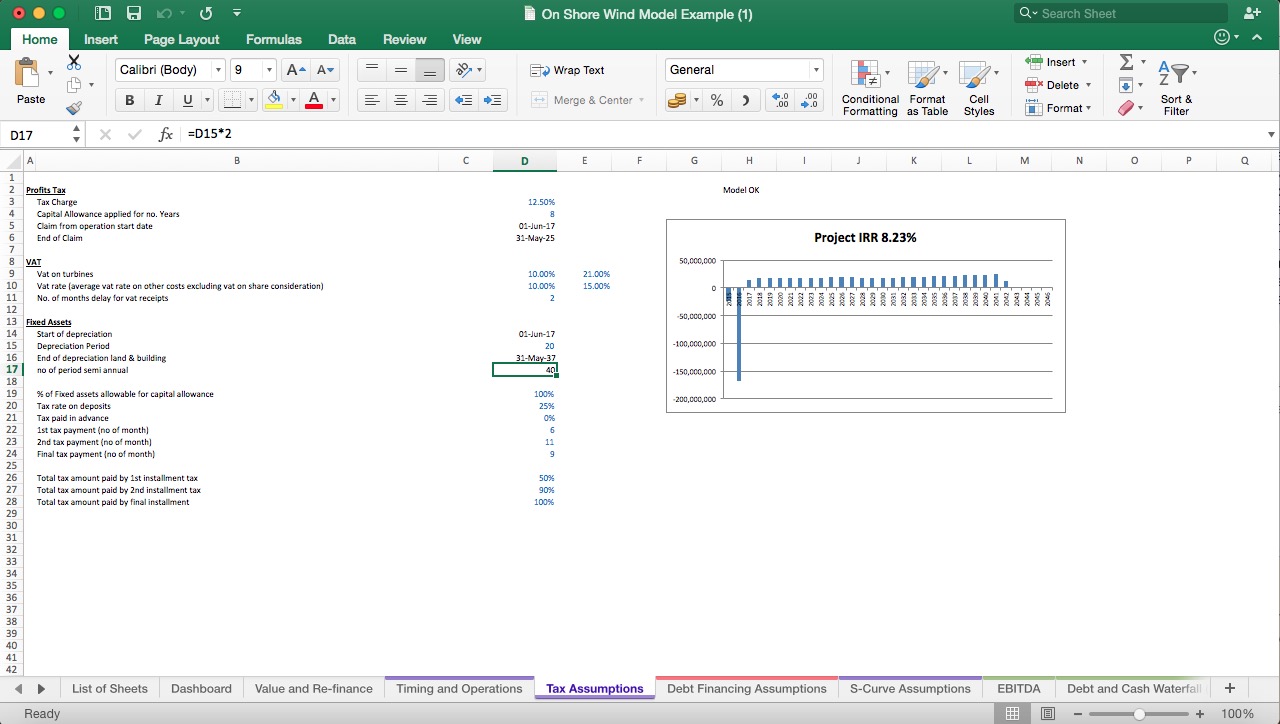
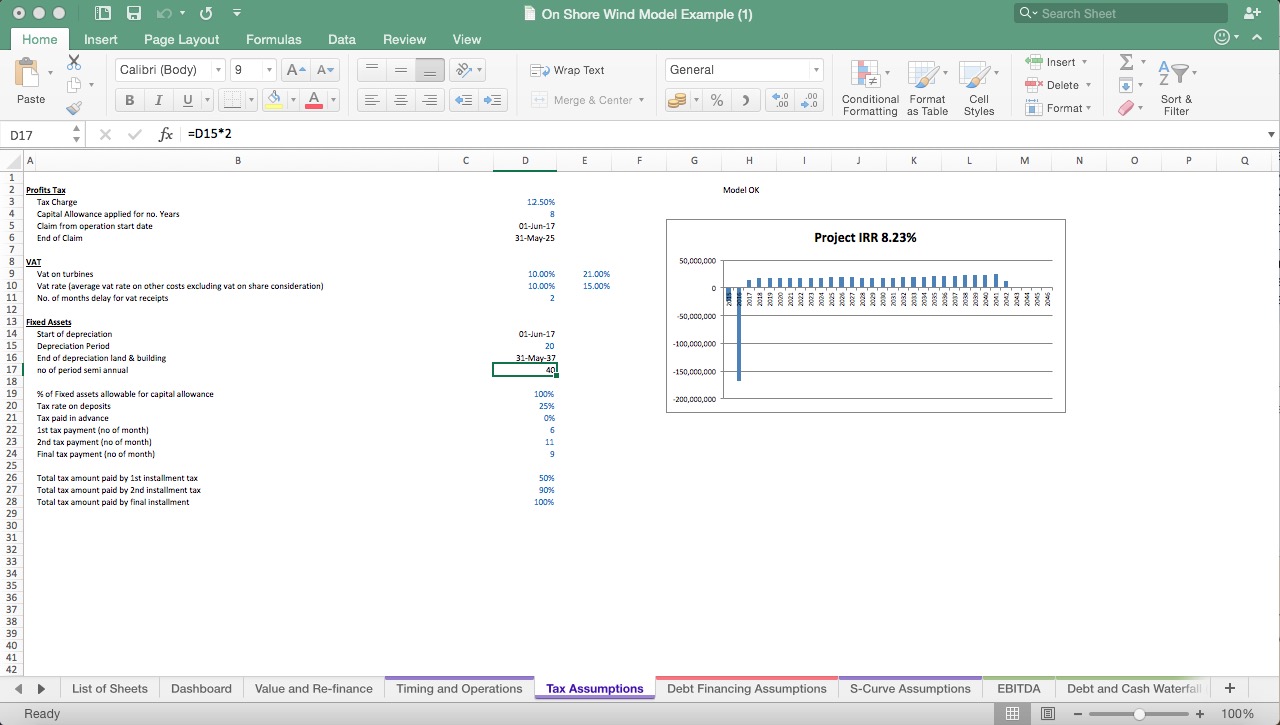
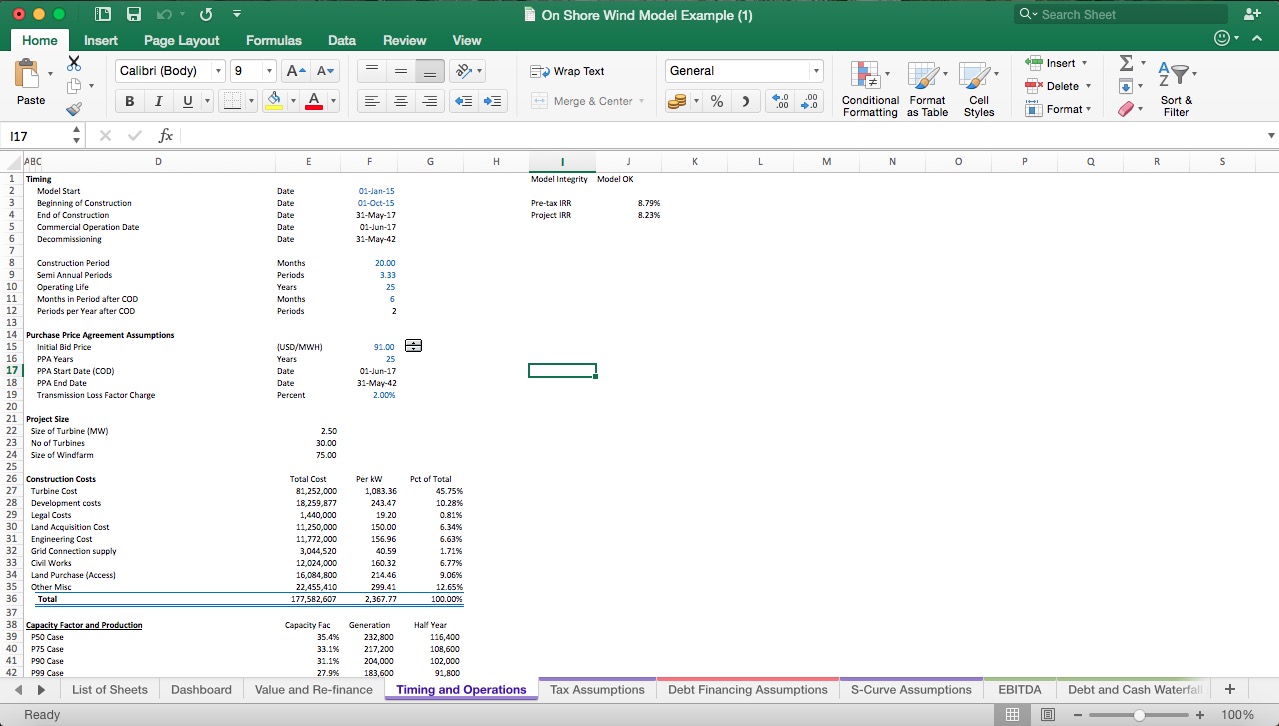
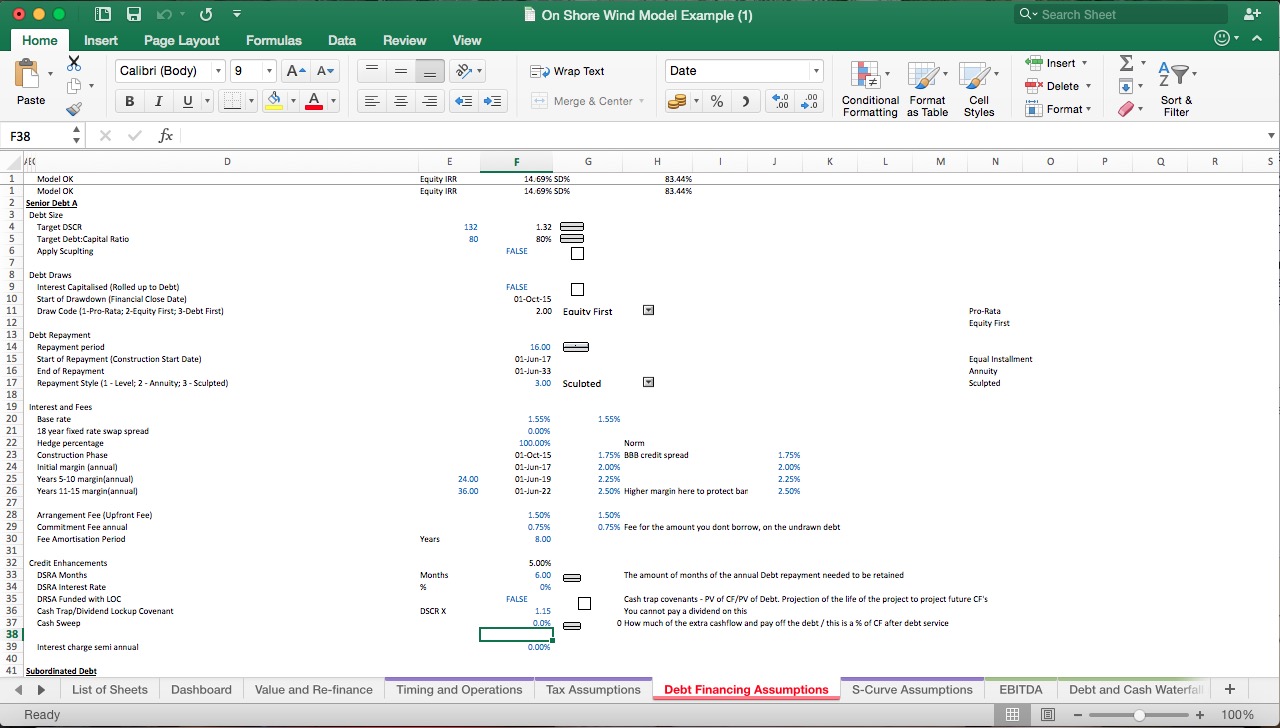
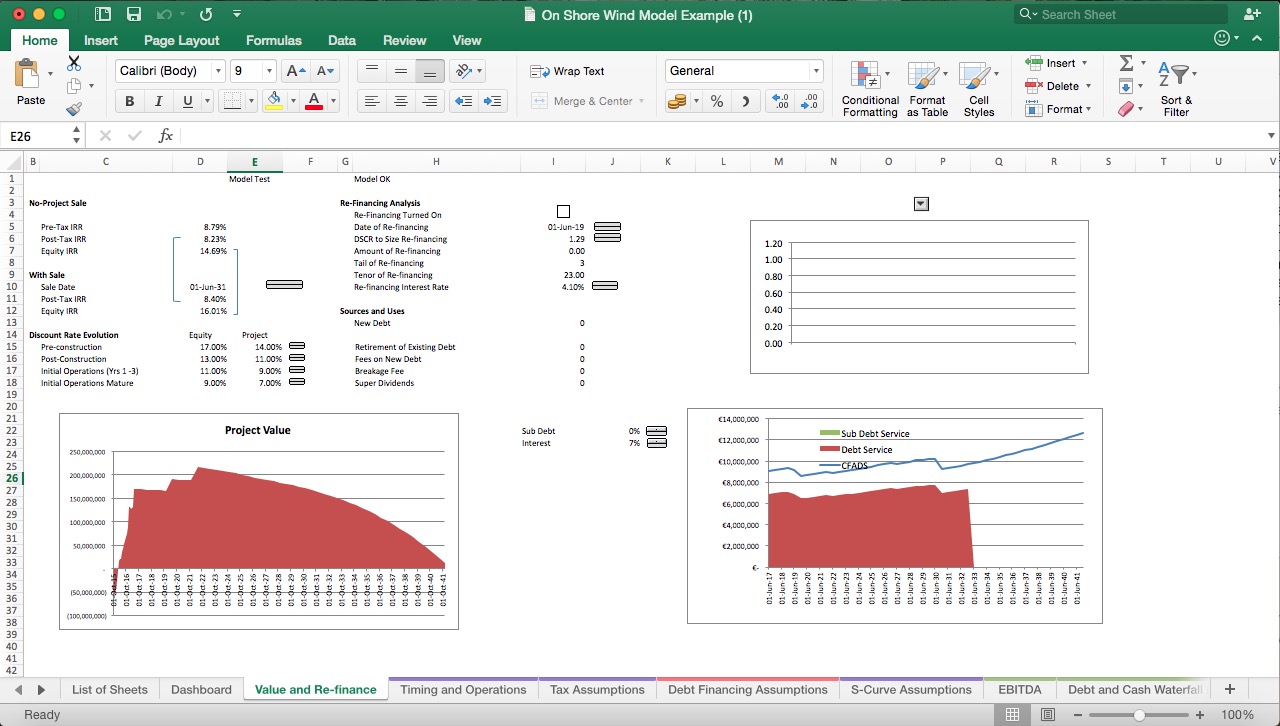
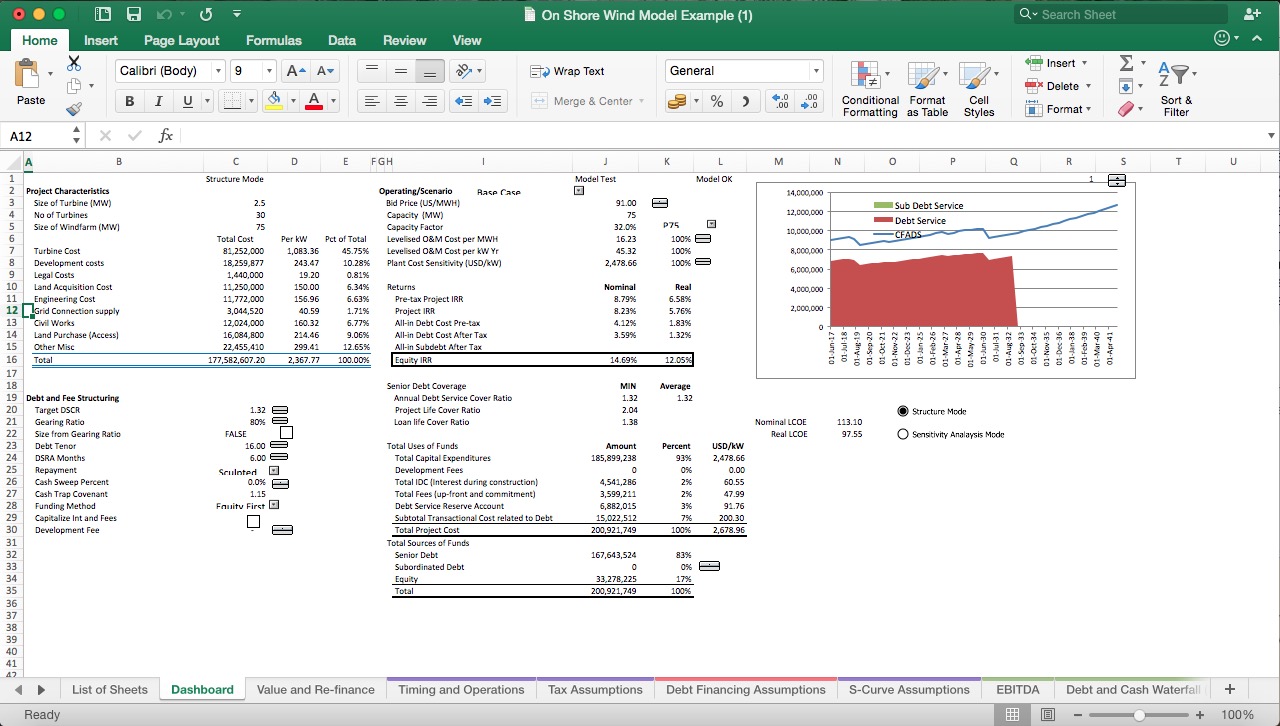
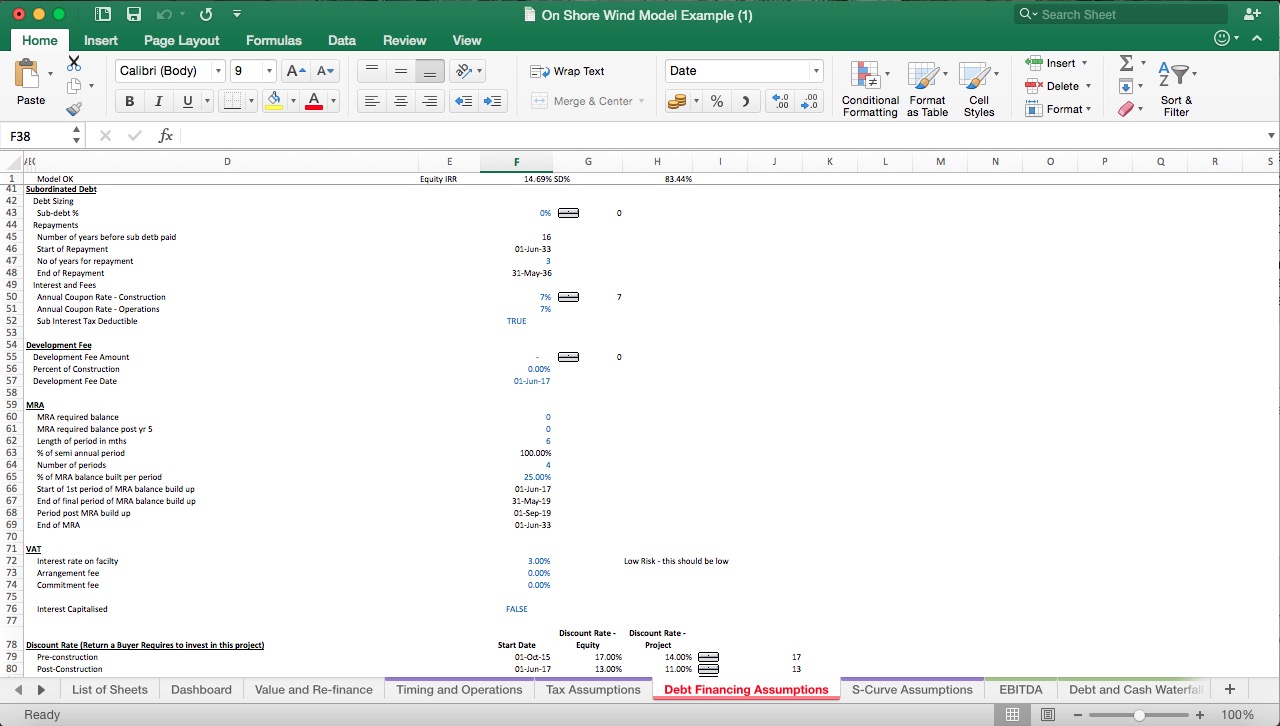
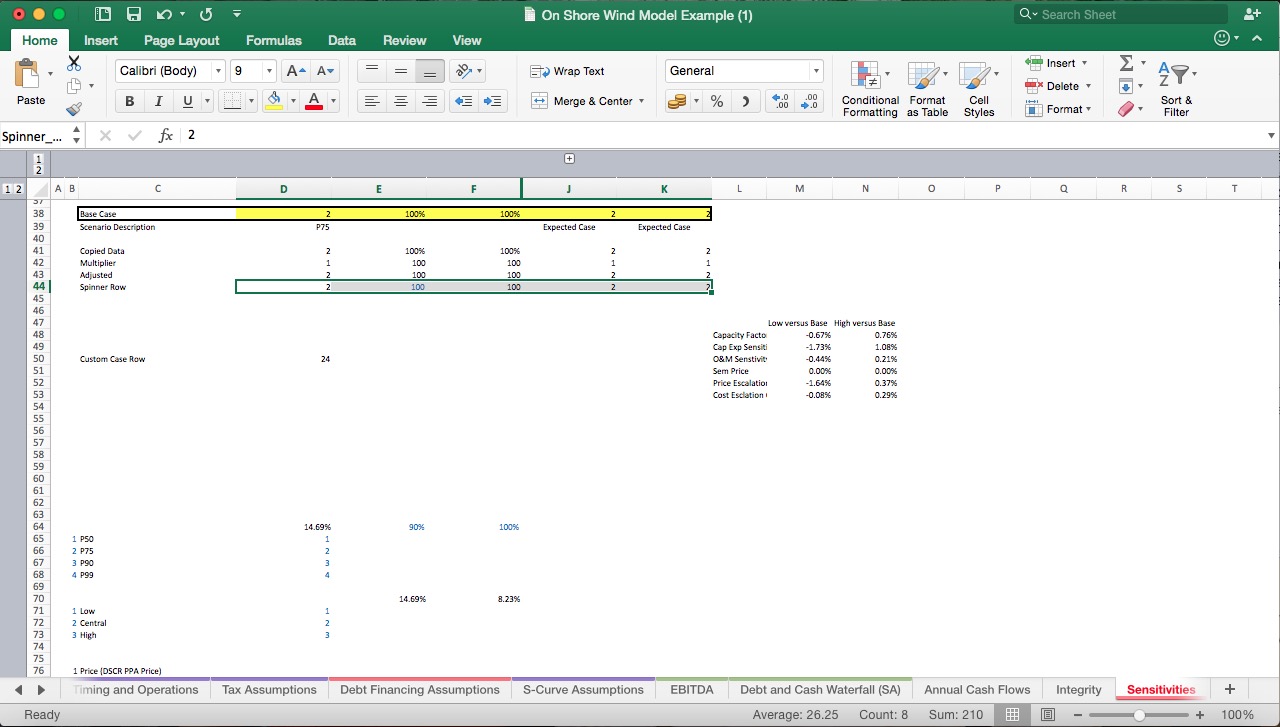
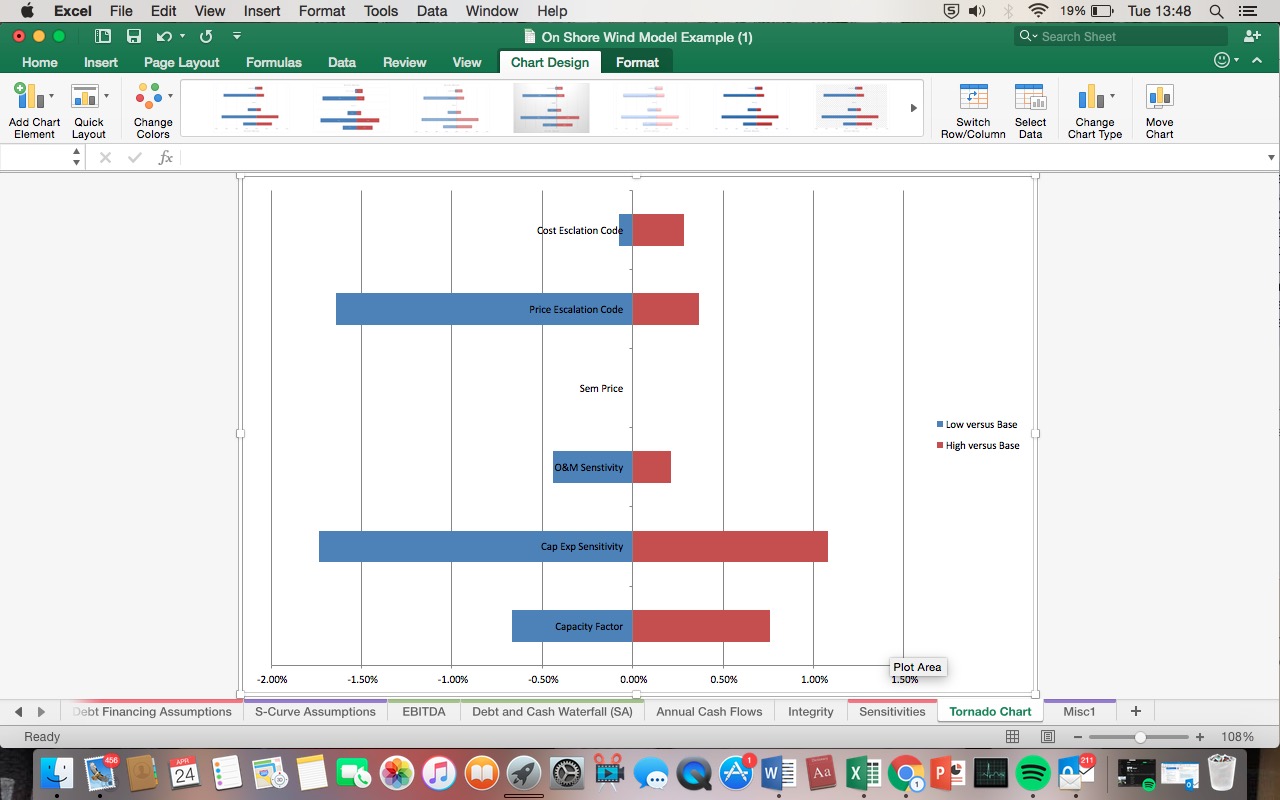
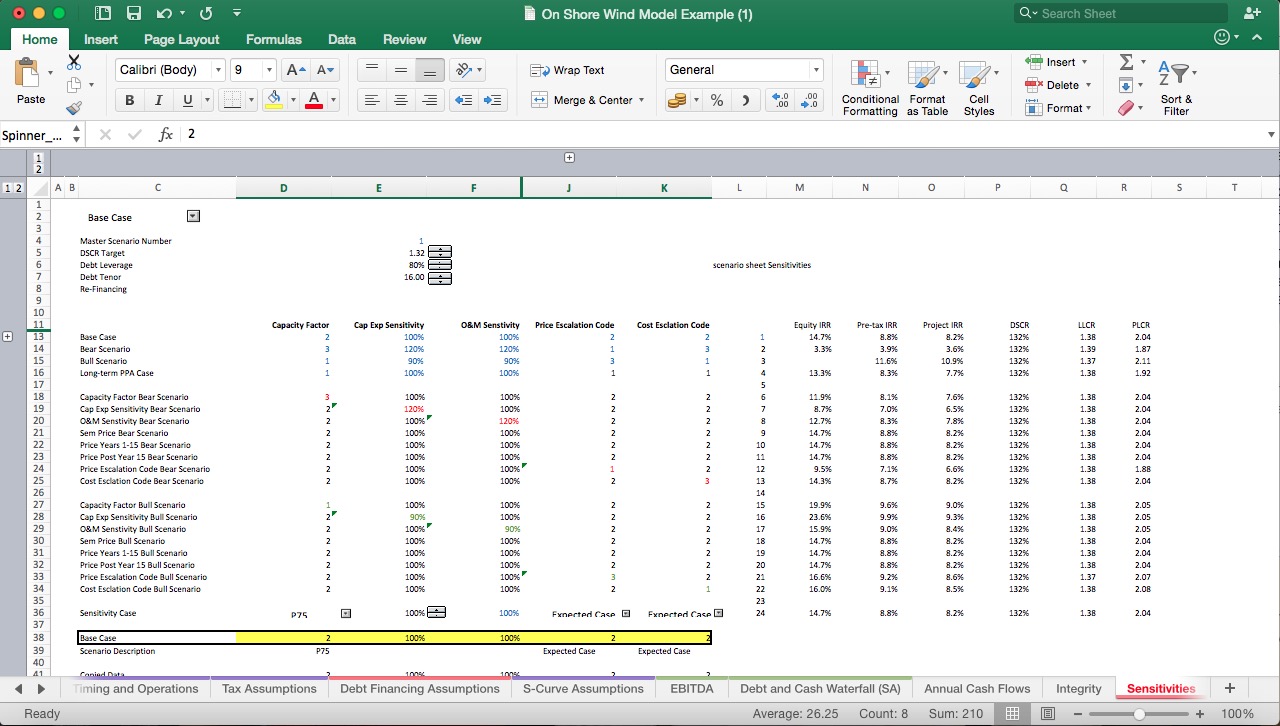
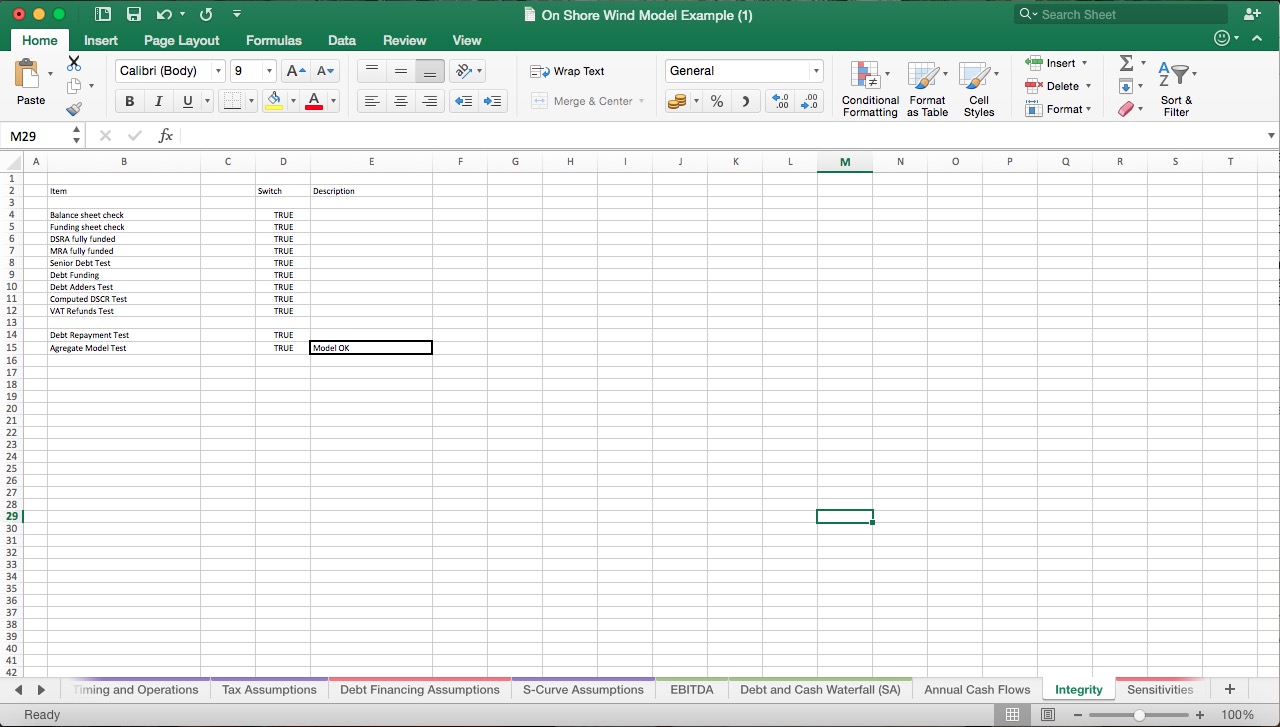
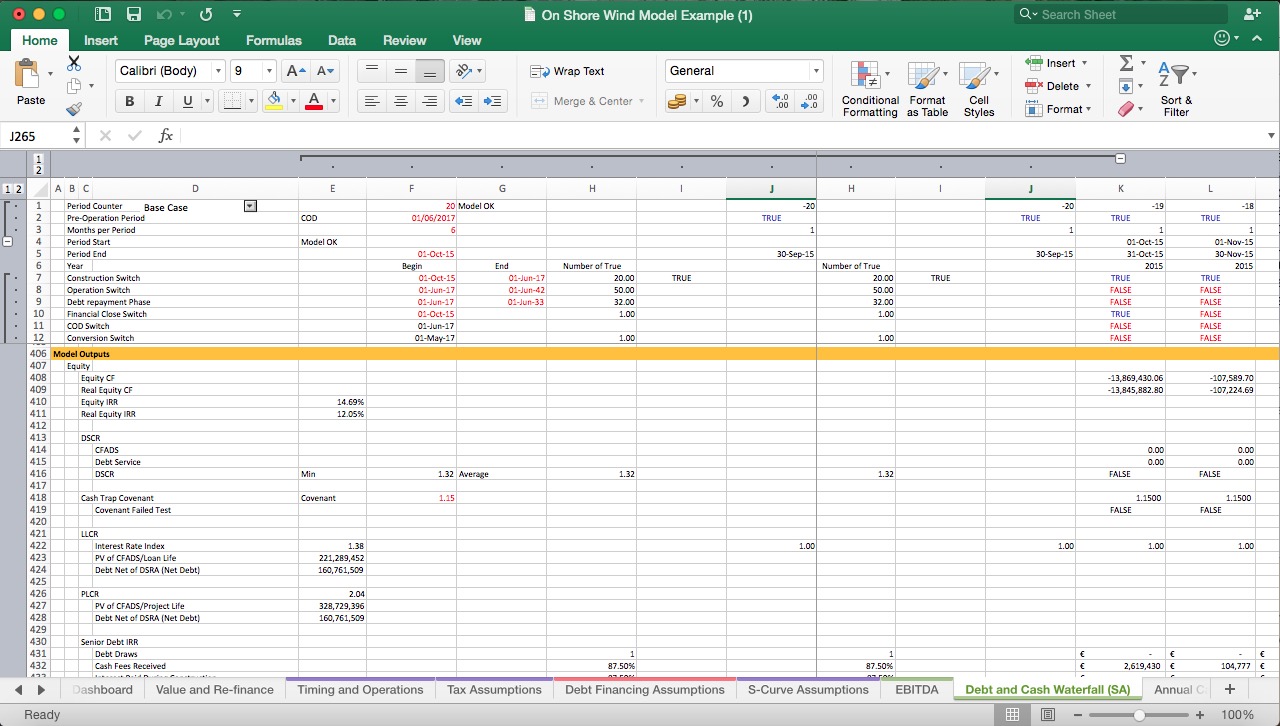
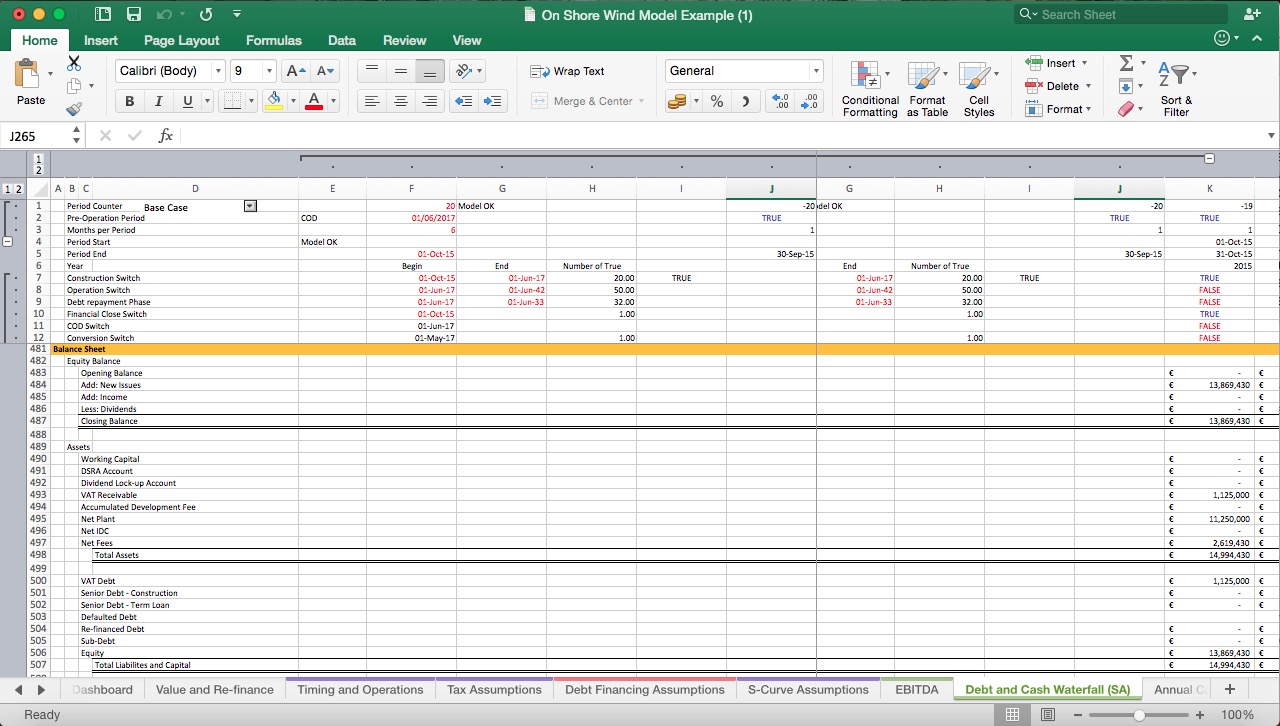
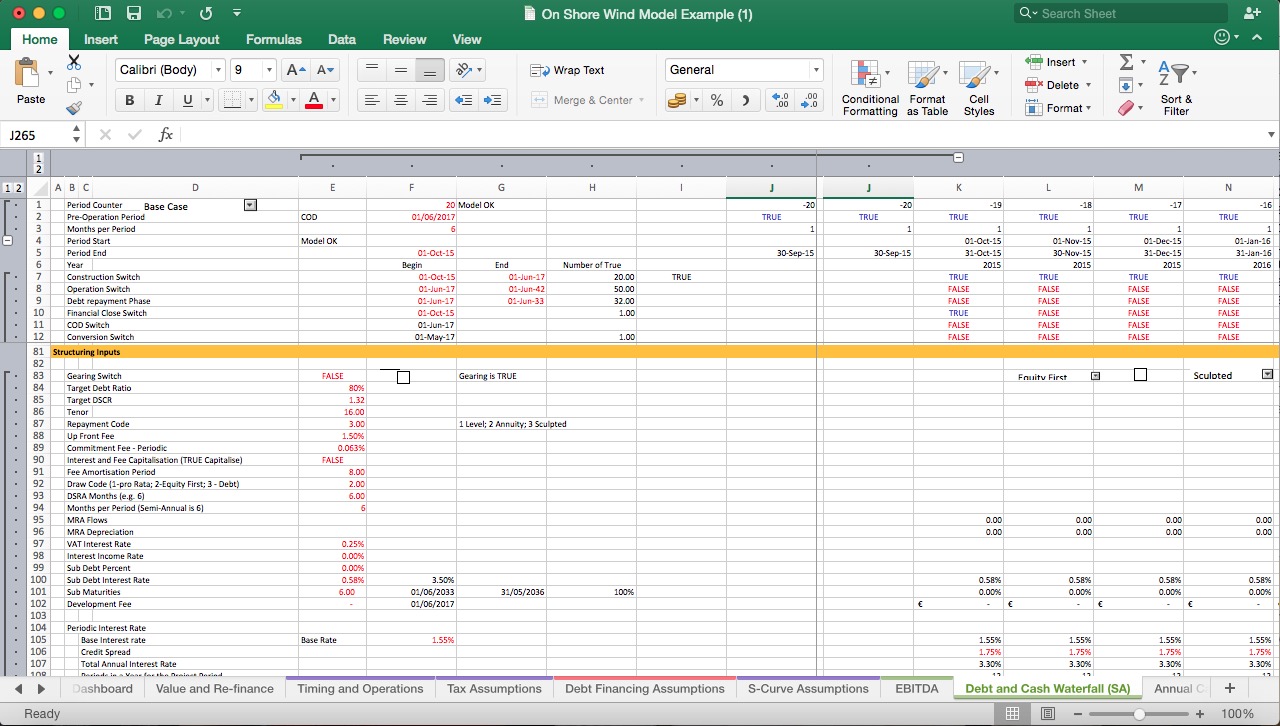
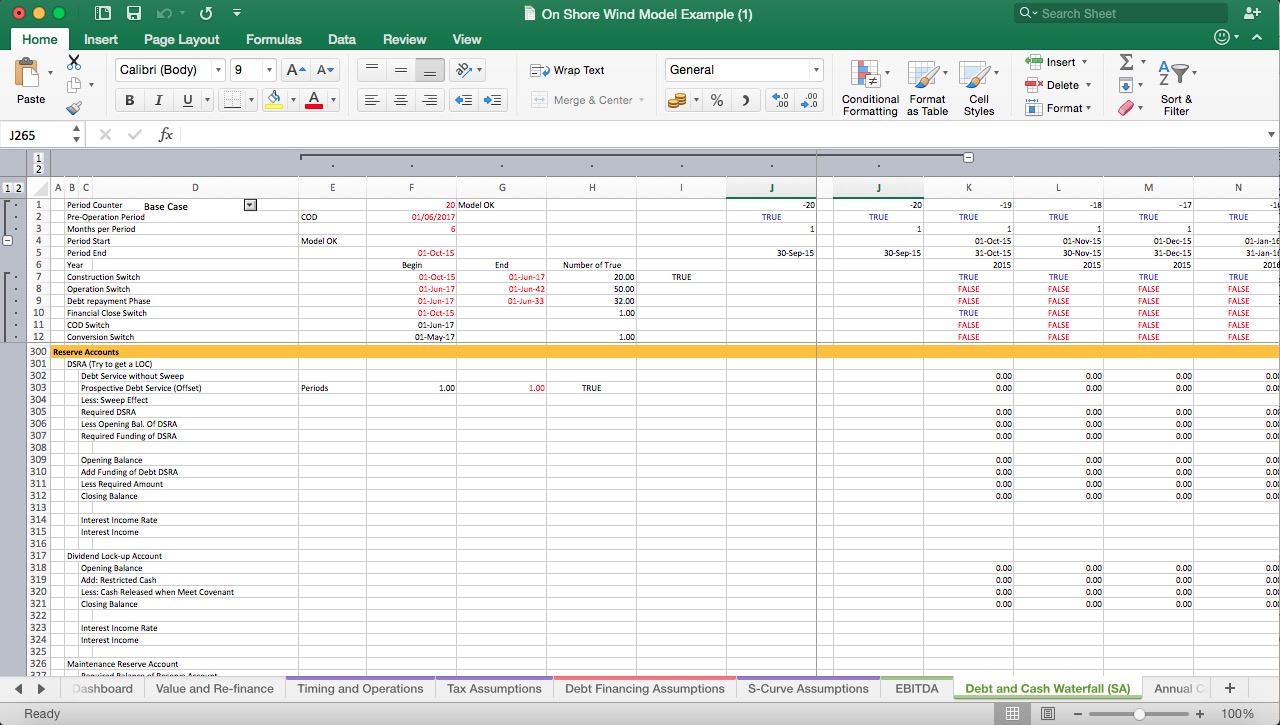
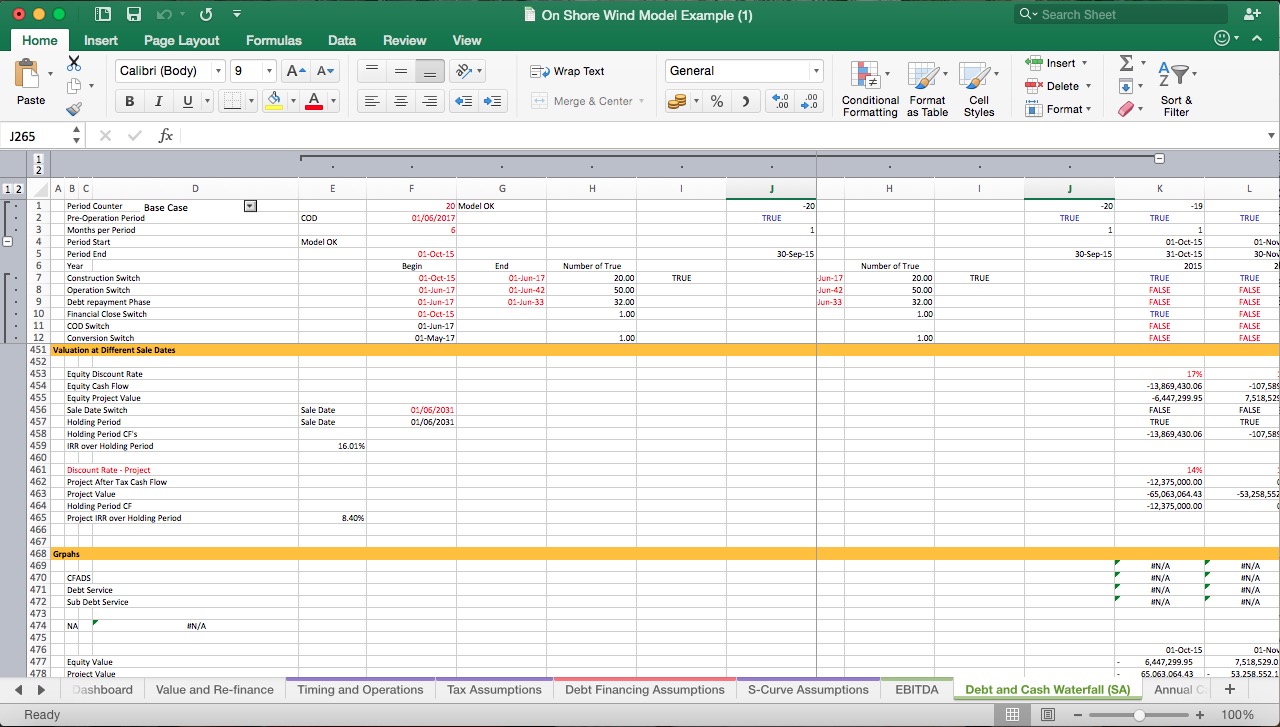
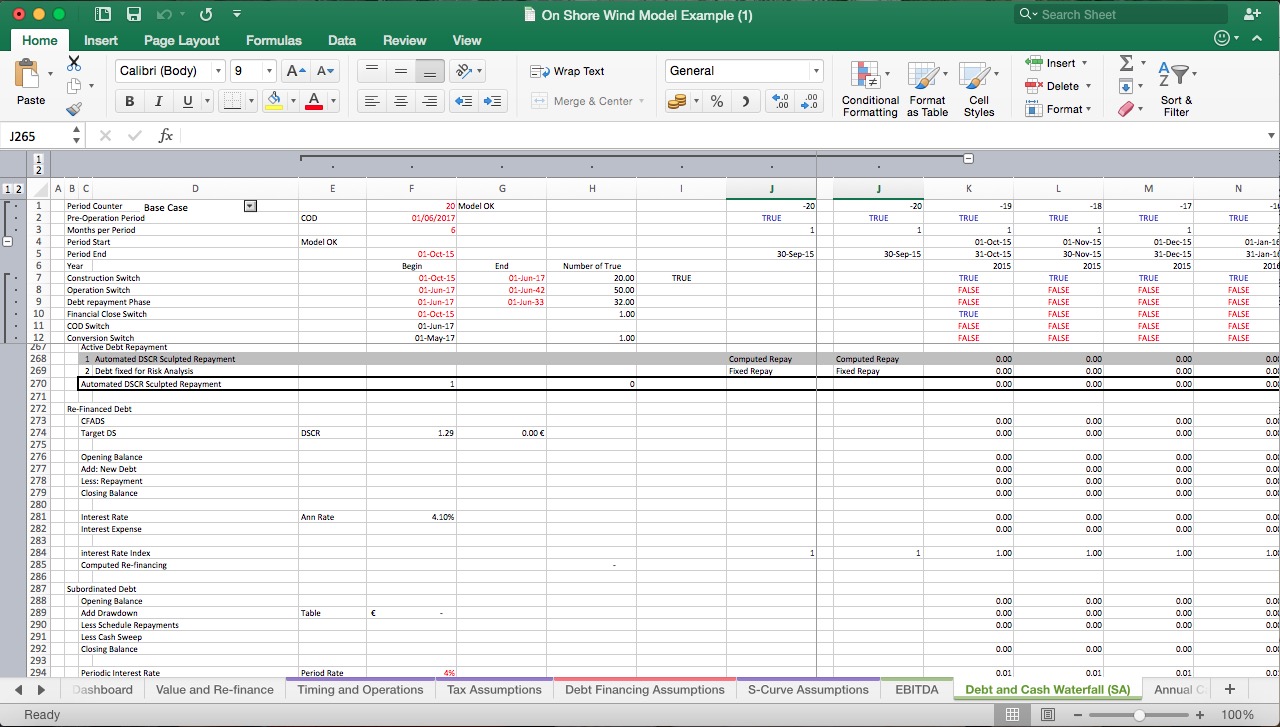
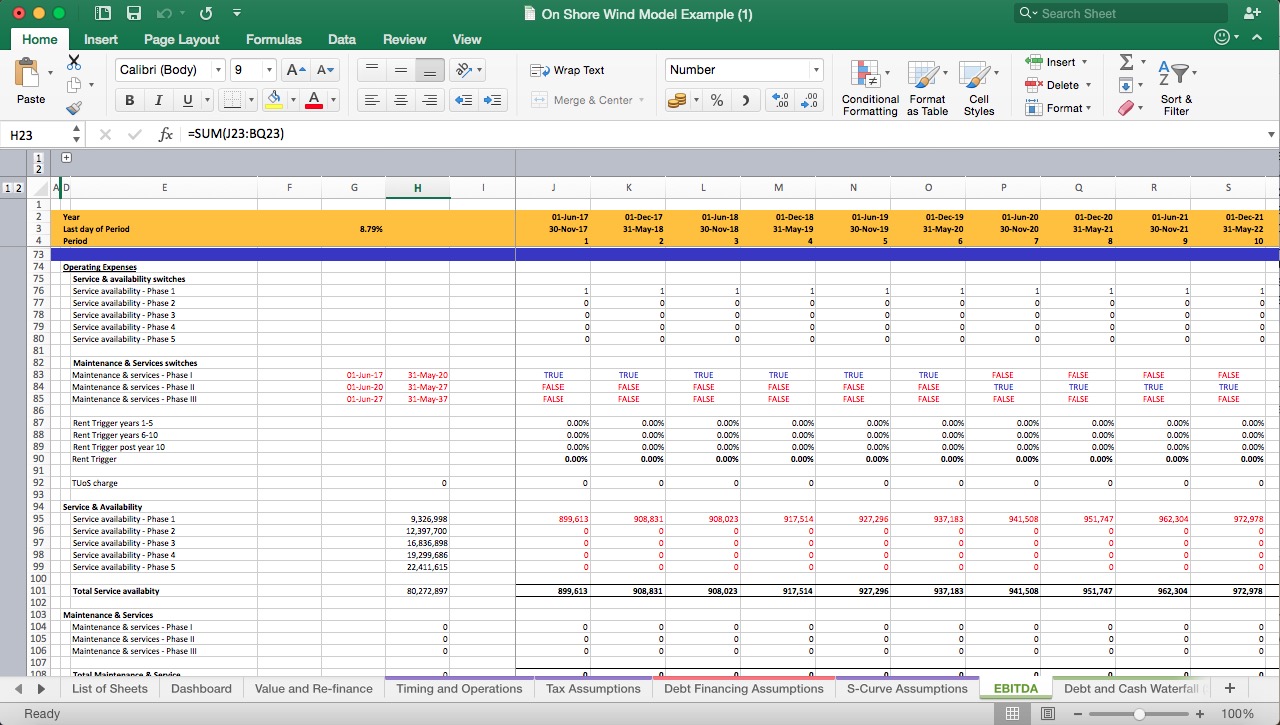
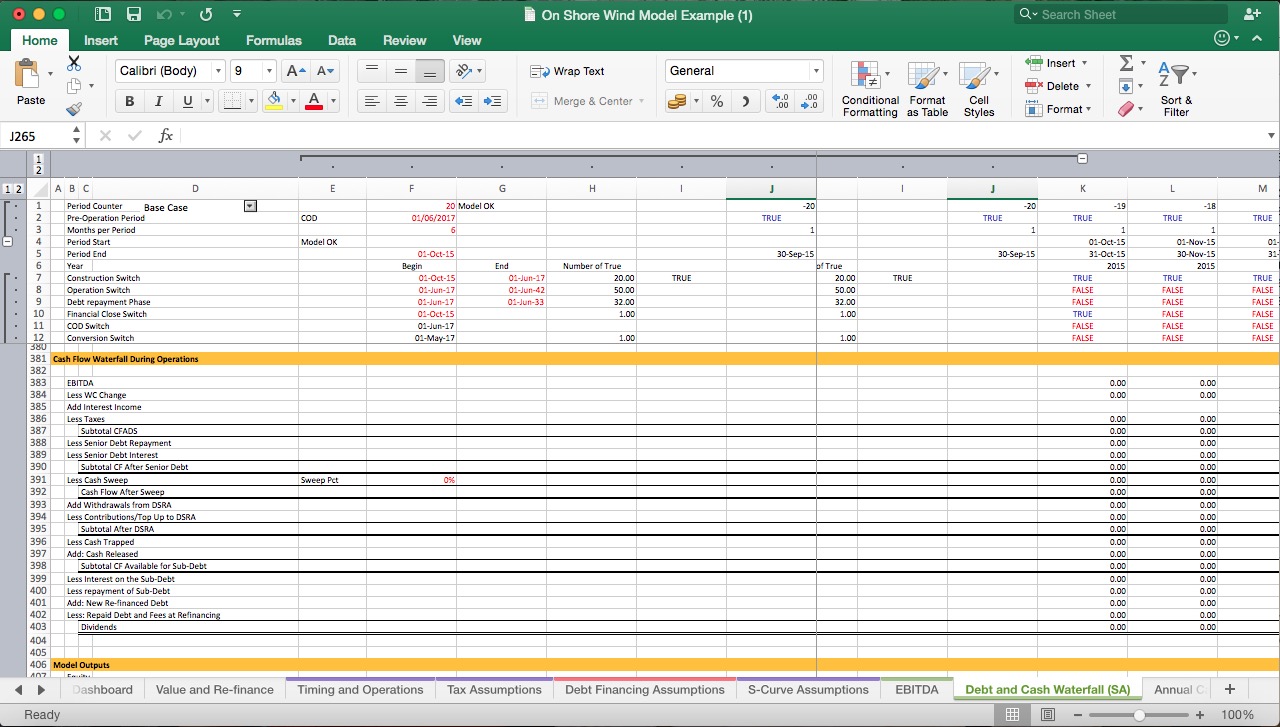
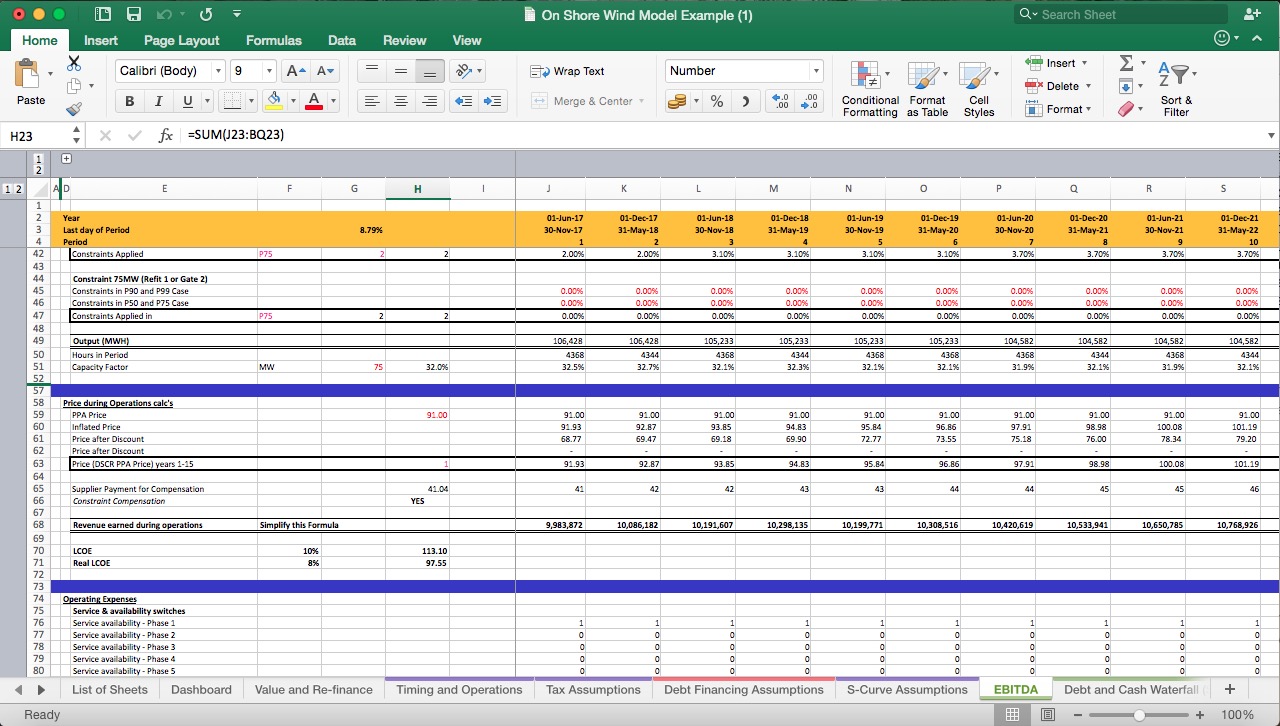
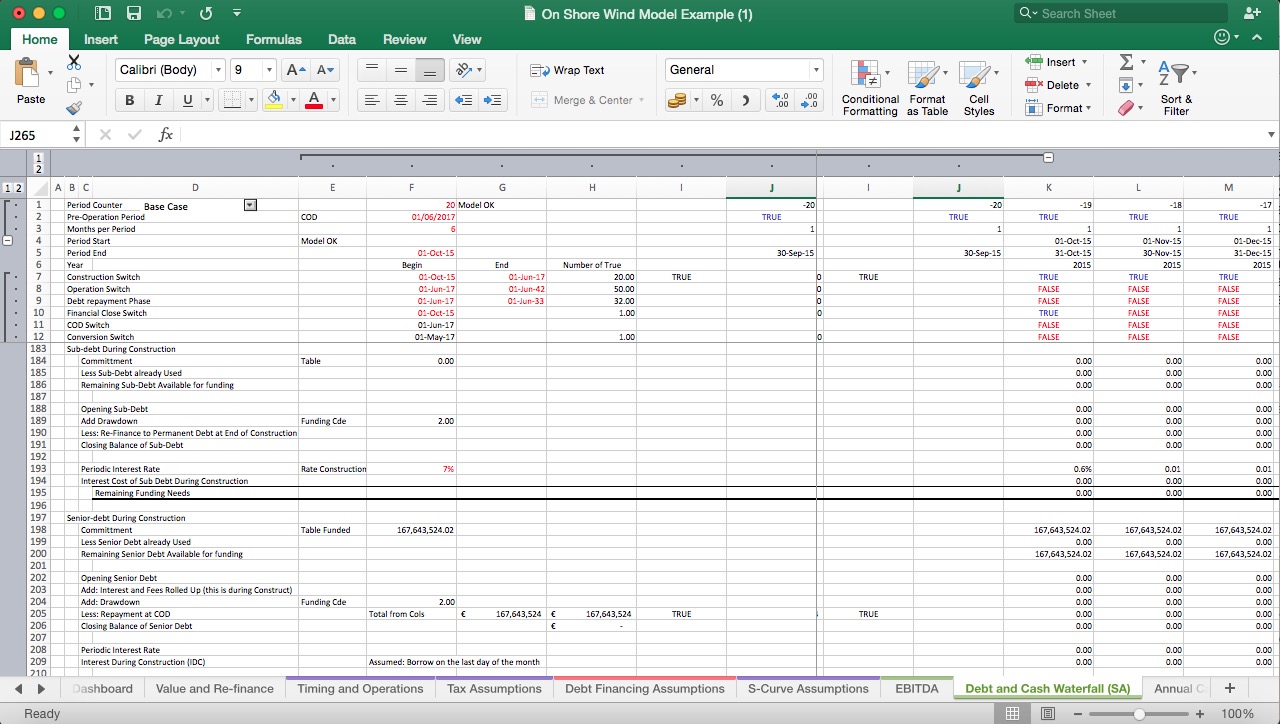
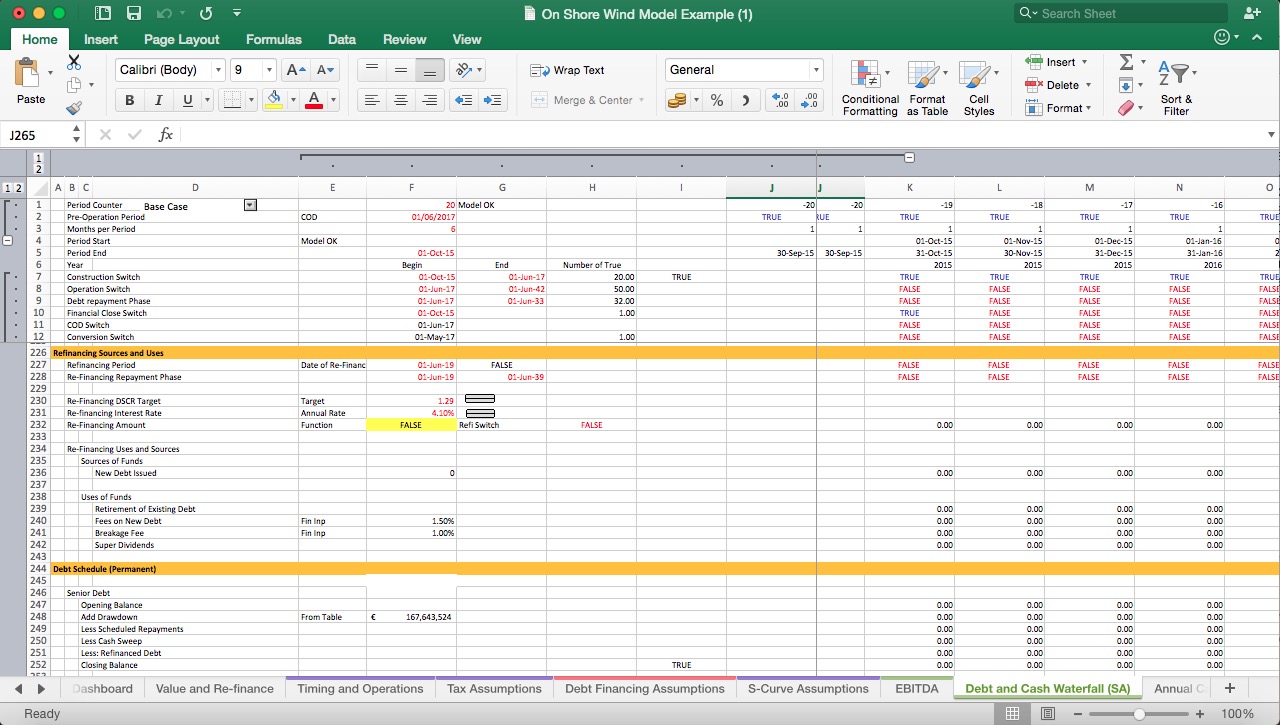
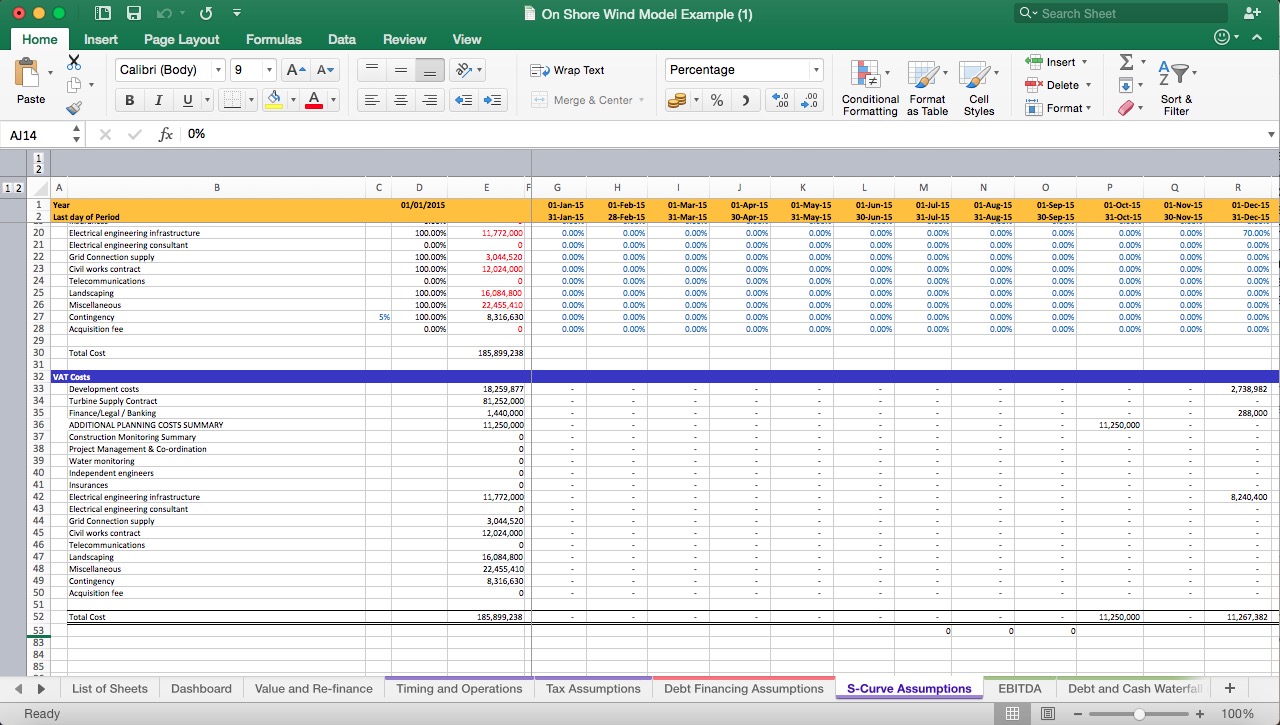
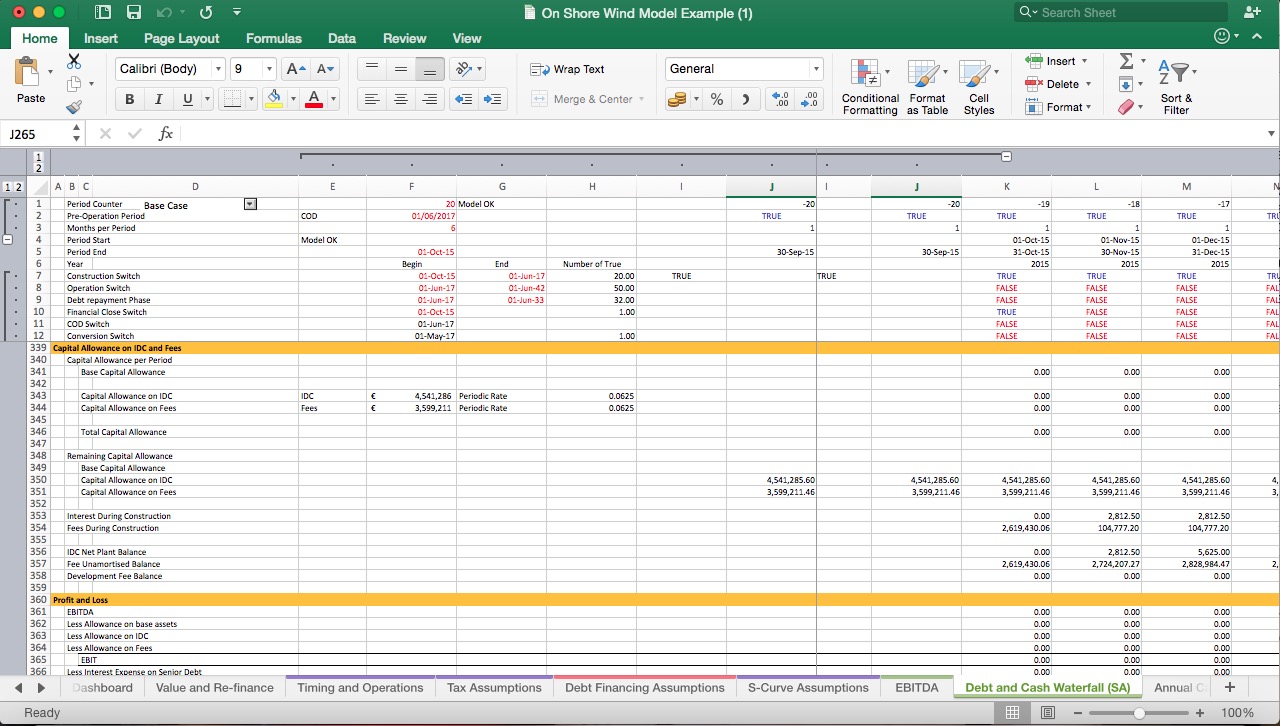
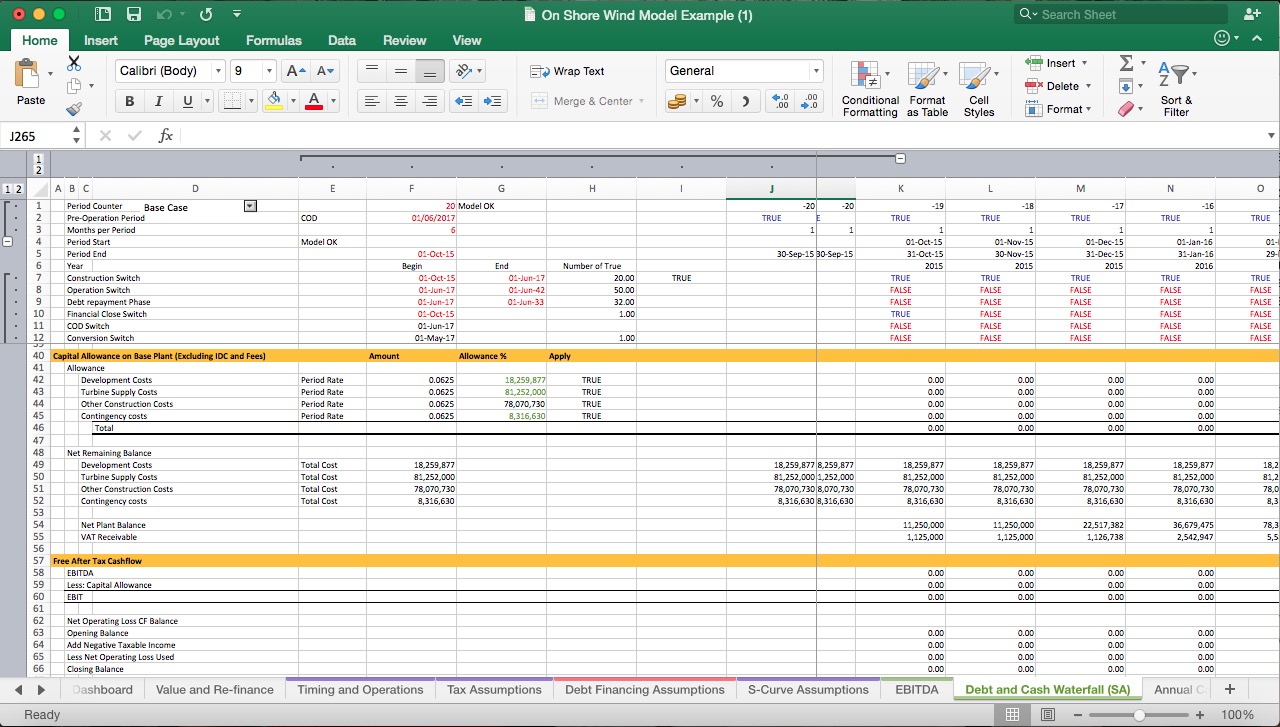
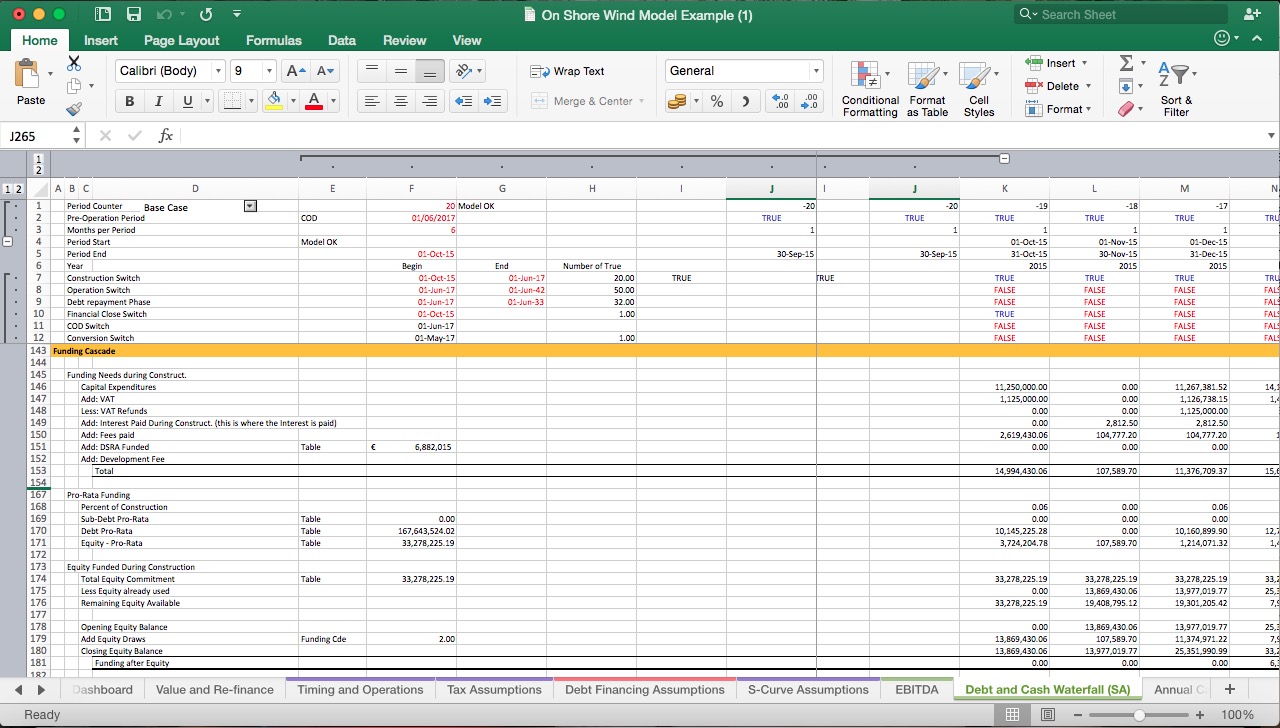
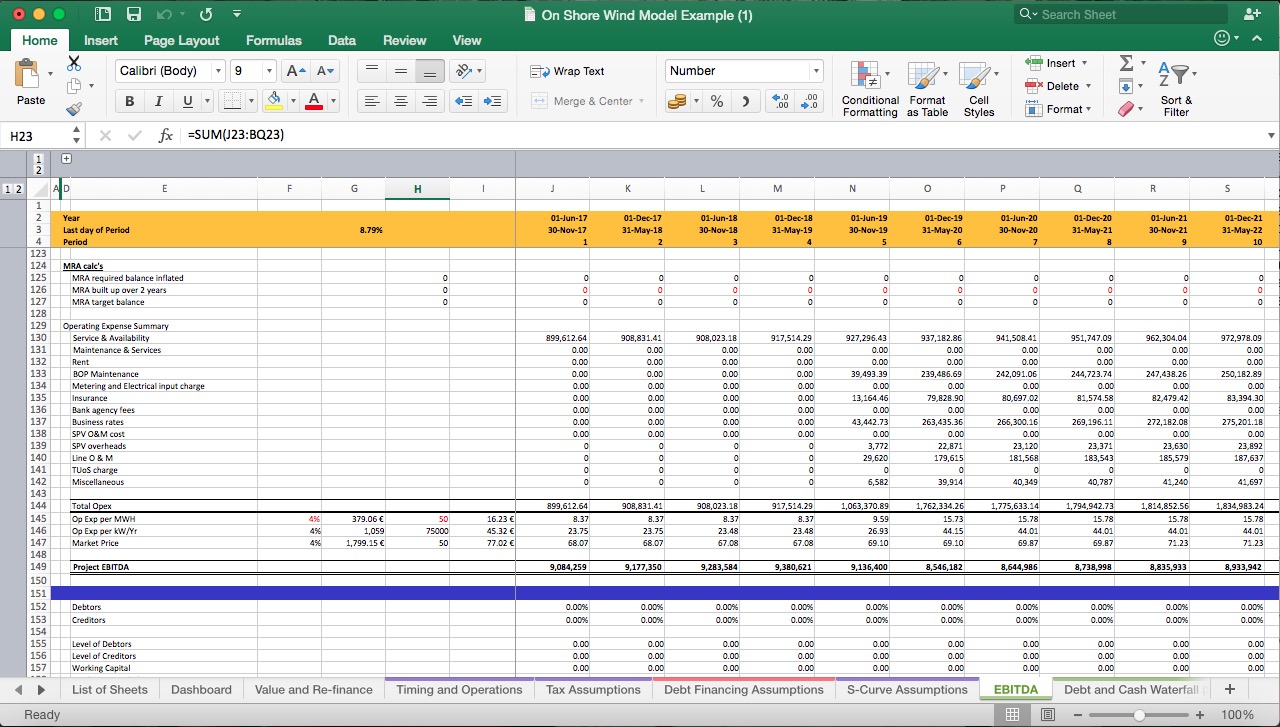
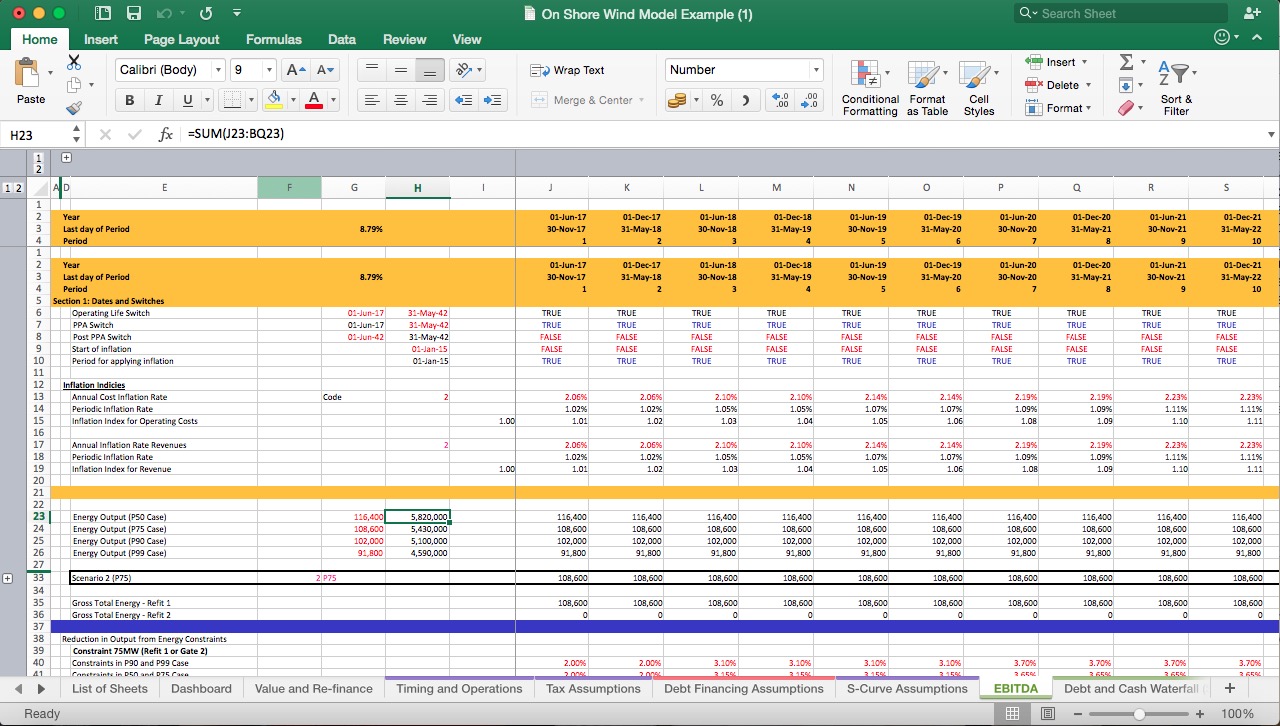
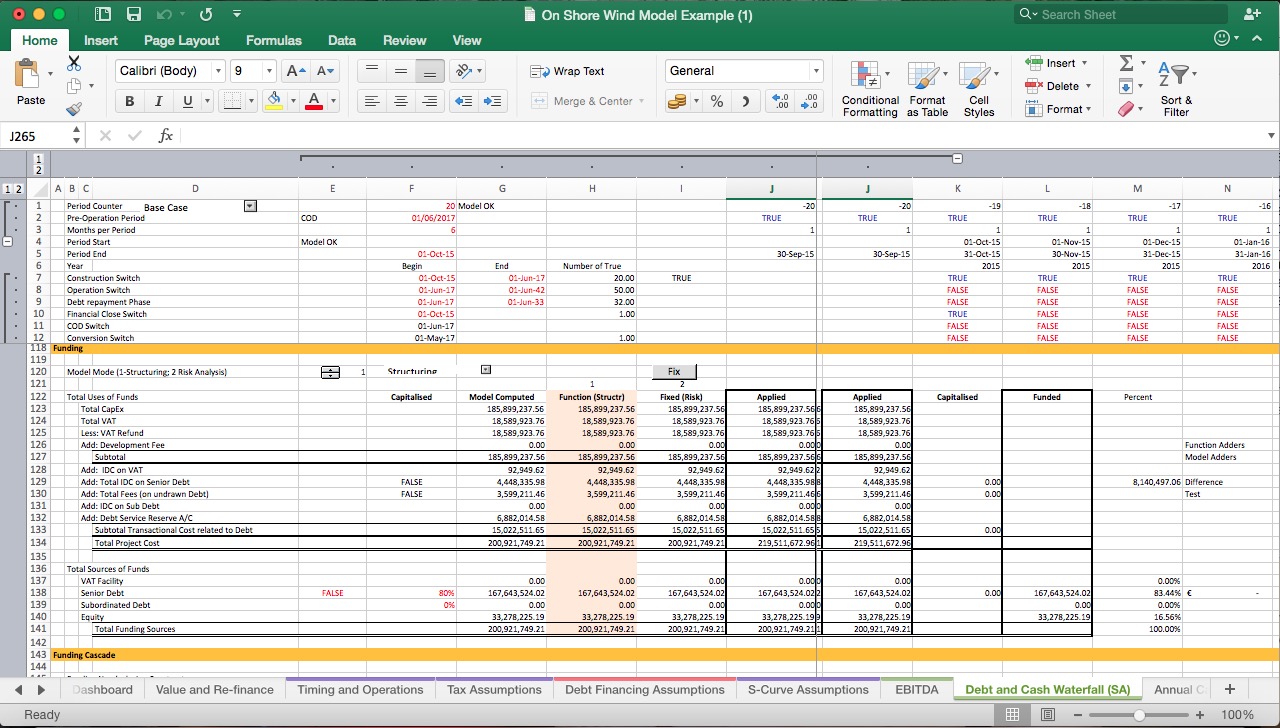
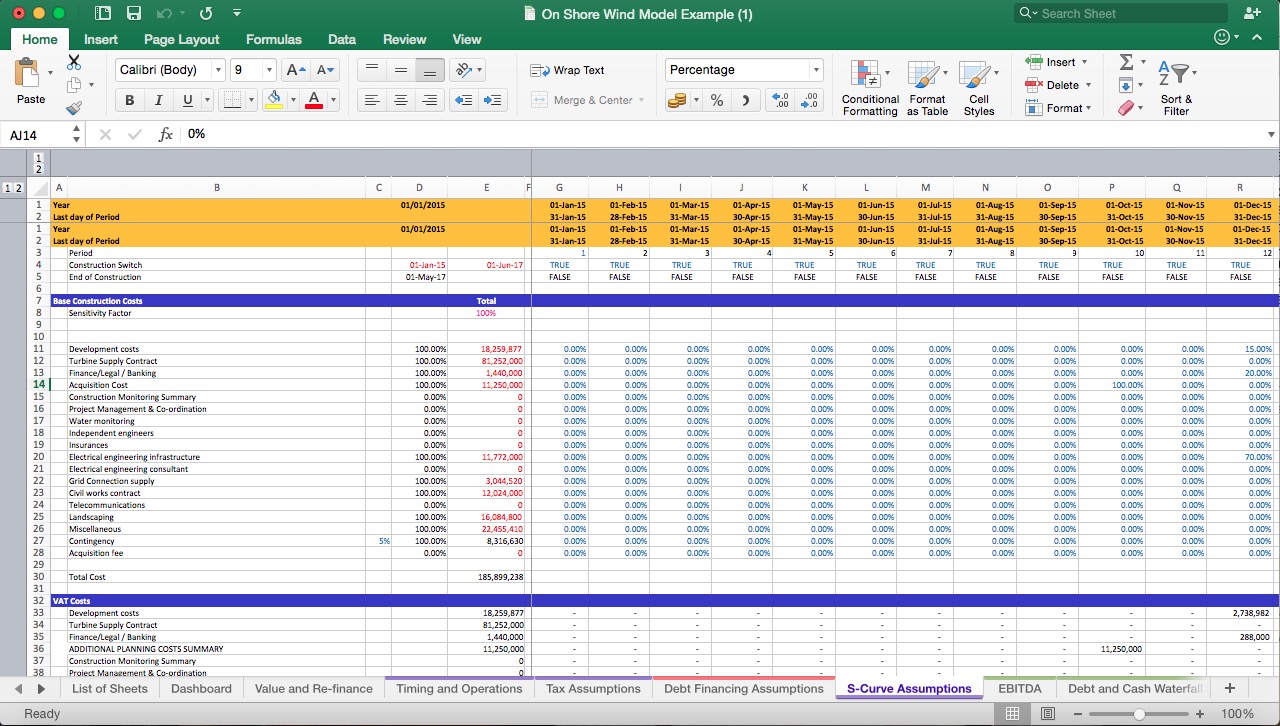
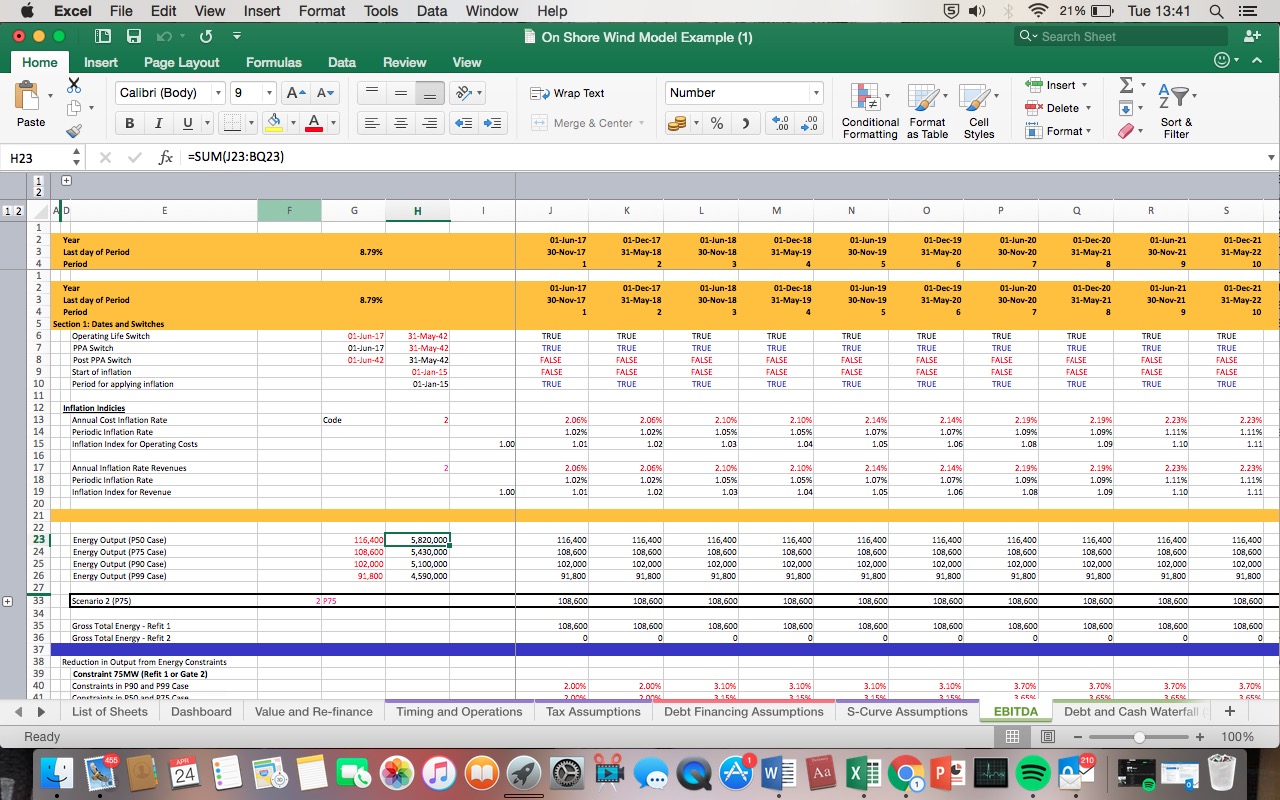
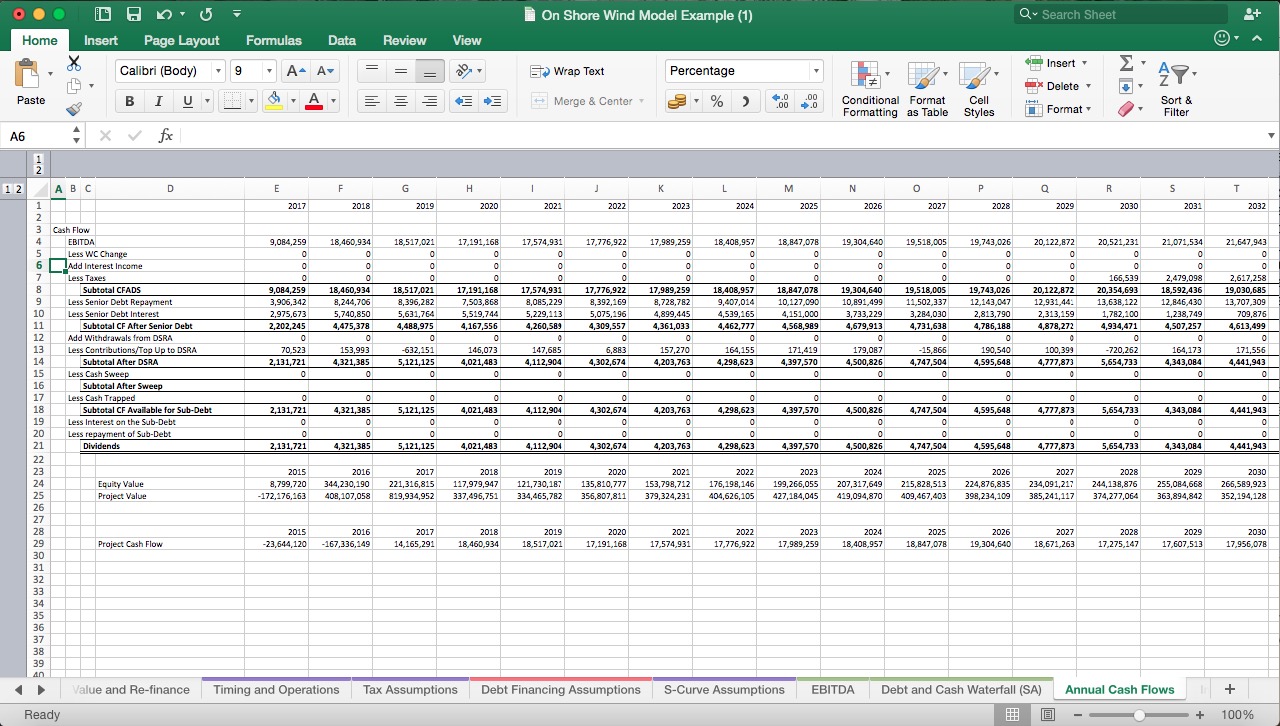
On Shore Wind Excel Model
Detailed financial model for your on shore wind investments
