Last version published: 27/05/2016 16:27
Publication number: ELQ-78791-4
View all versions & Certificate

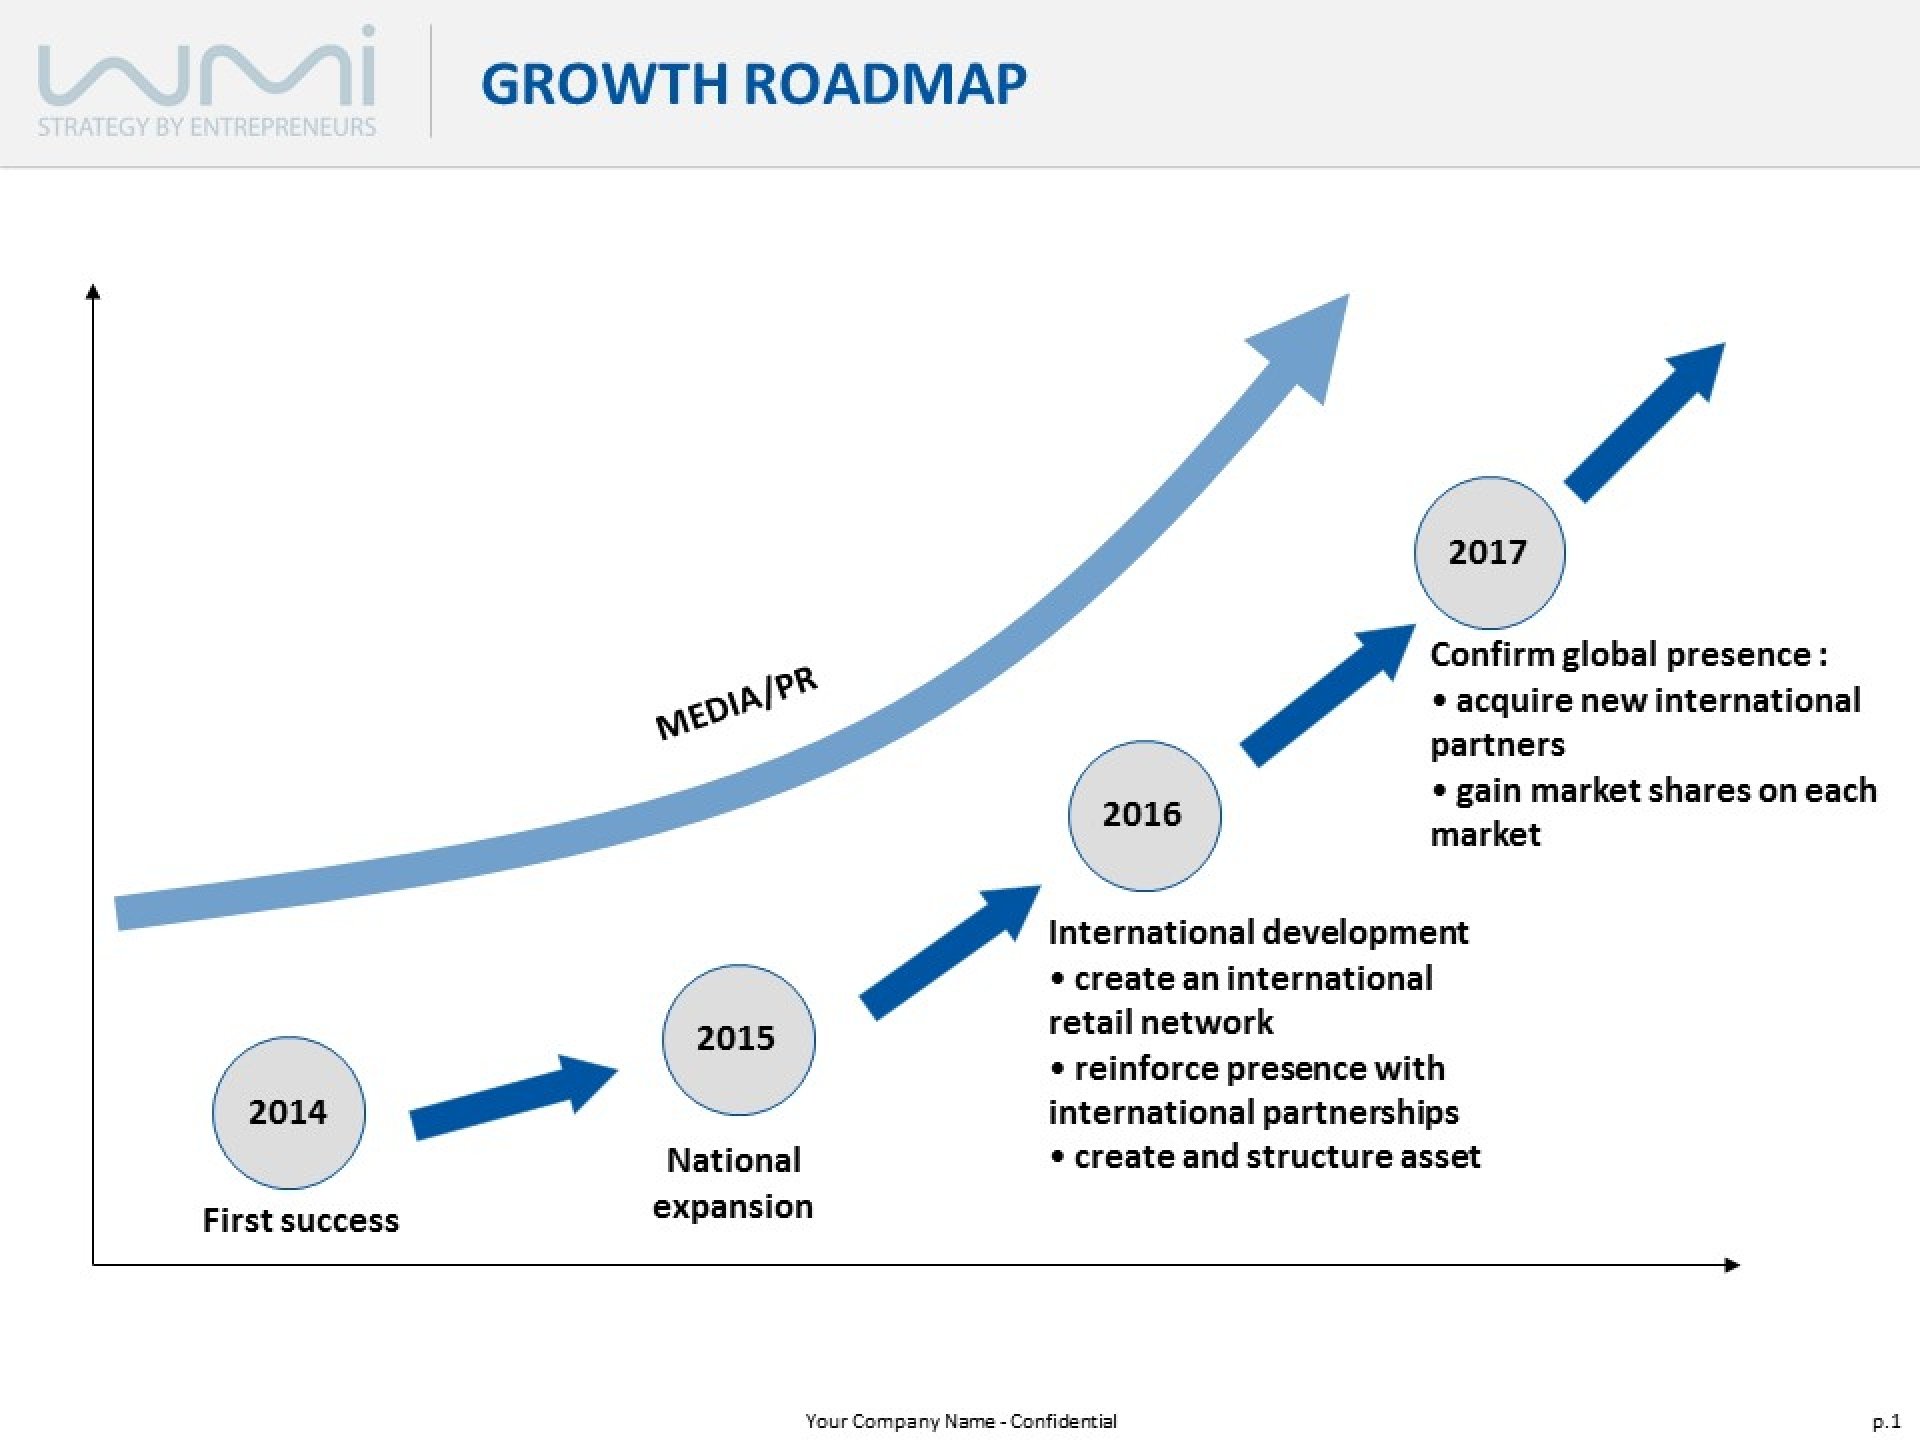
Growth roadmap
Show your concept/business/project development on an ascending graph.
Deputy Director #MBADMB EFAP | Strategy consulting & marketing @AdVentures Startup Studio (incl. Wimi)Follow
Further information
Show the real or projected development of your business and pinpoint your main achievements or milestones. Reflect on your strategy by showing the evolution of a significant indicator alongside your chronological development.
• Accurately produce a project history with an elegant and inspiring chronological layout
• Give an impression of a flourishing business or idea thanks to the ascending arrow
• Stress 4 to 5 key events that will drive or have marked your progress across to your audience
• Flesh out theoretic strategies with real or projected milestones
• Bring value to your strategy by illustrating your development using relevant performance indicators
• You want to indicate business growth or a successful concept
• You want to highlight 4 to 5 key phases of development
• You want a visual representation of your company history
• You want a clear and inspiring layout with no superfluous information
• You have more than 4 to 5 milestones you want to display
• You wish to describe your milestones at length and with extra detail
• Your business is not on an ascending scale of growth or progress
• You want to pinpoint specific dates or events - this slide is better suited for describing general phases of development
