Last version published: 24/10/2016 13:42
Publication number: ELQ-58611-3
View all versions & Certificate

Stock Analysis Excel Model
Analyze past company performance and arrive at its intrinsic value in 30 minutes or less
Further information
The Excel file has the following sheets:
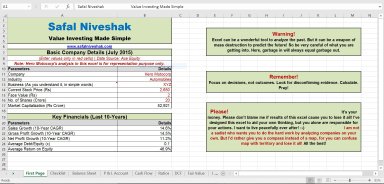
1) First Page: This sheet contains basic company data and a lot of warnings and disclaimers.
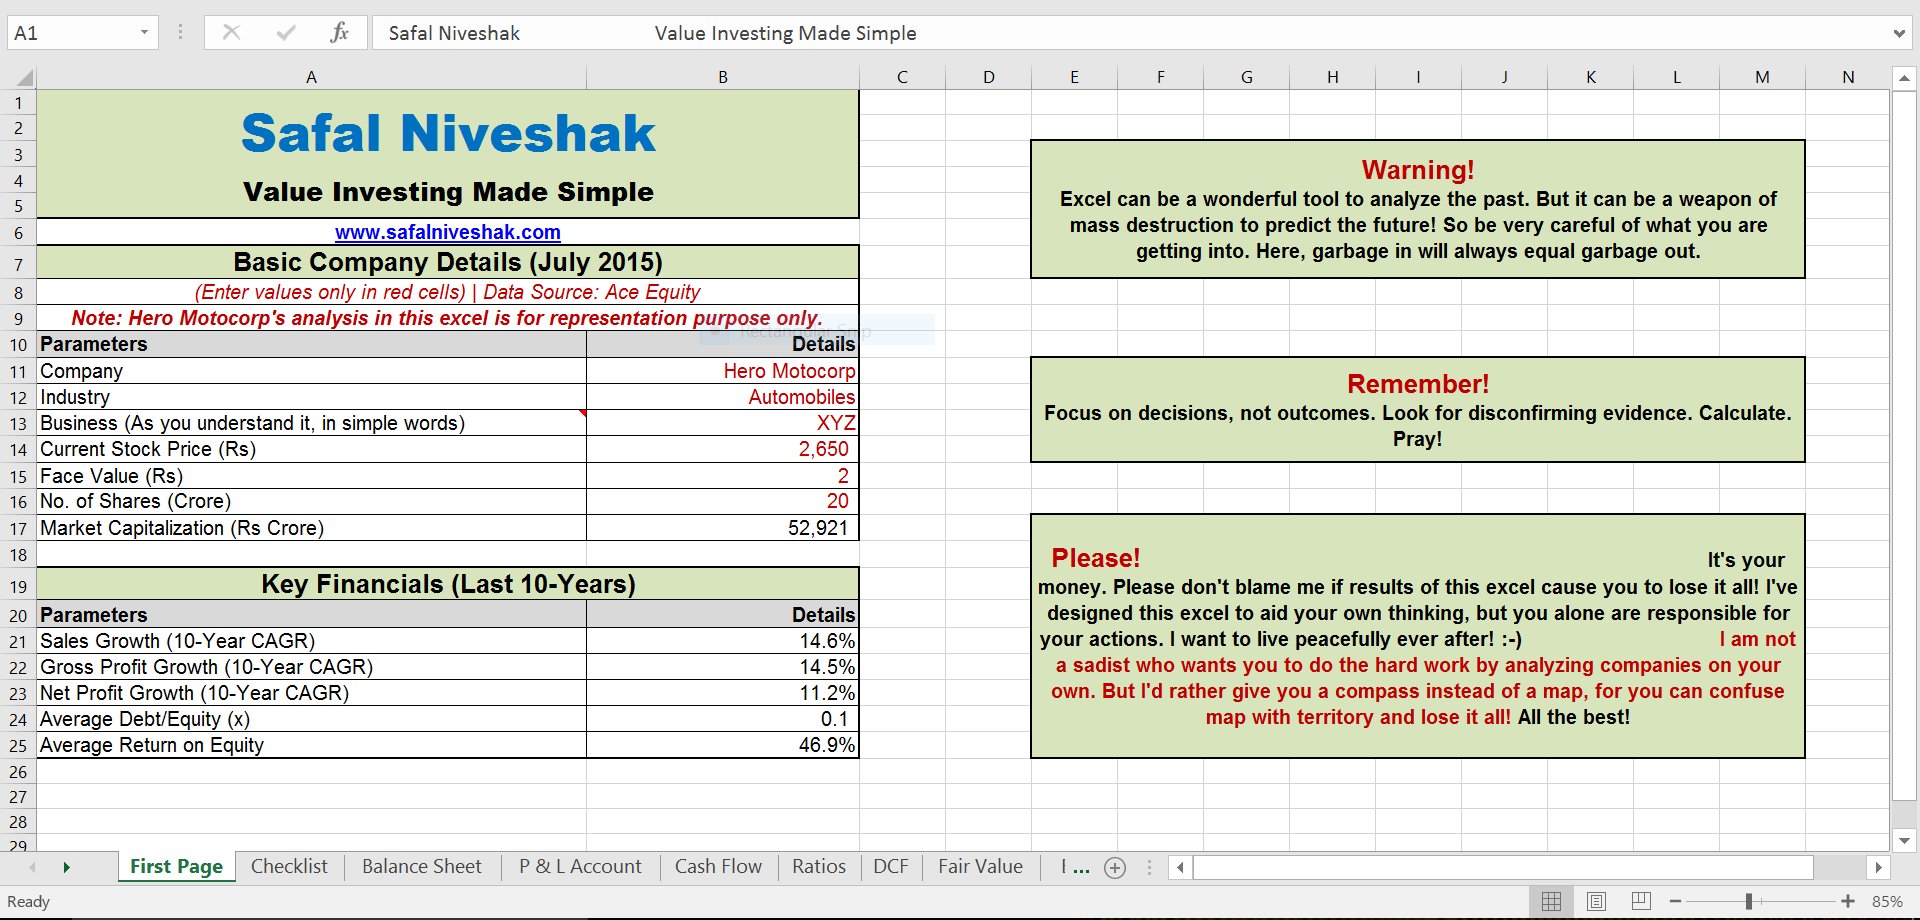
2) Checklist: Most important sheet! It contains a simple Buffett checklist that will help you a lot in your overall decision-making.
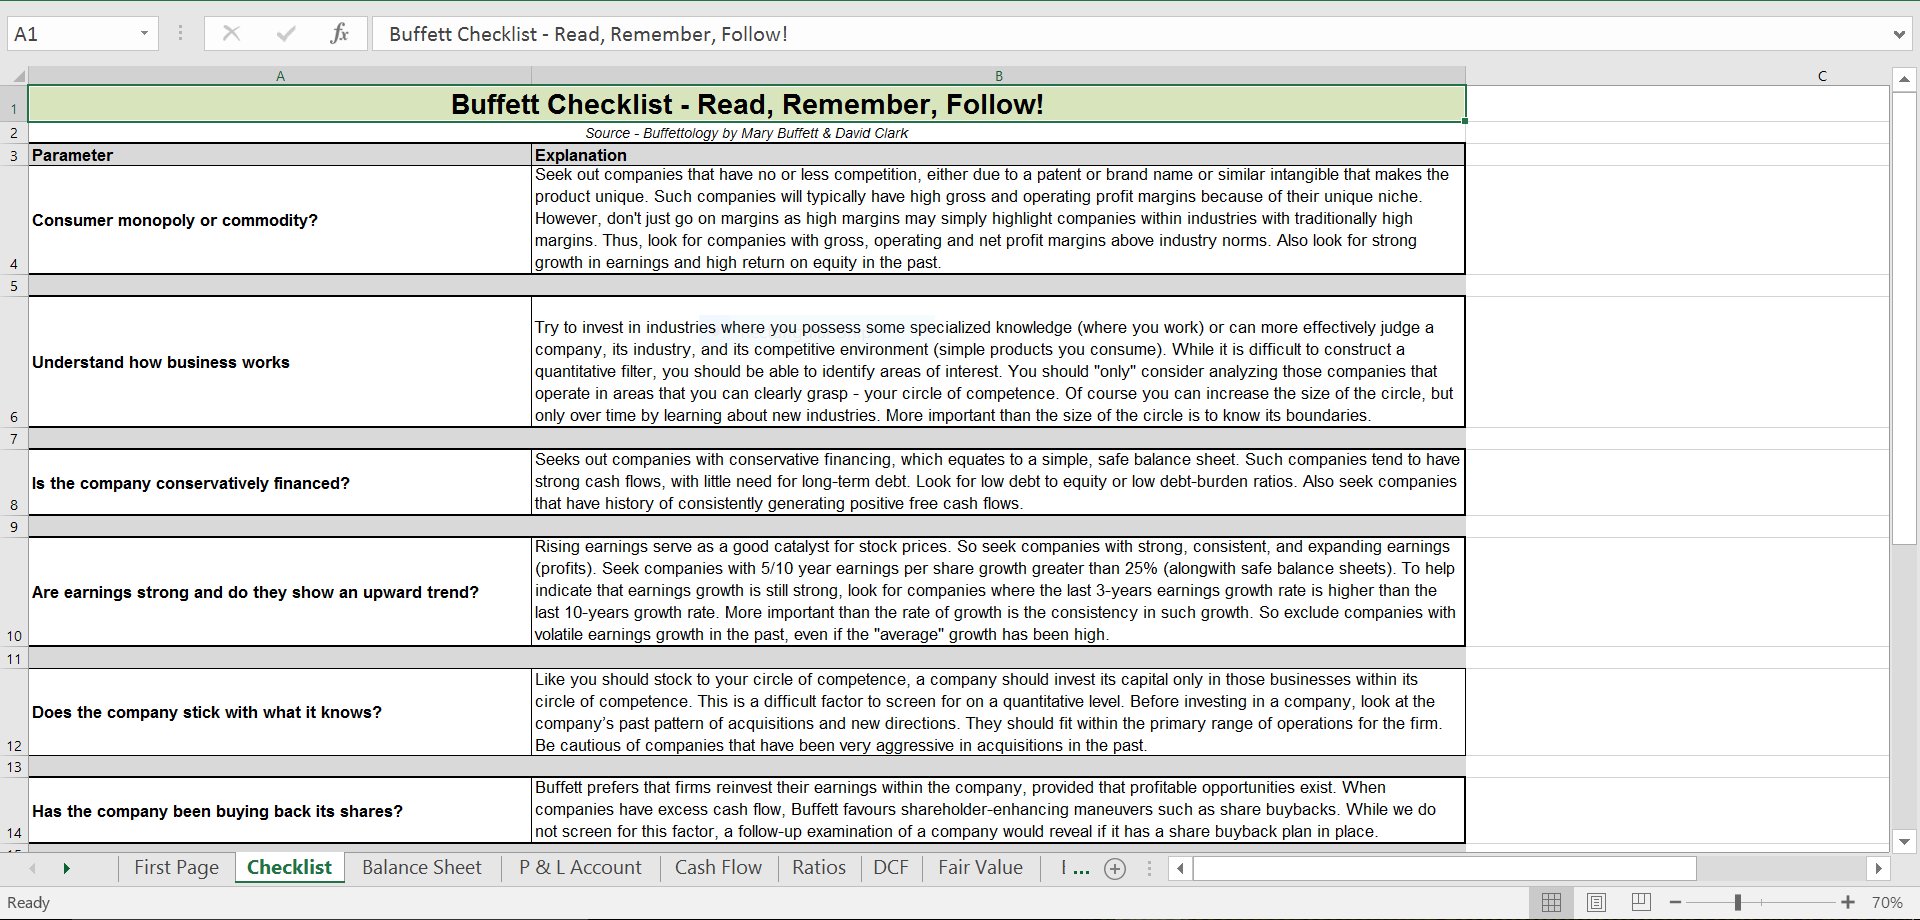
3) Balance Sheet: Enter the balance sheet numbers here (only the ones in red font).
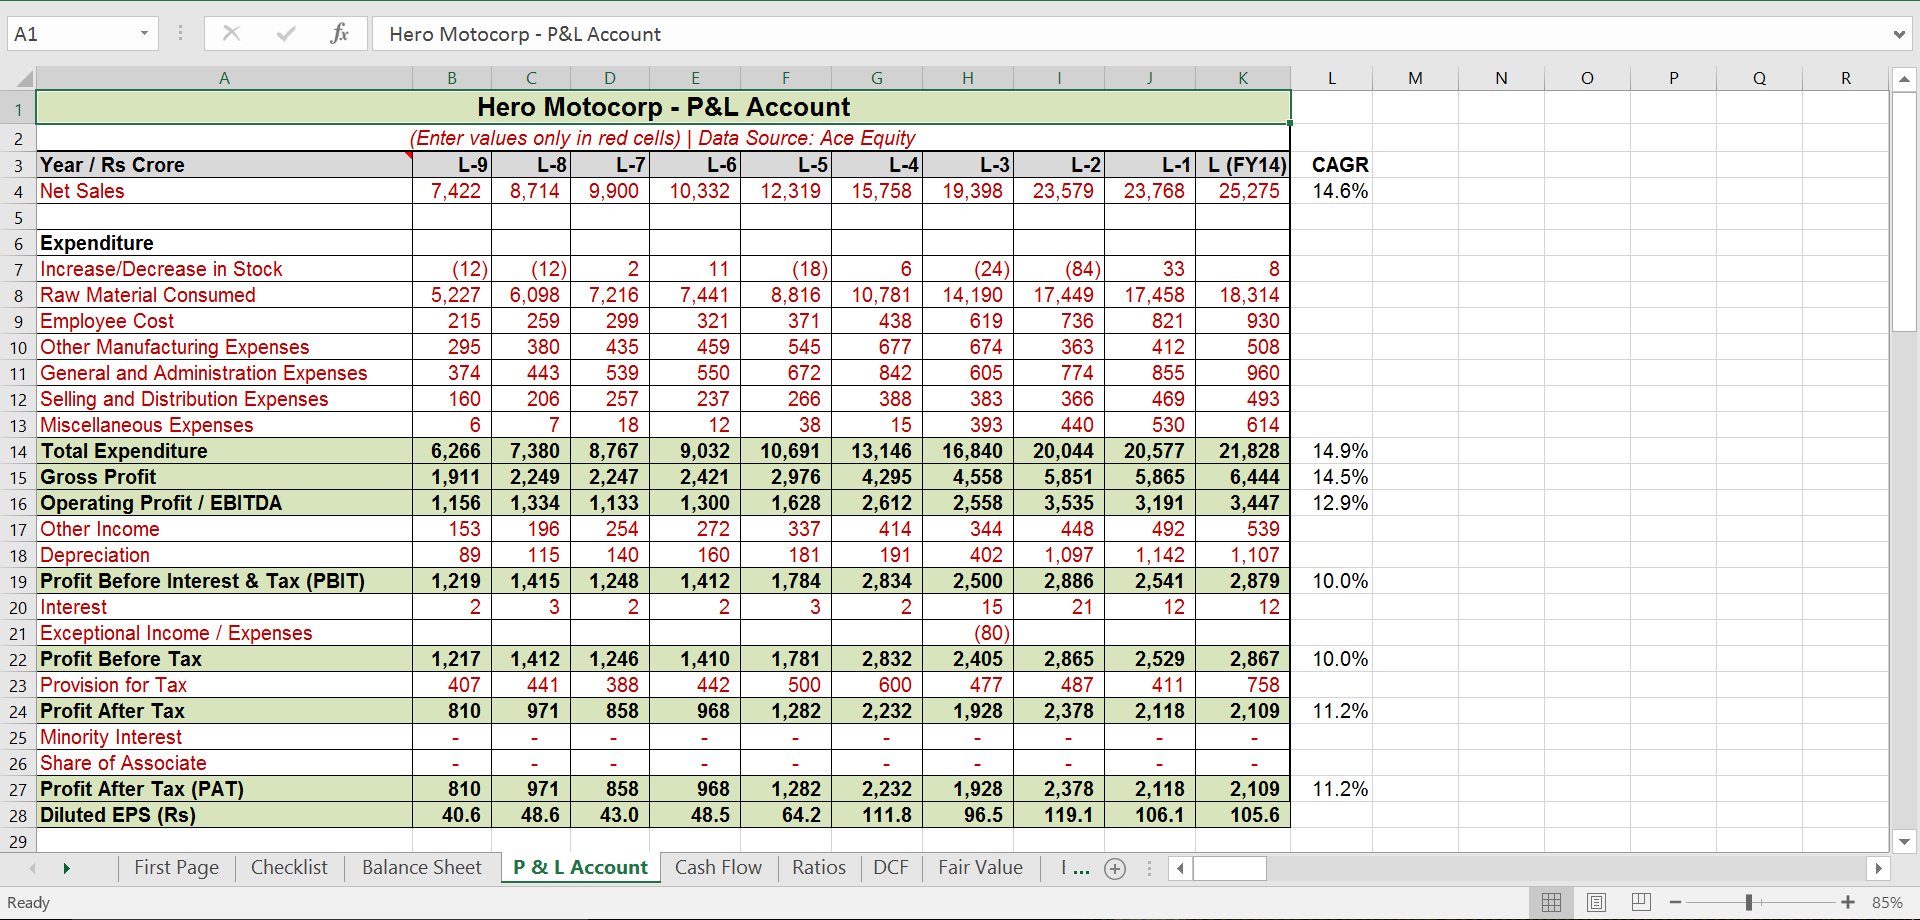
4) P&L Account: Enter the income statement numbers here (only the ones in red font).
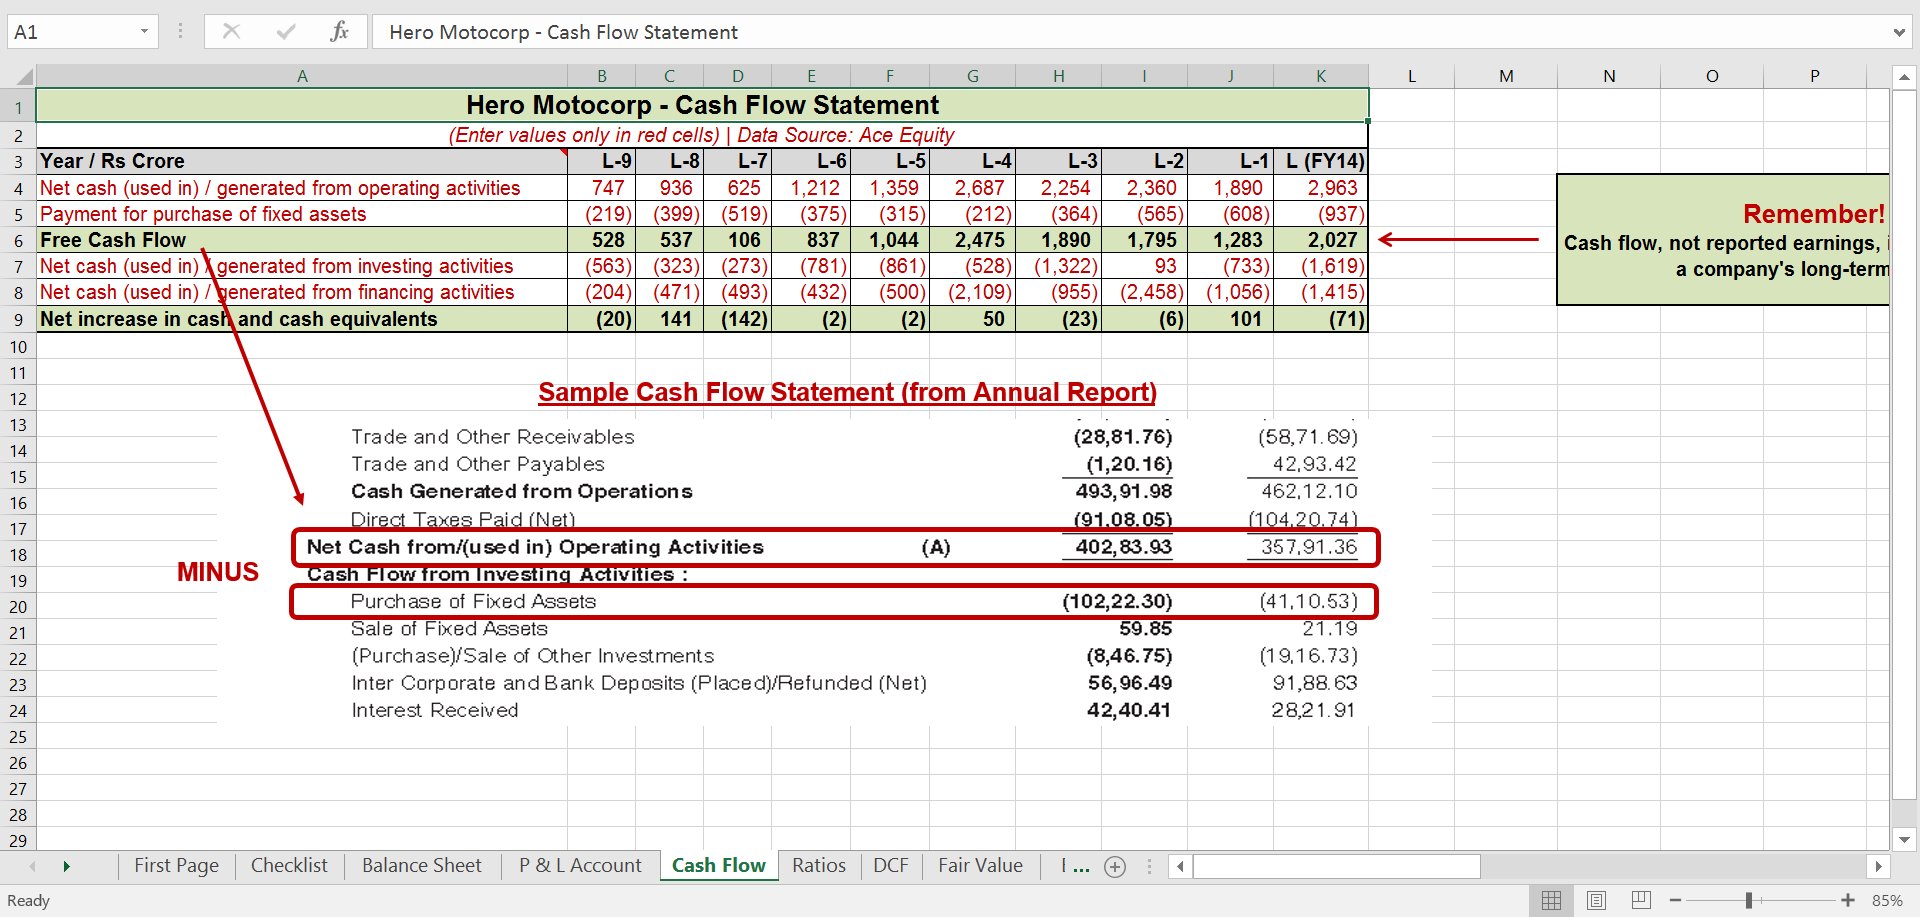
5) Cash Flow: Enter the cash flow numbers here, and also calculate the free cash flow (only the ones in red font).
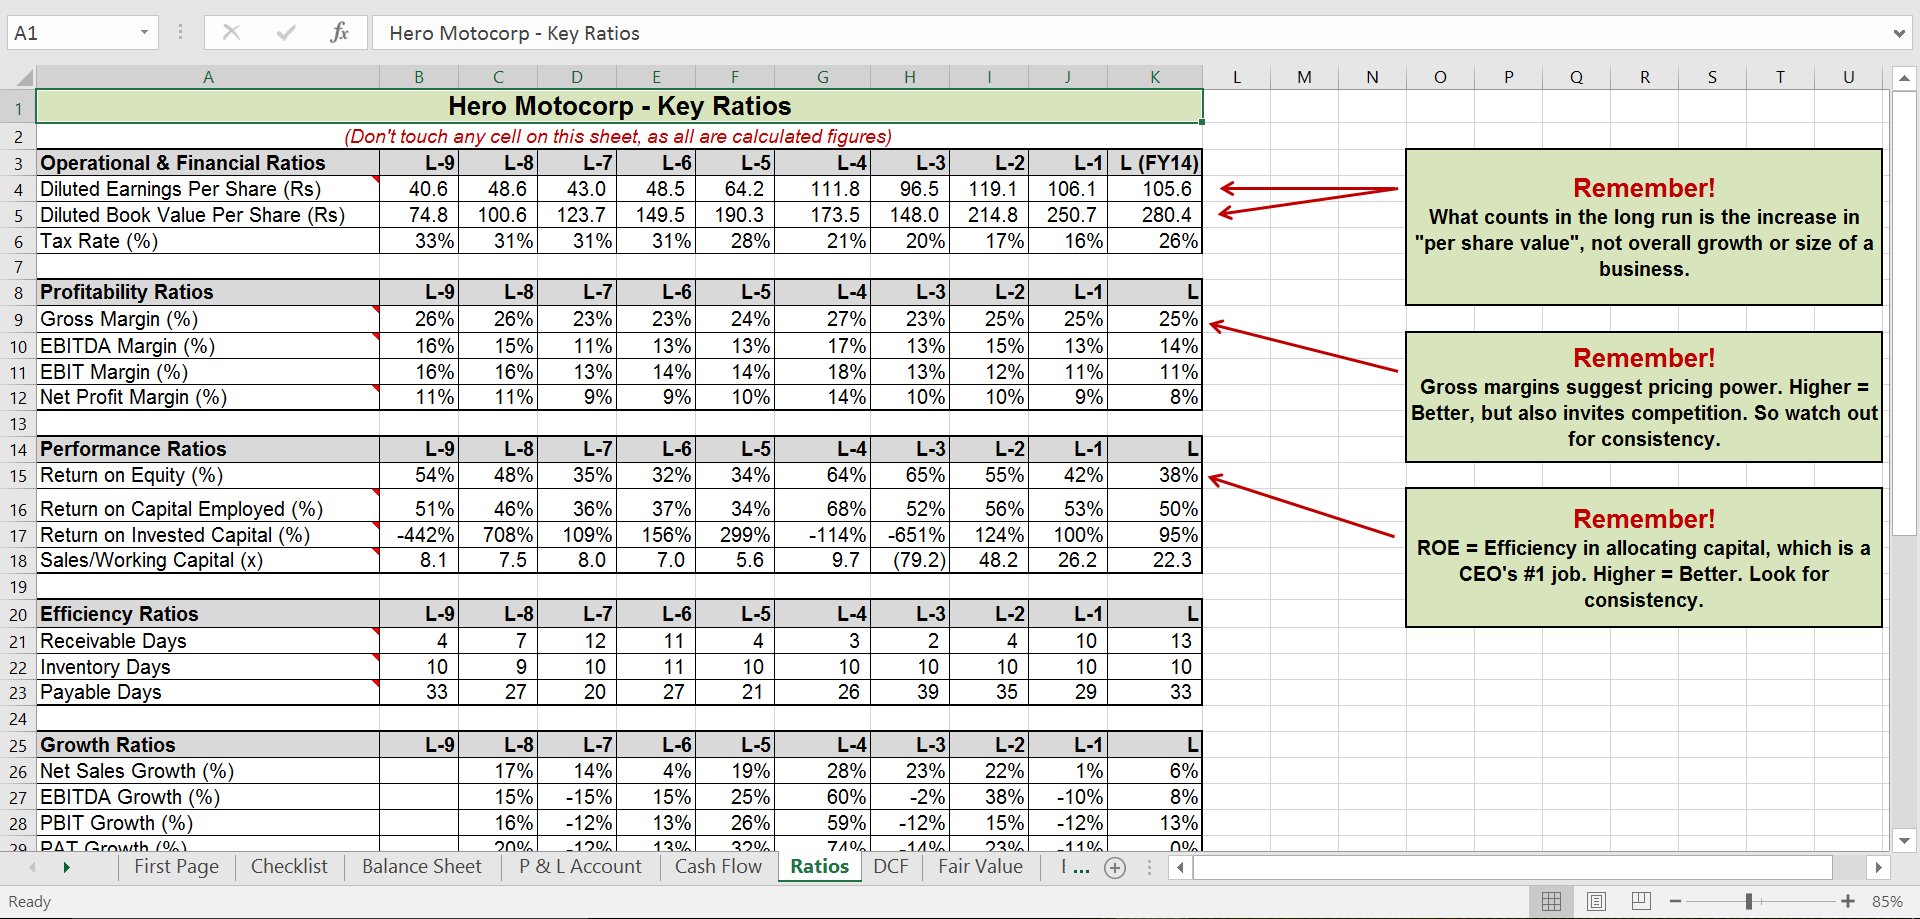
6) Ratios: All numbers in this sheet are automatically generated using the values you enter in the previous three sheets. Don’t touch a formula in this sheet, until you want to modify as per your own understanding. Most ratios here are already explained - just hover the mouse on a term to know its definition.
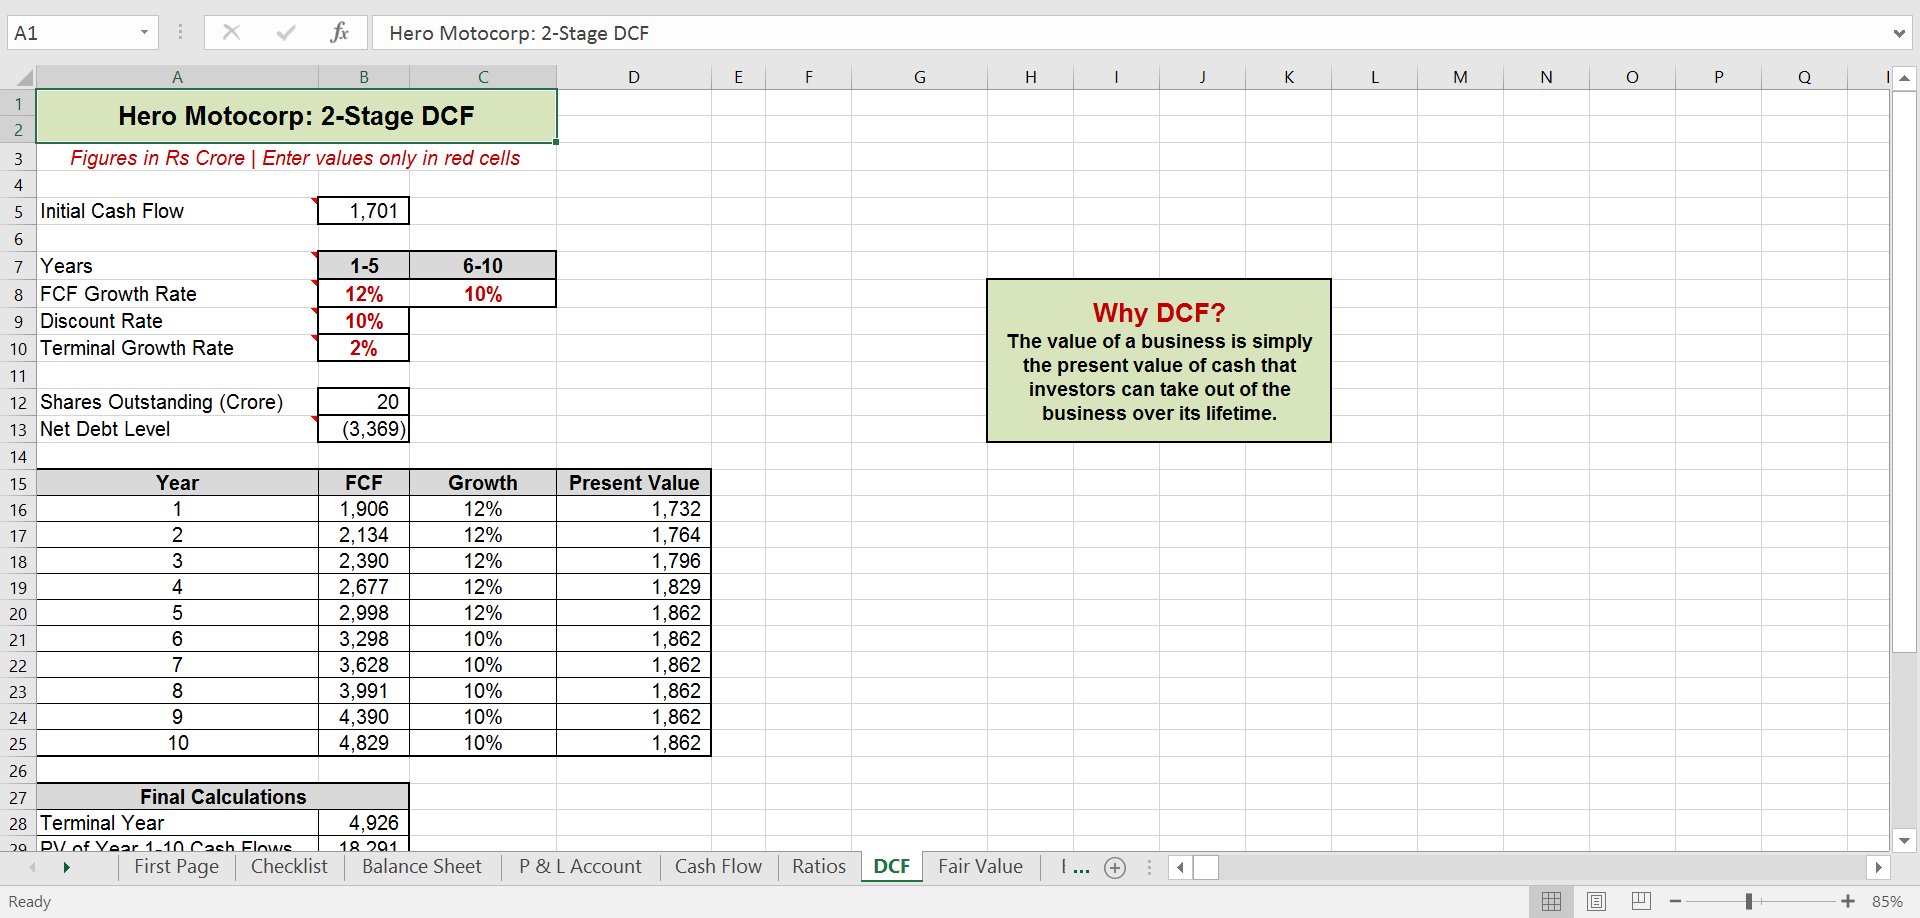
7) DCF: This sheet calculates the discounted cash flow or DCF-based intrinsic value of the stock, after you input some key numbers.
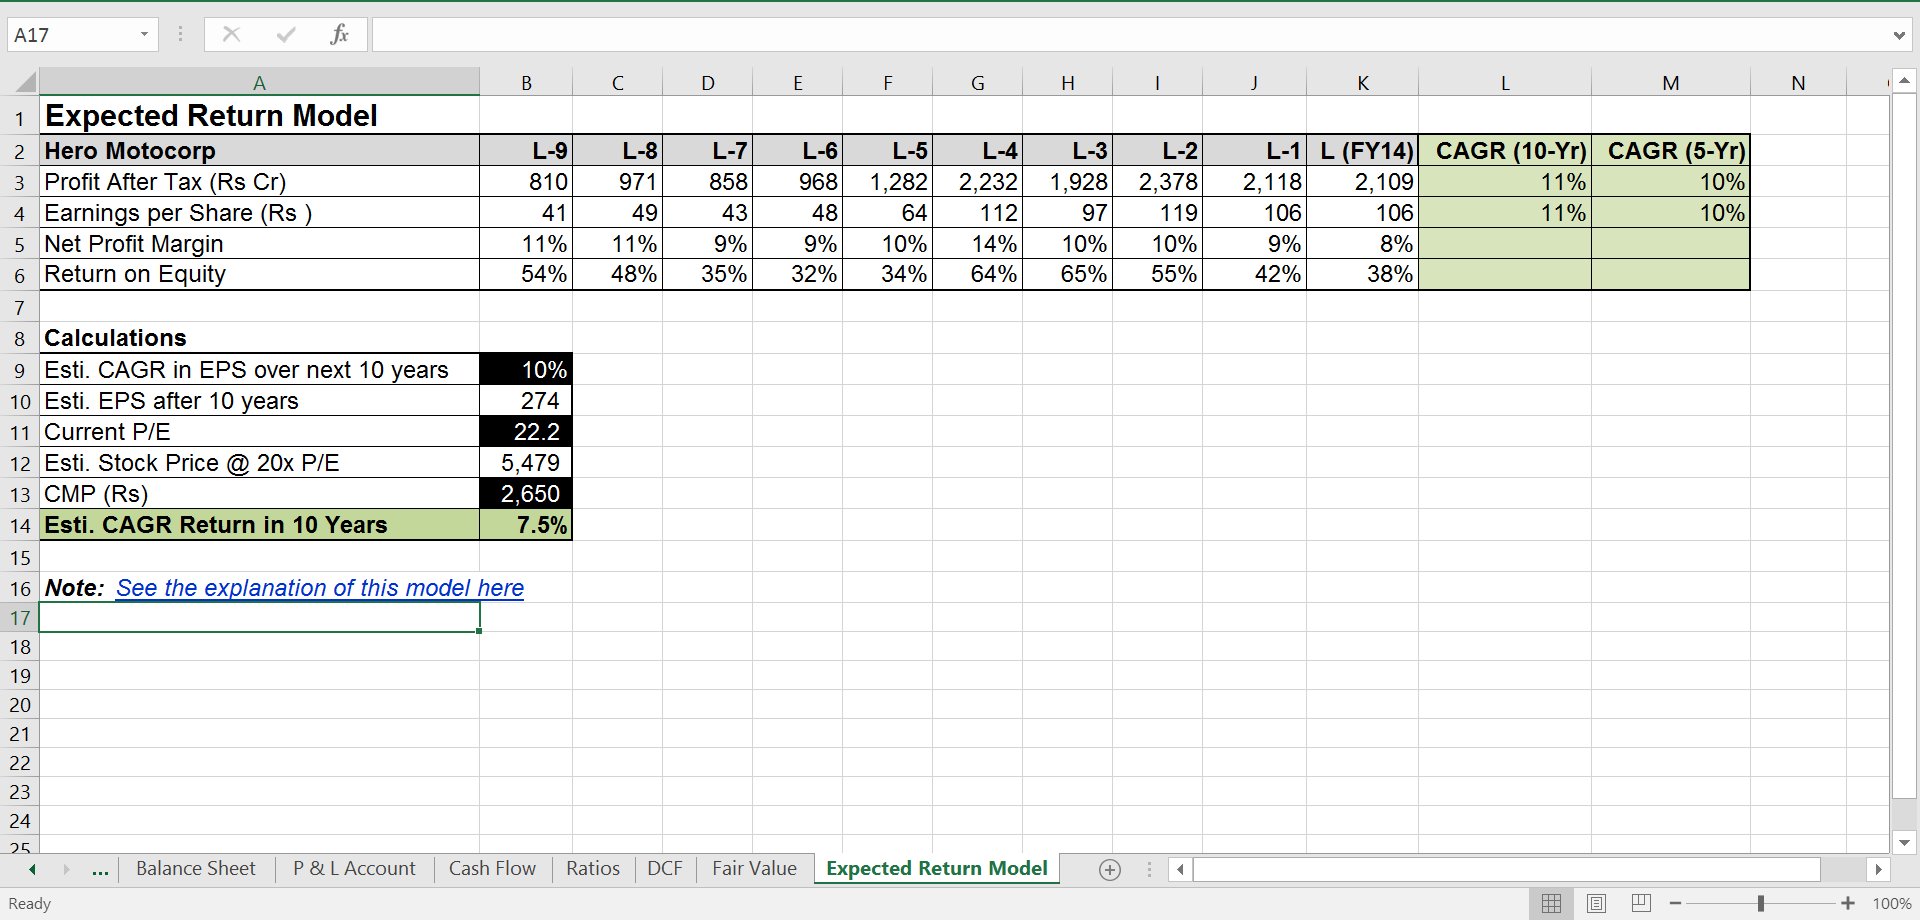
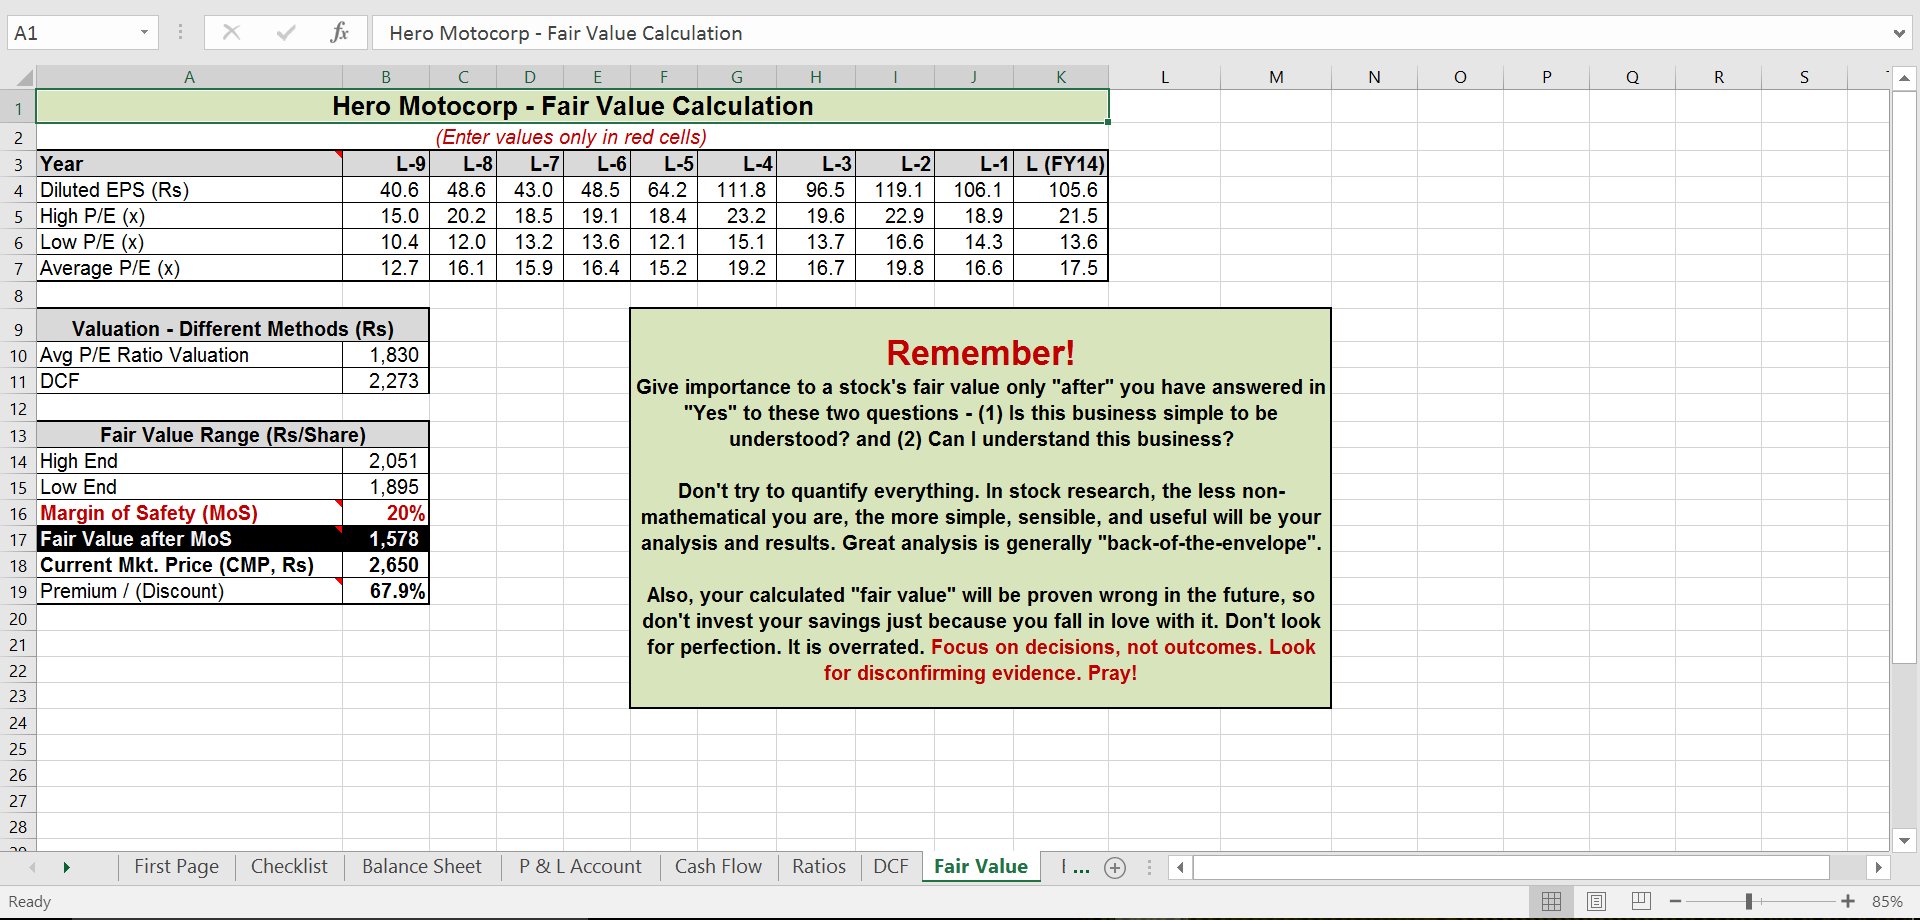
8) Fair Value: This is the final sheet, and shows you the fair value range of the stock based on all other sheets.
In all the sheets, just fill out the values shown in red font, while leaving every other calculation as it is.
You are looking for a simplified tool which can you can use quickly to aid your decision-making process
This model will not work for banking and financial services companies
