Originally published: 19/04/2018 15:11
Last version published: 21/06/2018 07:18
Publication number: ELQ-69648-2
View all versions & Certificate
Last version published: 21/06/2018 07:18
Publication number: ELQ-69648-2
View all versions & Certificate

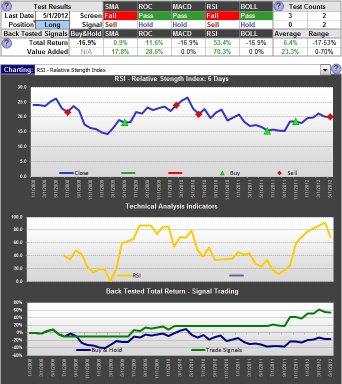
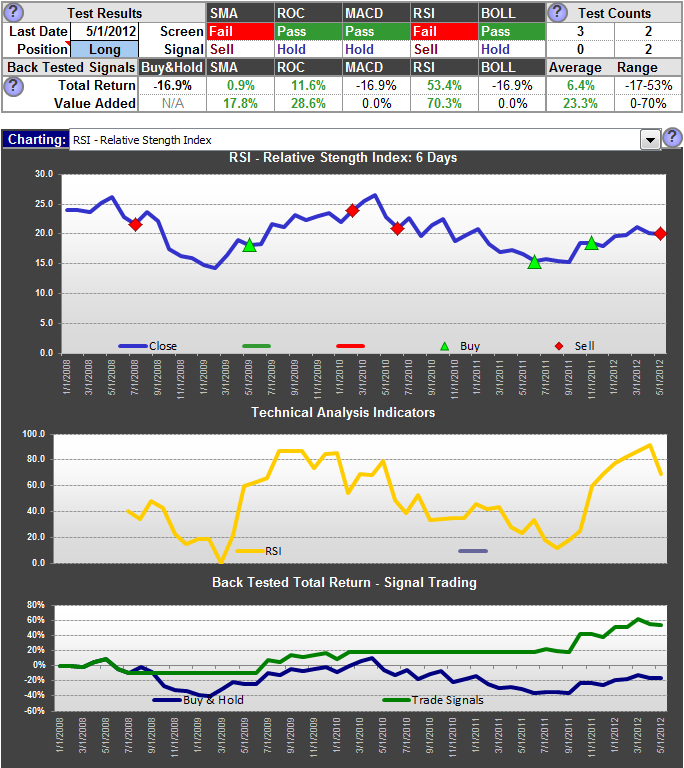
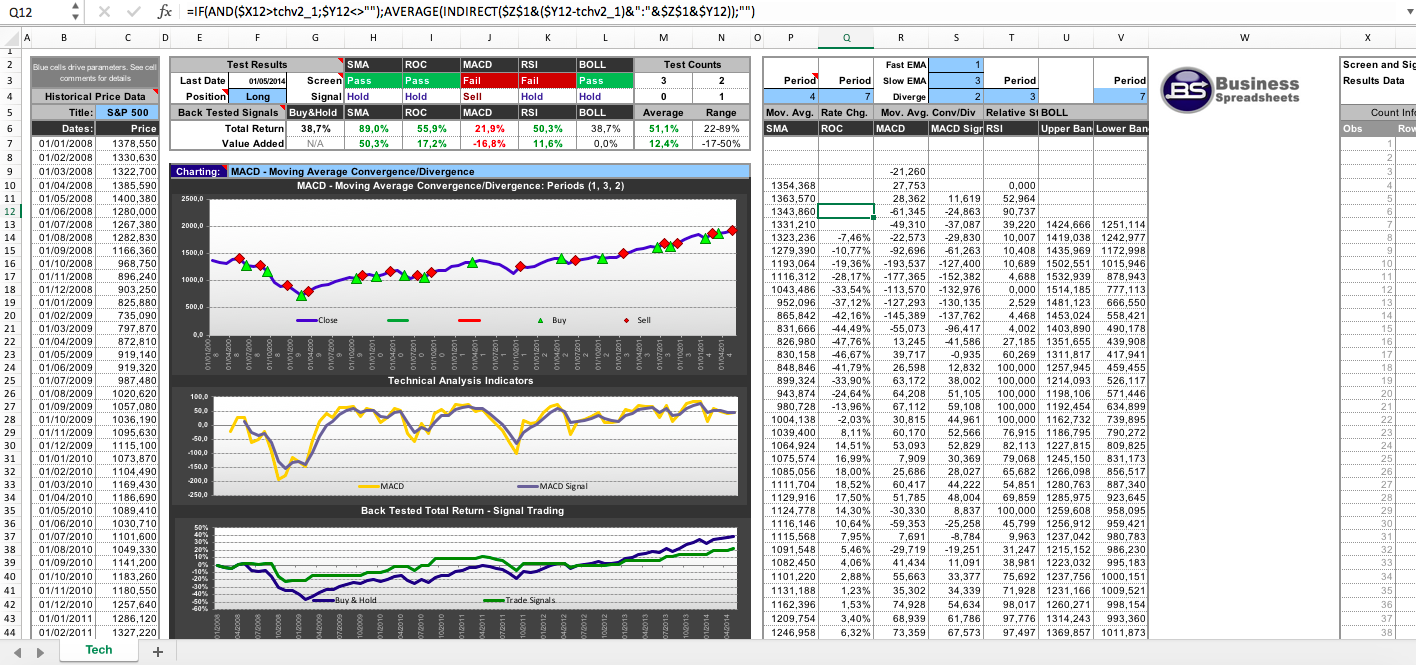
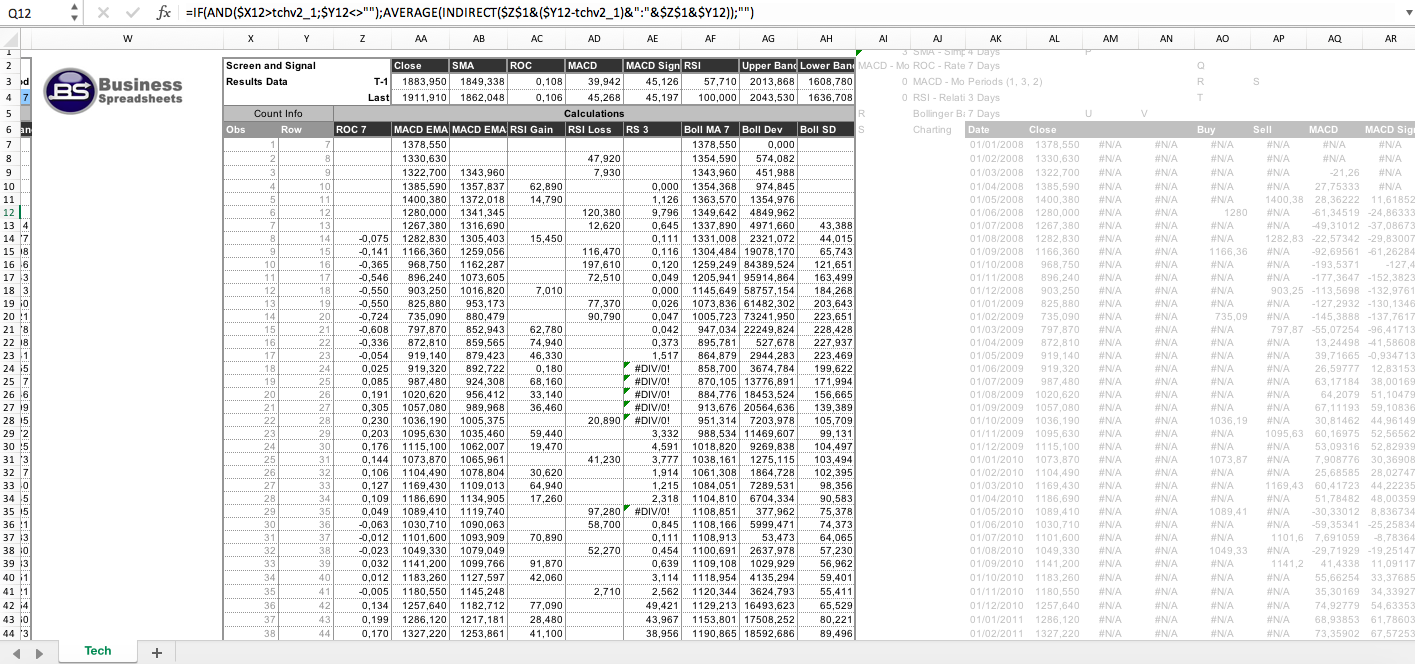
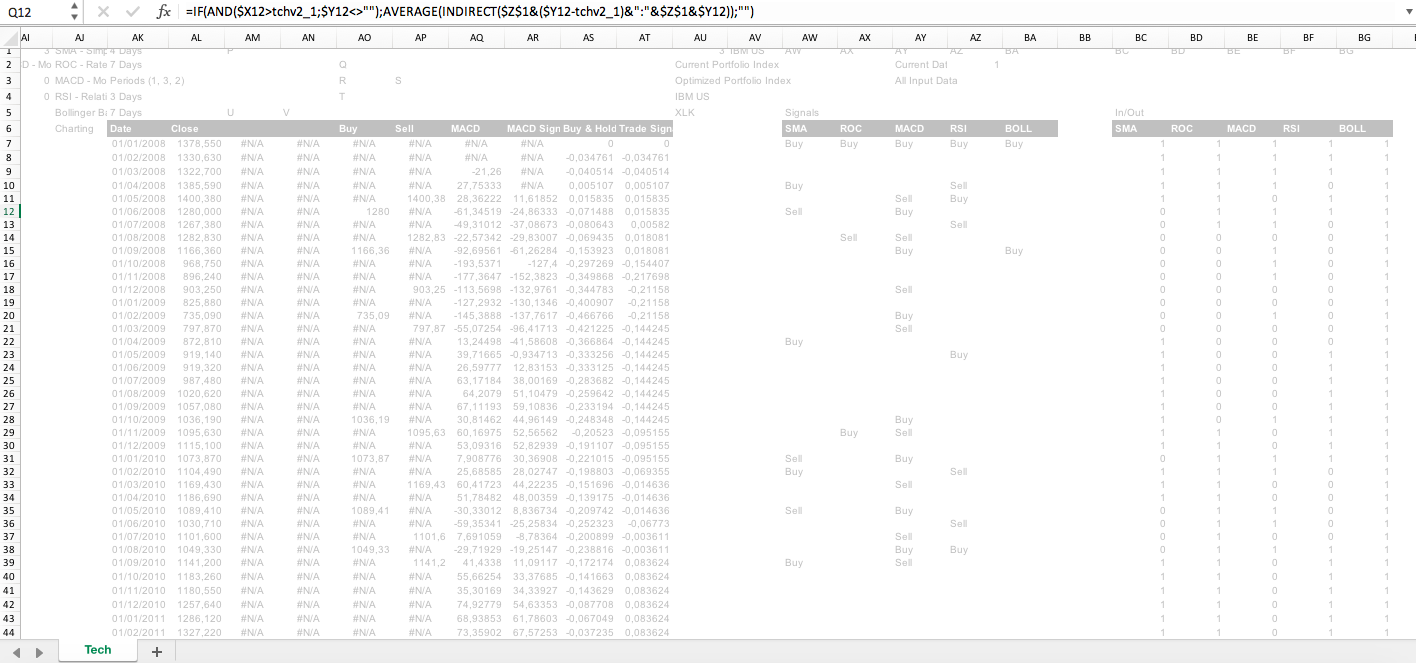
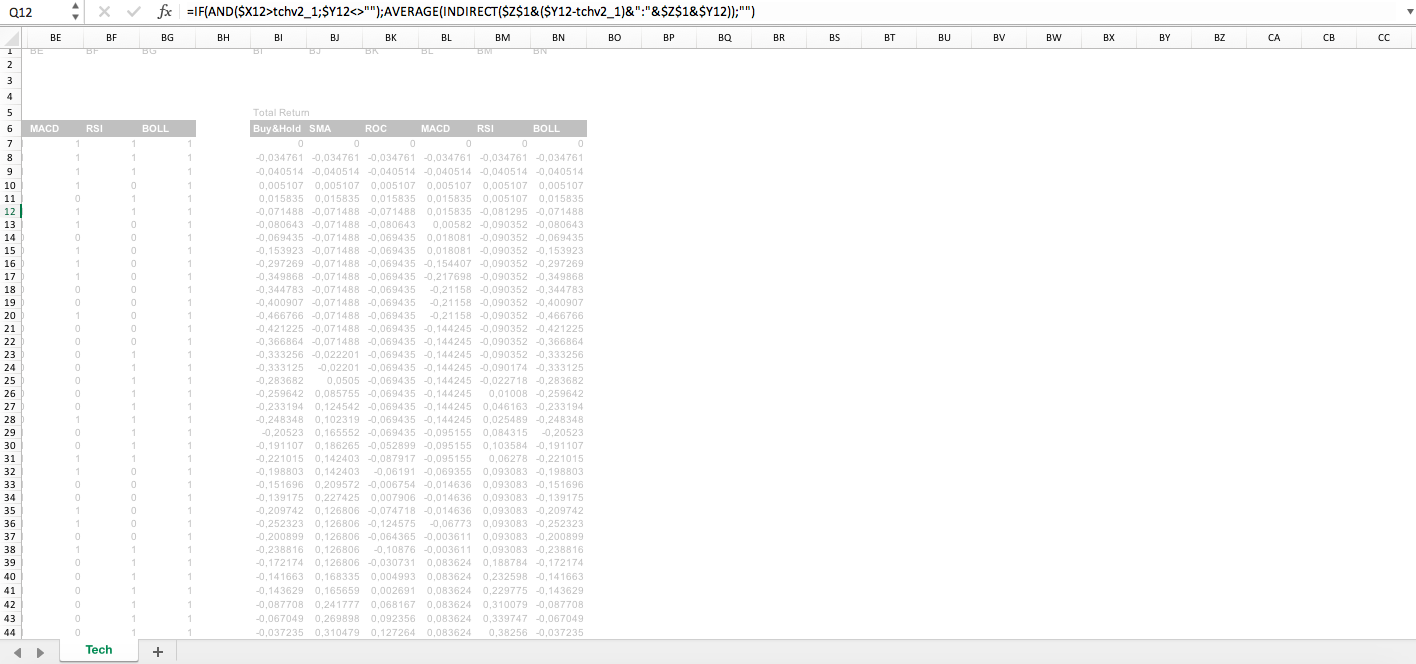
Technical Analysis Excel Template with Trading Strategy Back Testing
The technical analysis template provides analysis for SMA, ROC, MACD, RSI and Bollinger Band indicators
Purpose built Excel solutins for business and finanacial decision makingFollow 183
Business Spreadsheets offers you this Best Practice for free!
download for free
Add to bookmarks
Further information
Back testing technical indicator trading signals
Market data is already available for testing
Market data needs to be downloaded for analysis
