Last version published: 03/04/2017 10:30
Publication number: ELQ-26312-14
View all versions & Certificate

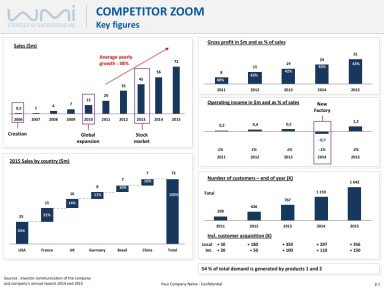
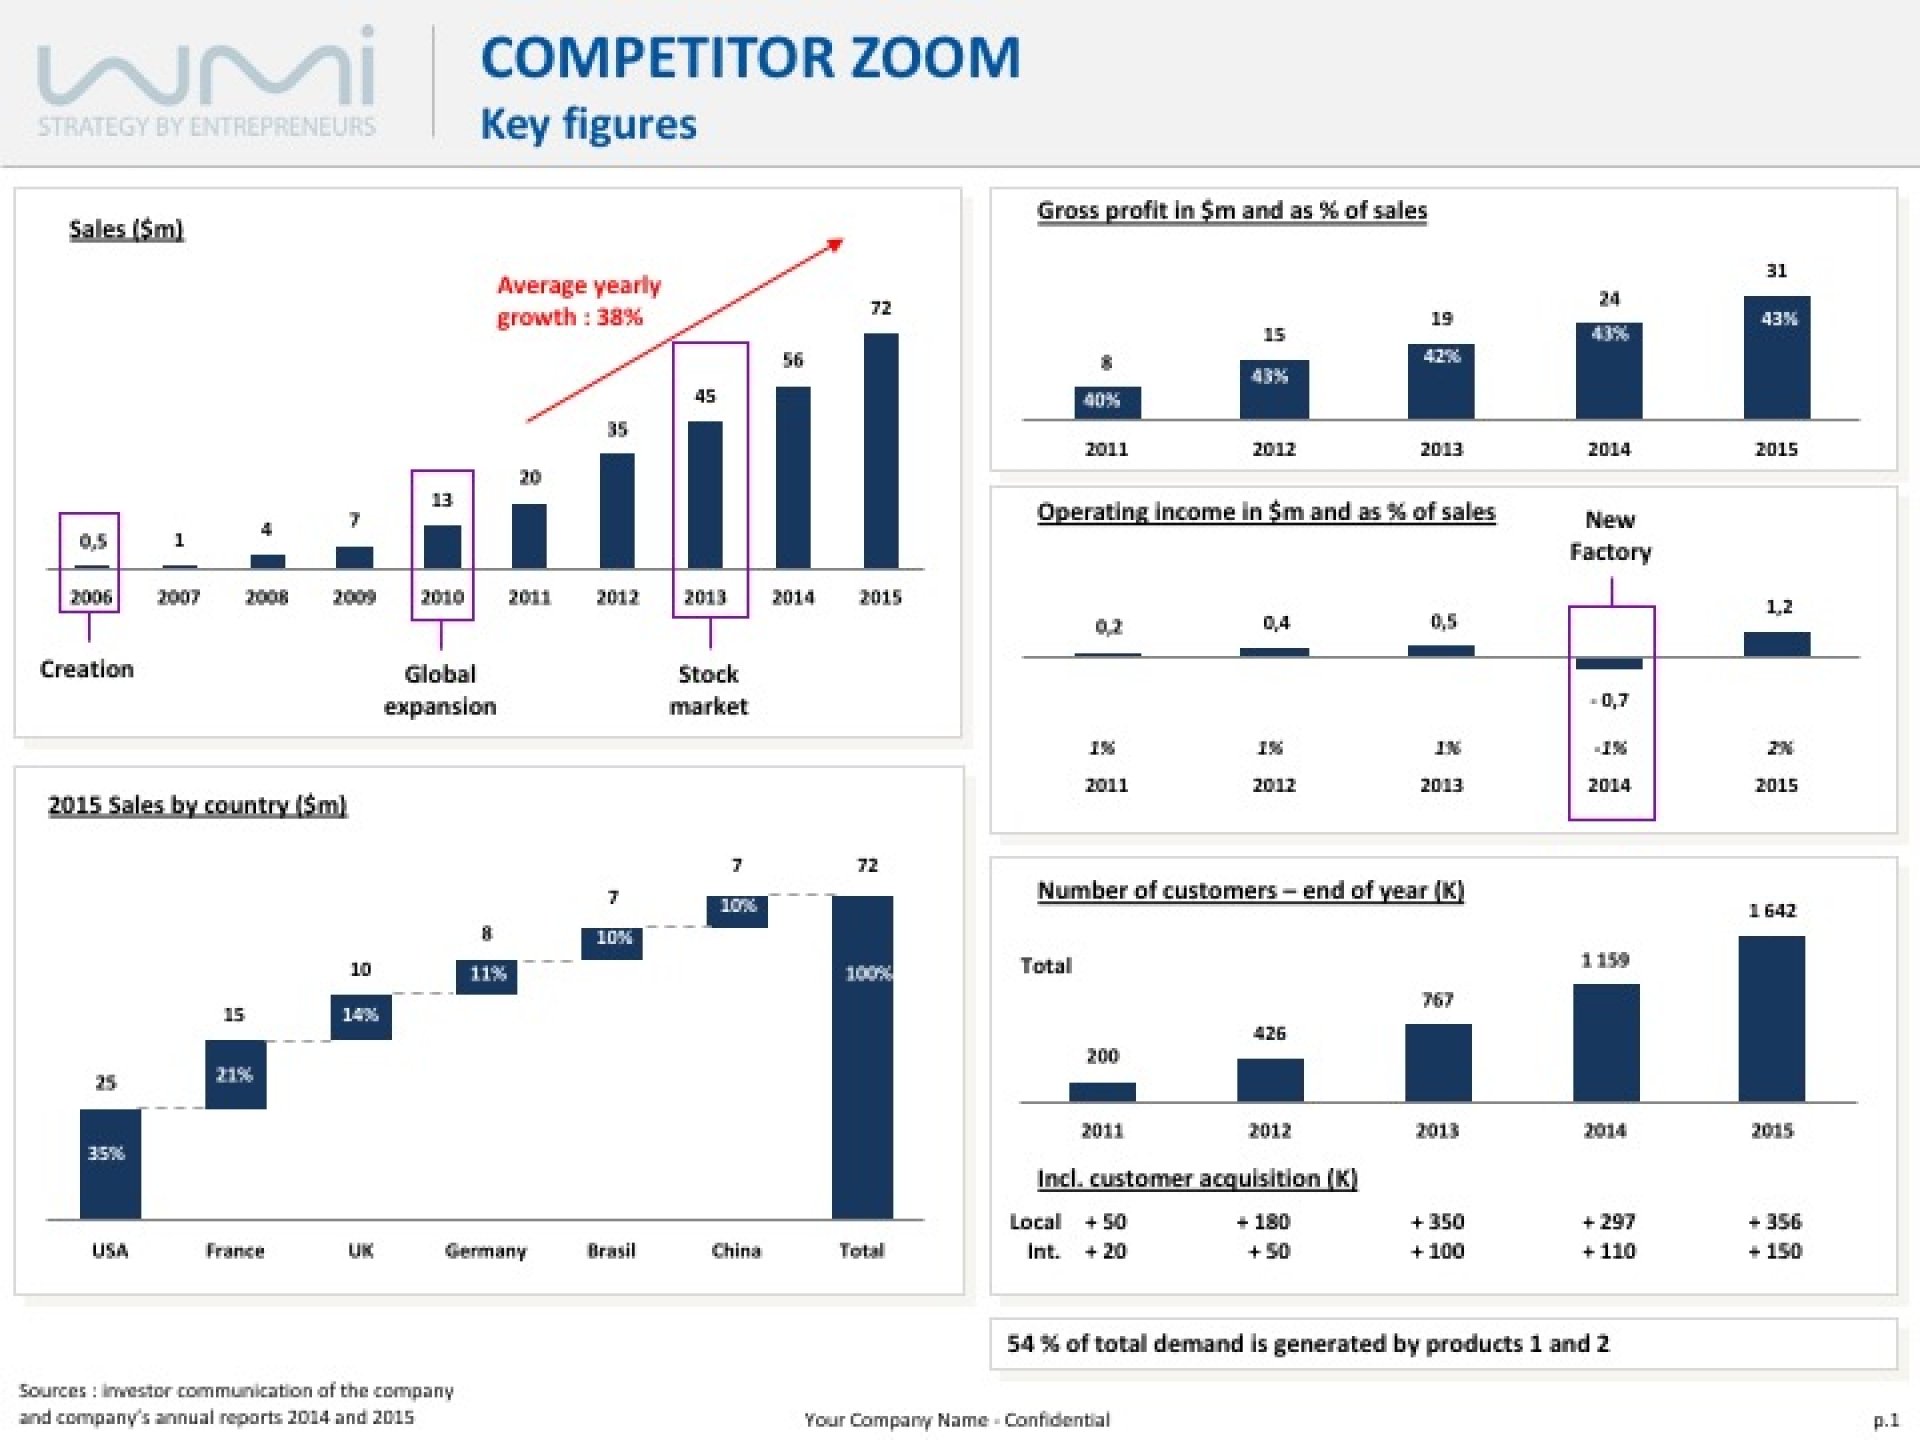
Competitor Key Figures
An overview of your competitor's main figures evolution through several graphs.
Deputy Director #MBADMB EFAP | Strategy consulting & marketing @AdVentures Startup Studio (incl. Wimi)Follow
Further information
Objectives:
- Give an overview of one of your competitors' main figures evolution.
- Use graphs to summarize all your competitor's key numerical data on a single page. The purpose of the slide is to create a single-page visual memo of a sole competitor's historical performance over the years. Condense several types of financial data that are often difficult to reconcile onto a single readable page.
Insert in:
• Market studies
• Benchmarks
• Strategic plans
• Due diligence
Main sources:
• Competitors’ publications: press releases, annual reports, corporate websites contents...
• Business press
• Existing reliable market studies (Markess, Xerfi, Reuters, MarketResearch, HBR…)
• Your own market watch tools
• You wish to provide all of your competitor's key figures on a single page
• You wish to give a dynamic visual of your competitor's business evolution
• You wish to focus only on the most pertinent financial figures
• You want to provide an in-depth look at your competitor's strategy (see other WMI competitor zoom slides)
• You wish to present information other than financial data
• You want to address the performance of several competitors simultaneously
• You do not have access to accurate figures for your competitor
