
Last version published: 06/02/2023 10:54
Publication number: ELQ-62427-3
View all versions & Certificate

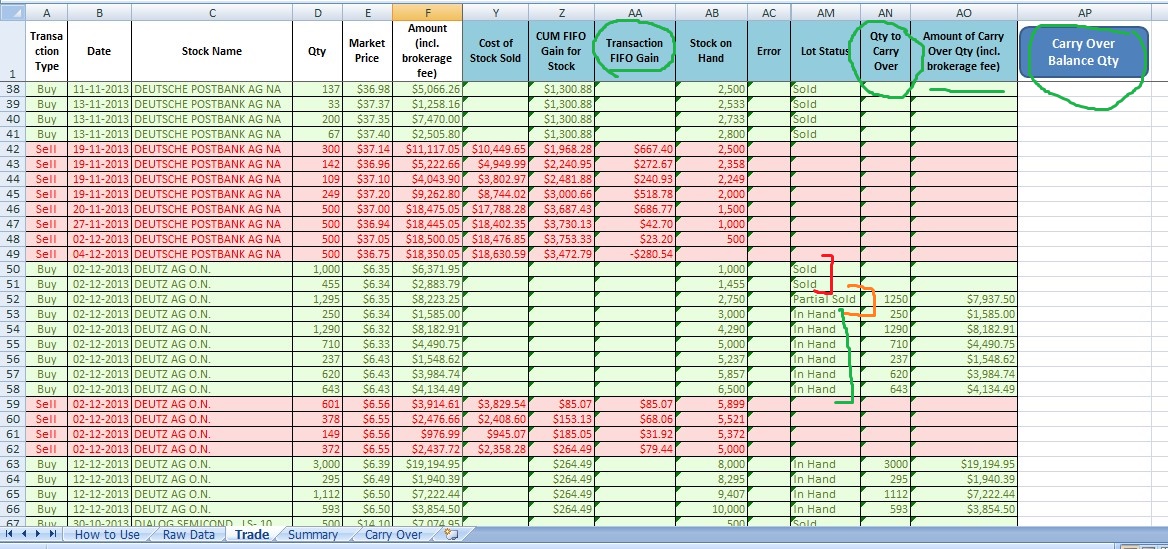
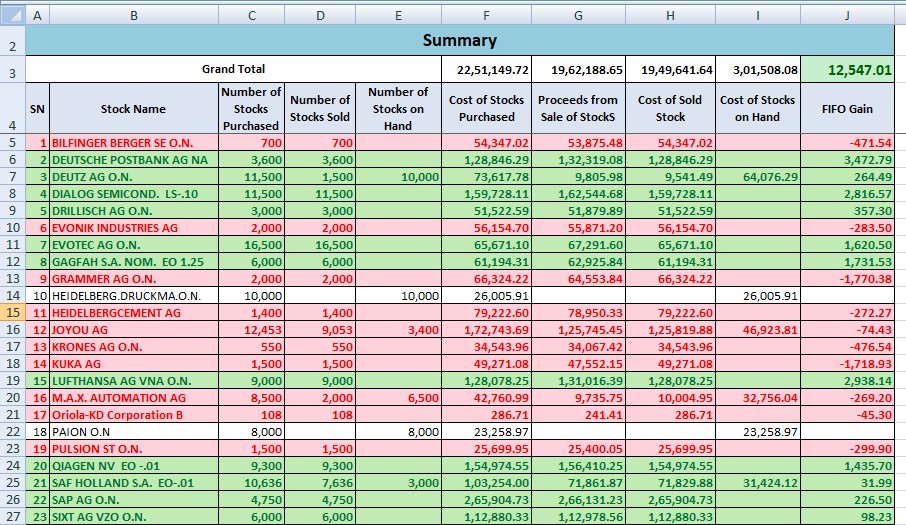
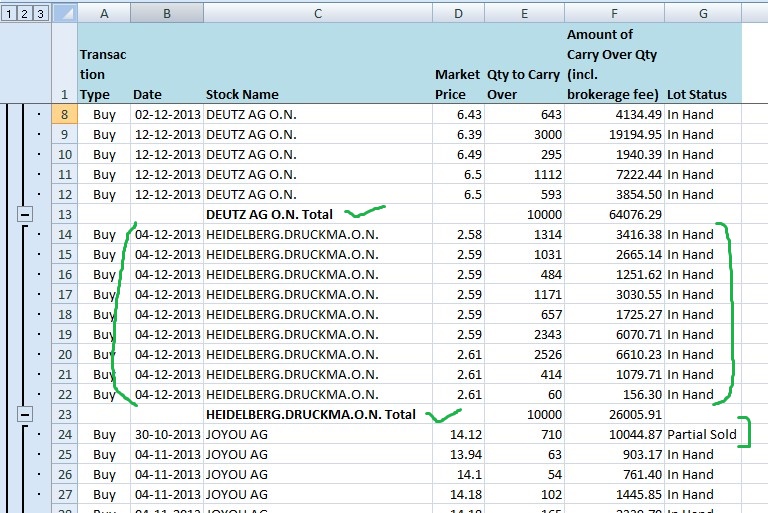
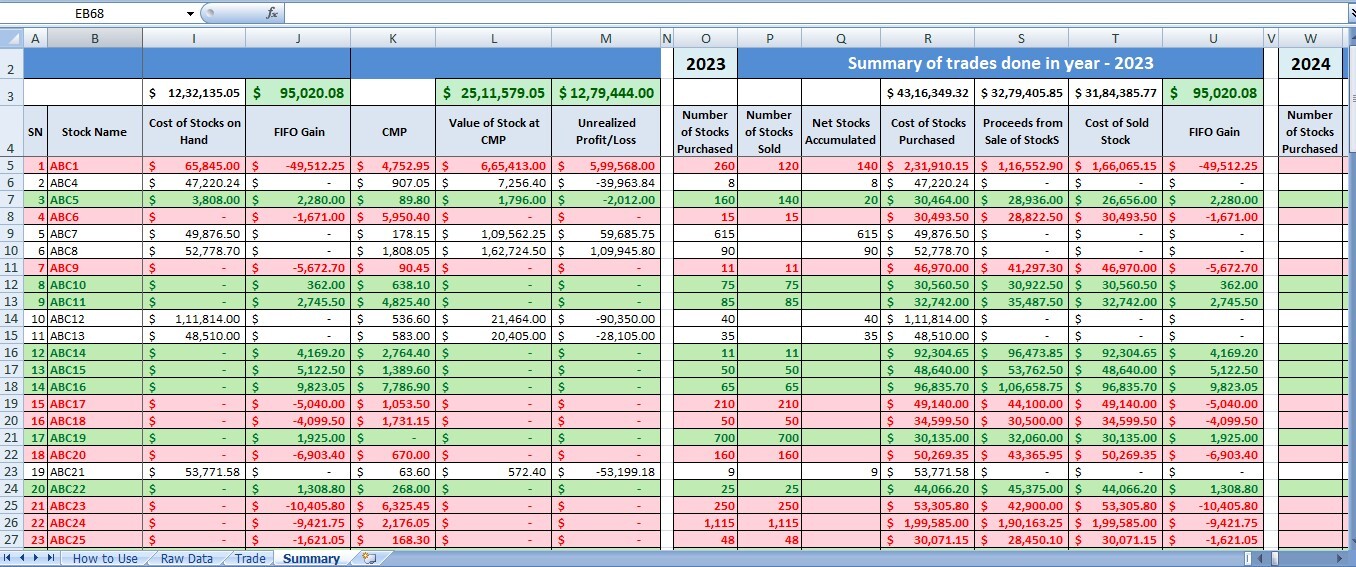
Multiple Equity Stocks Trading FIFO Gain Excel Calculator
Easy-to-use Excel calculator for calculation of profits in equity stocks trading using FIFO method for multiple stocks with Carry Over Option.
Description
How to input data:
1. Enable Macro while opening the file, if you want to use Carry Over option.
2. You will just have to put your trading details i.e. Transaction Type, Date/Time of Transaction, Stock Name/Symbol, Quantity, and Amount etc. in columns A:F in Trade sheet. Prepare transaction data for your trades in similar format/layout as shown in Raw Data Tab. Data must be in sorted order by (Stock Name -> Date -> Transaction Type)
3. Copy the raw data and paste it in columns A:F in Trade Sheet without any formatting using Paste Special (Values) option. Columns G:AO in Trade sheet contain formulas, please do not edit or delete them.
4. If you want to carry over the balance quantity in hand as next year's opening balance, then click on Carry Over Balance Qty button in cell AP1 in Trade sheet. It will run a macro to carry over the balance quantity in hand to the Carry Over sheet. You can use this balance quantity/data as your opening balance for the next year.
Raw Data sheet:
Raw data sheet has no formulas. It is just to show the format/layout in which transactions data need to be prepared for processing.
Quantity and Prices for all the transactions should be written as positive numbers.
Market Price is just for your reference. Trade sheet only uses Quantity and Amount (Column D and F) for calculations.
Trade sheet:
When you input raw data in Trade sheet, formulas will automatically calculate FIFO gains and other important data for every transaction in separate rows. You will see Gain/Loss after every sell transaction on FIFO basis in column AA. Besides this, spreadsheet will also show you other important data e.g. Cumulative Cost of Stock Purchased, Cumulative Proceeds from Sell of Stock, Number of Stocks Purchased/ Sold /In Hand after every transaction. This sheet is ready to process 3000 transactions (which can be easily extended as per your requirement).
In order to help you identify some data entry mistakes, Trade Sheet highlights relevant cell in RED in following cases:
1. If a cell in Column D (Qty) has a negative value.
2. If a cell in Column F (Amount) has a negative value.
3. If a sell transaction for any stock has a higher value of Sell quantity (column D) than it's Quantity in hand (column AB for its previous transaction).
4. If a date value for a buy/sell transaction for any stock is earlier than the date entered in its previous row for the same stock in column B.
Summary sheet:
Summary sheet displays stock-wise summary of all the trades for up to 100 different stocks (which can be easily extended as per your requirement). It shows Number of Stocks Purchased/Sold/In Hand, Cost of Stocks Purchased/ Sold/In Hand, Proceeds from Sale of Stock, FIFO Gain, for every stock in separate rows and Total of all trades above the table headings.
Carry Over sheet:
Carry Over sheet is auto populated by running a macro from Trade sheet. It shows the stock in hand after all Sell transactions in Trade sheet. This data can be used as opening stock quantity for the next year.
It shows Subtotals for each equity stock. If you want to hide these Subtotals, you can do it by going to Data > Subtotal > Remove All option in Excel tool bar.
Please let me know if you have any question or suggestion to improve this template.
This Best Practice includes
1 Excel Sheet
Further information
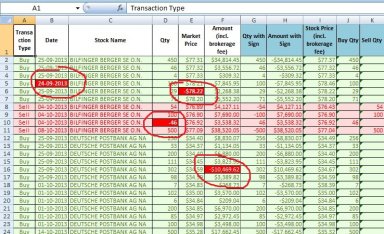
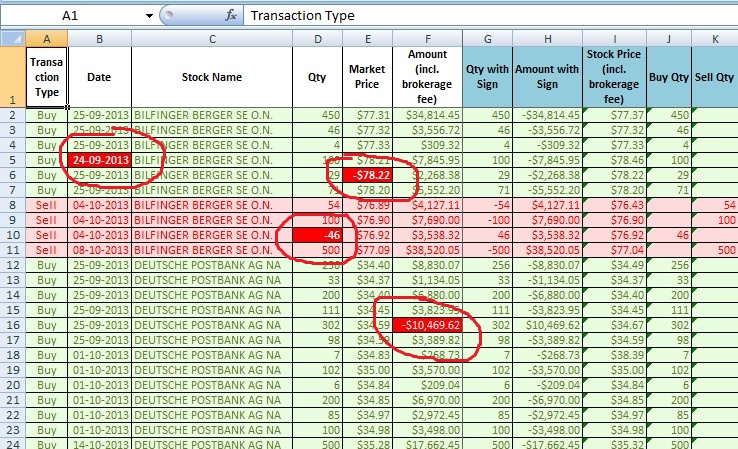
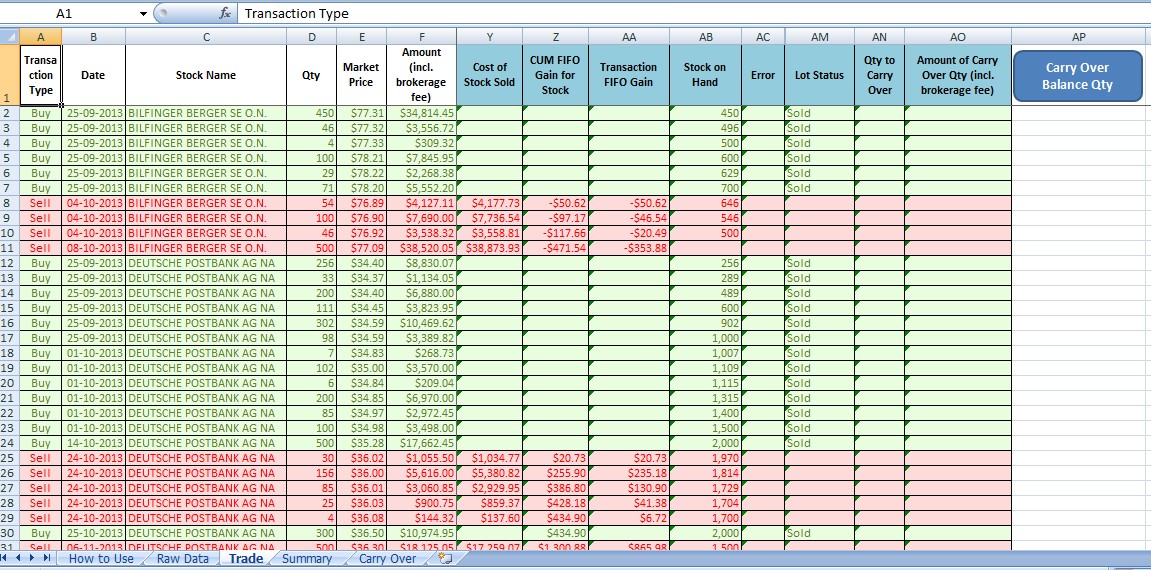
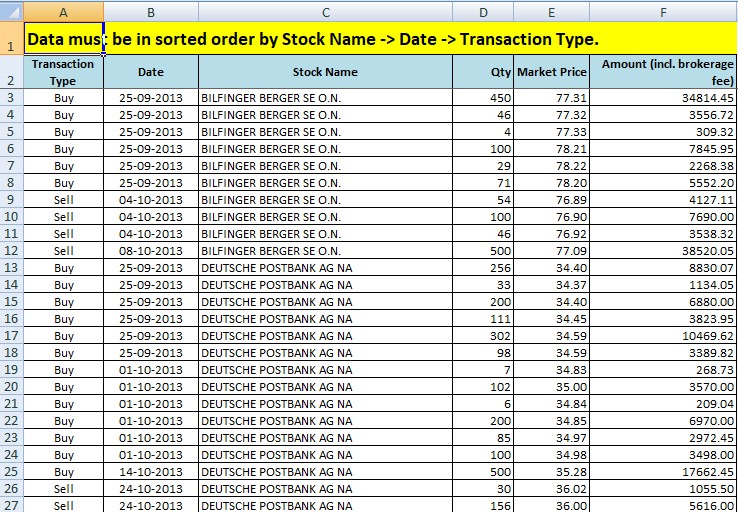
Calculation of trading profits with carry over option for multiple equity stocks using FIFO method