

Originally published: 07/04/2020 16:18
Last version published: 07/04/2020 17:45
Publication number: ELQ-51994-2
View all versions & Certificate
Last version published: 07/04/2020 17:45
Publication number: ELQ-51994-2
View all versions & Certificate

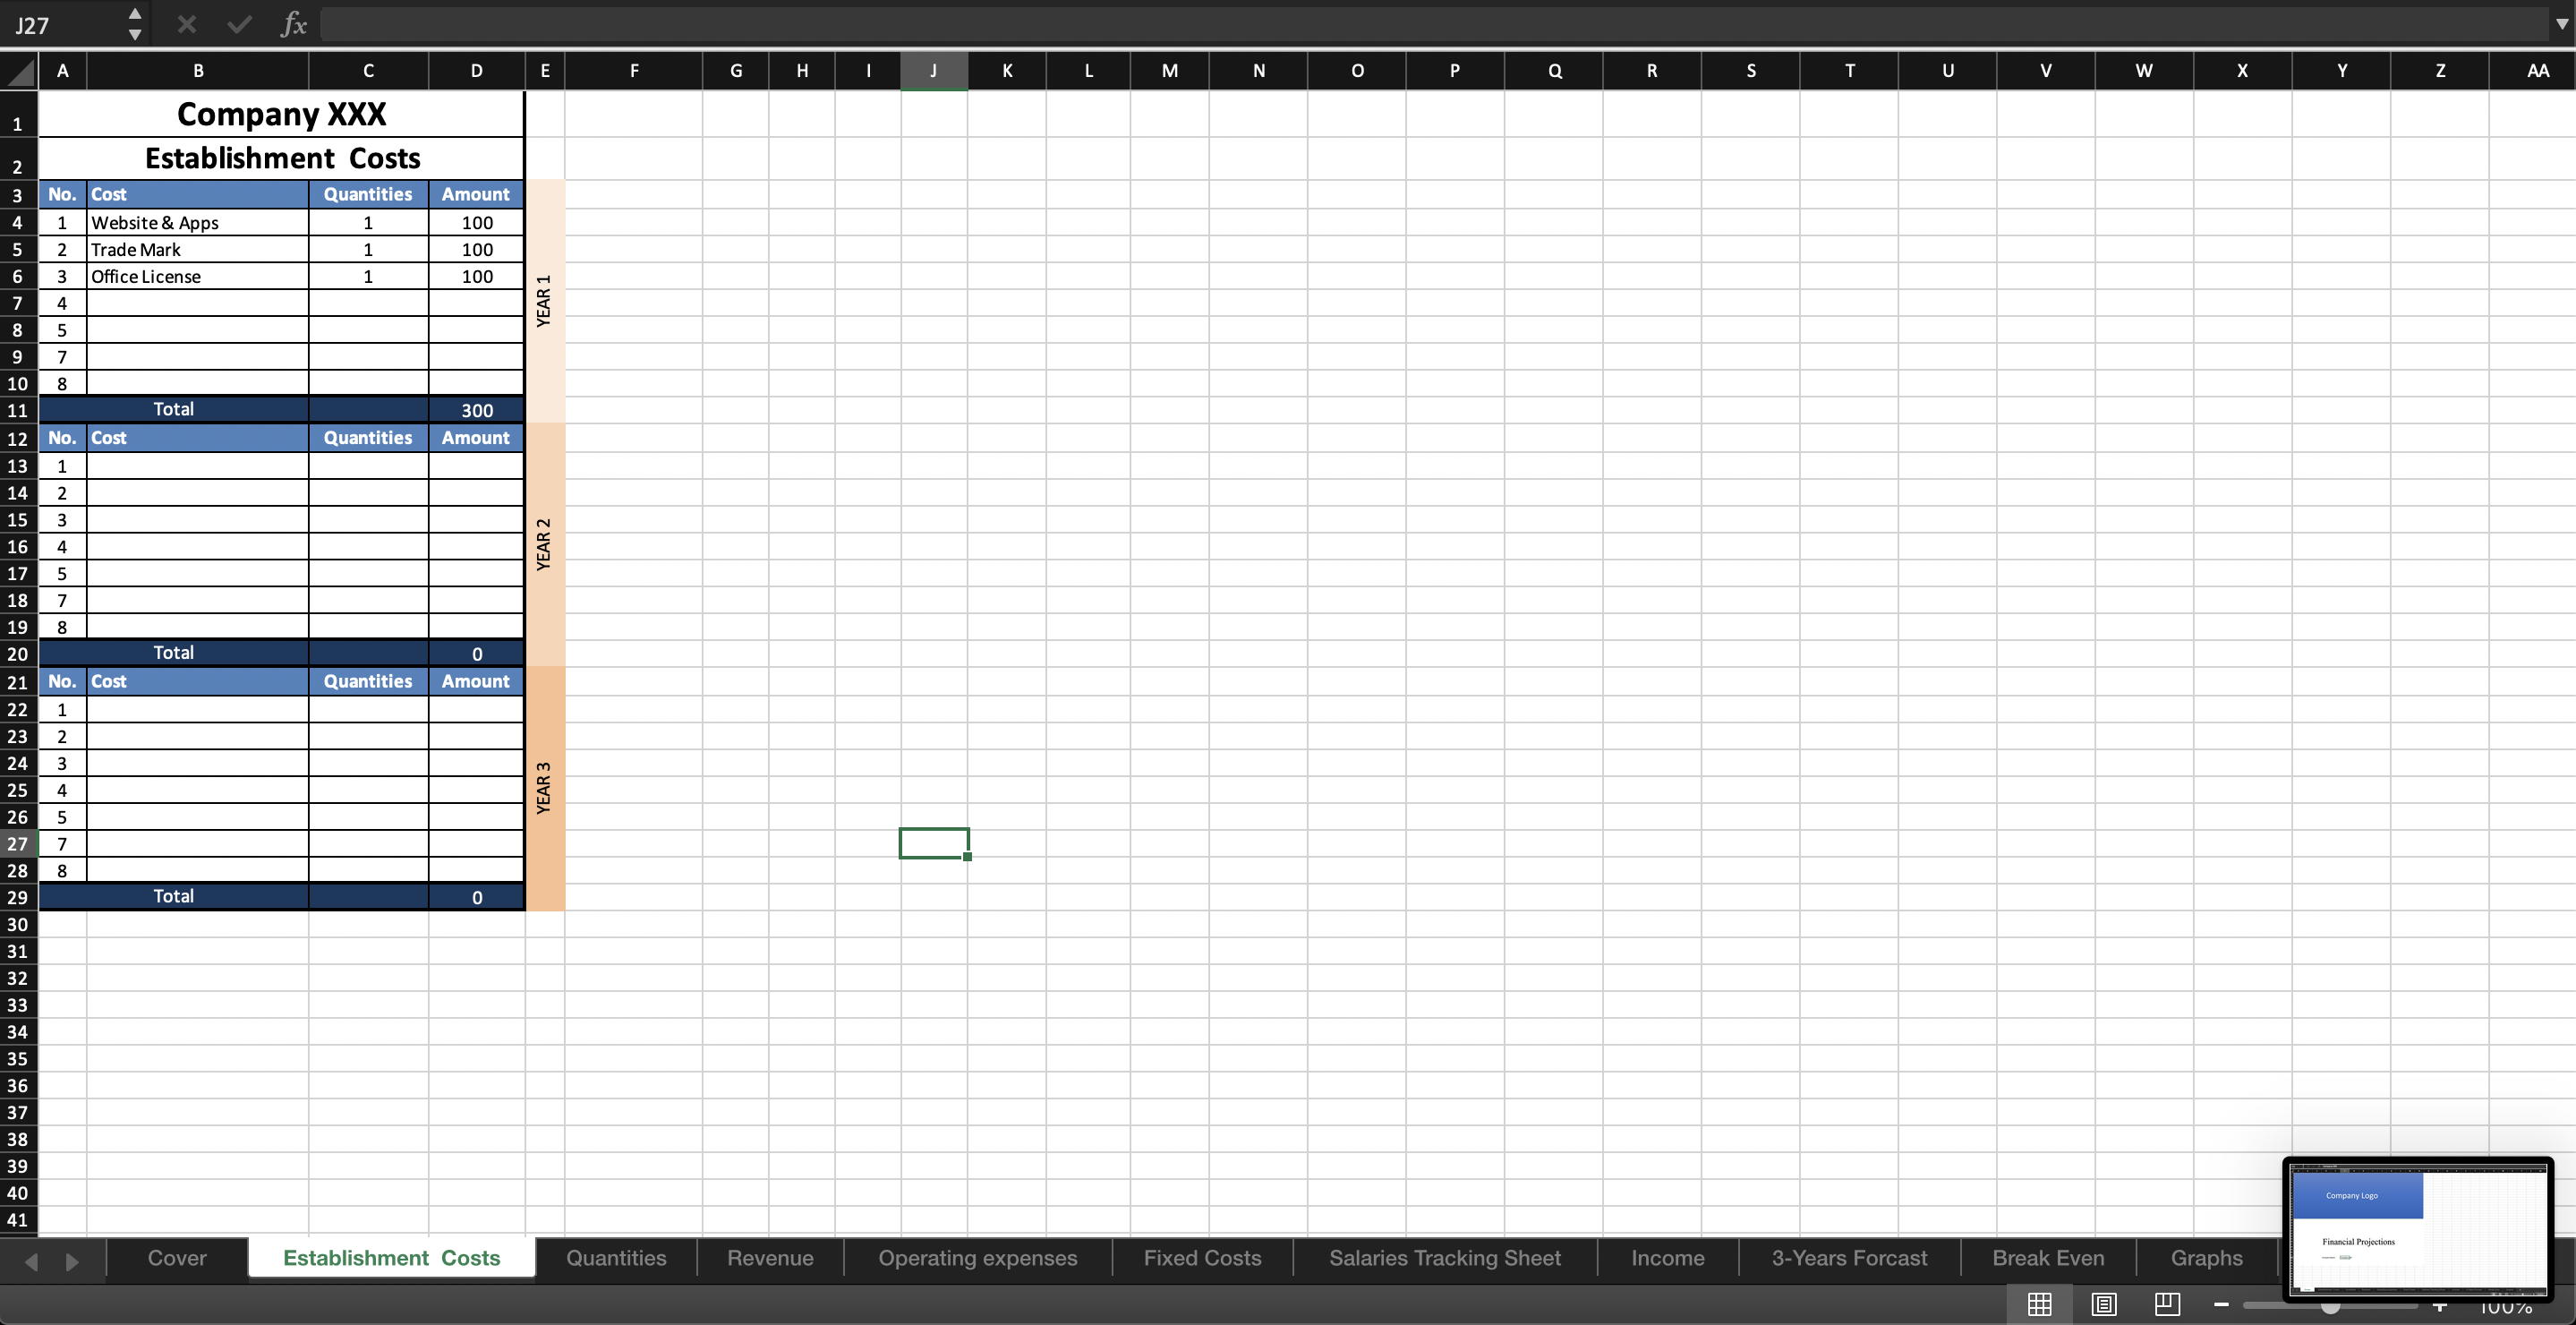
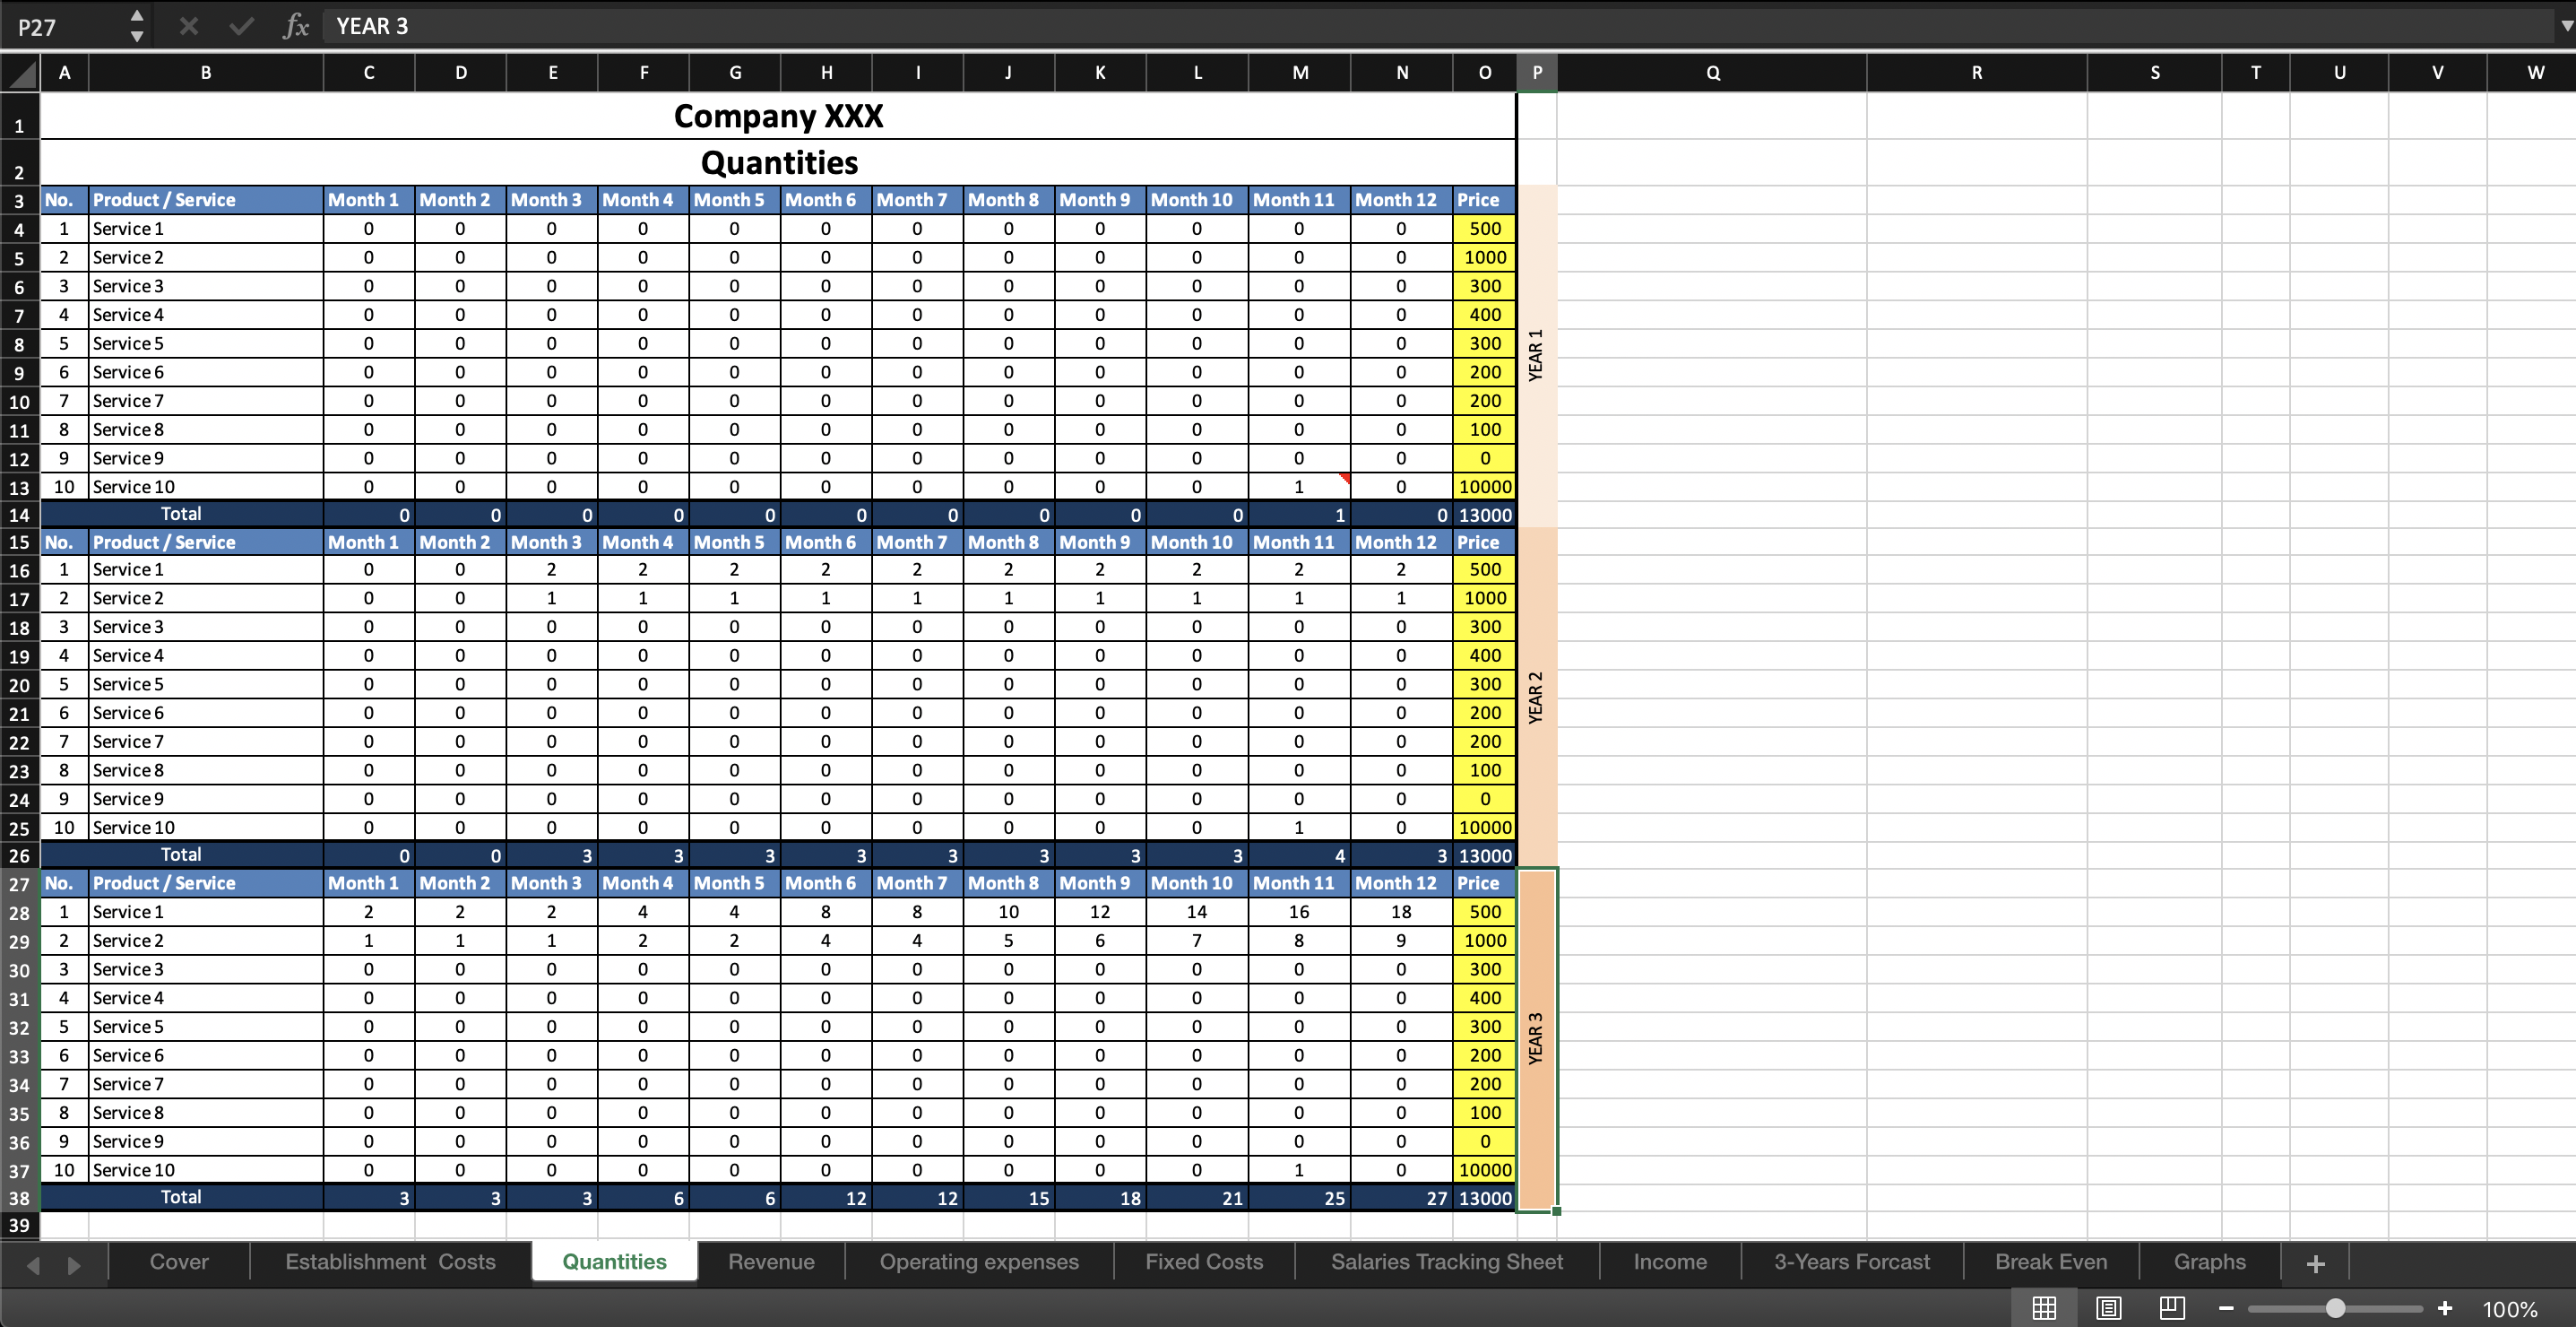
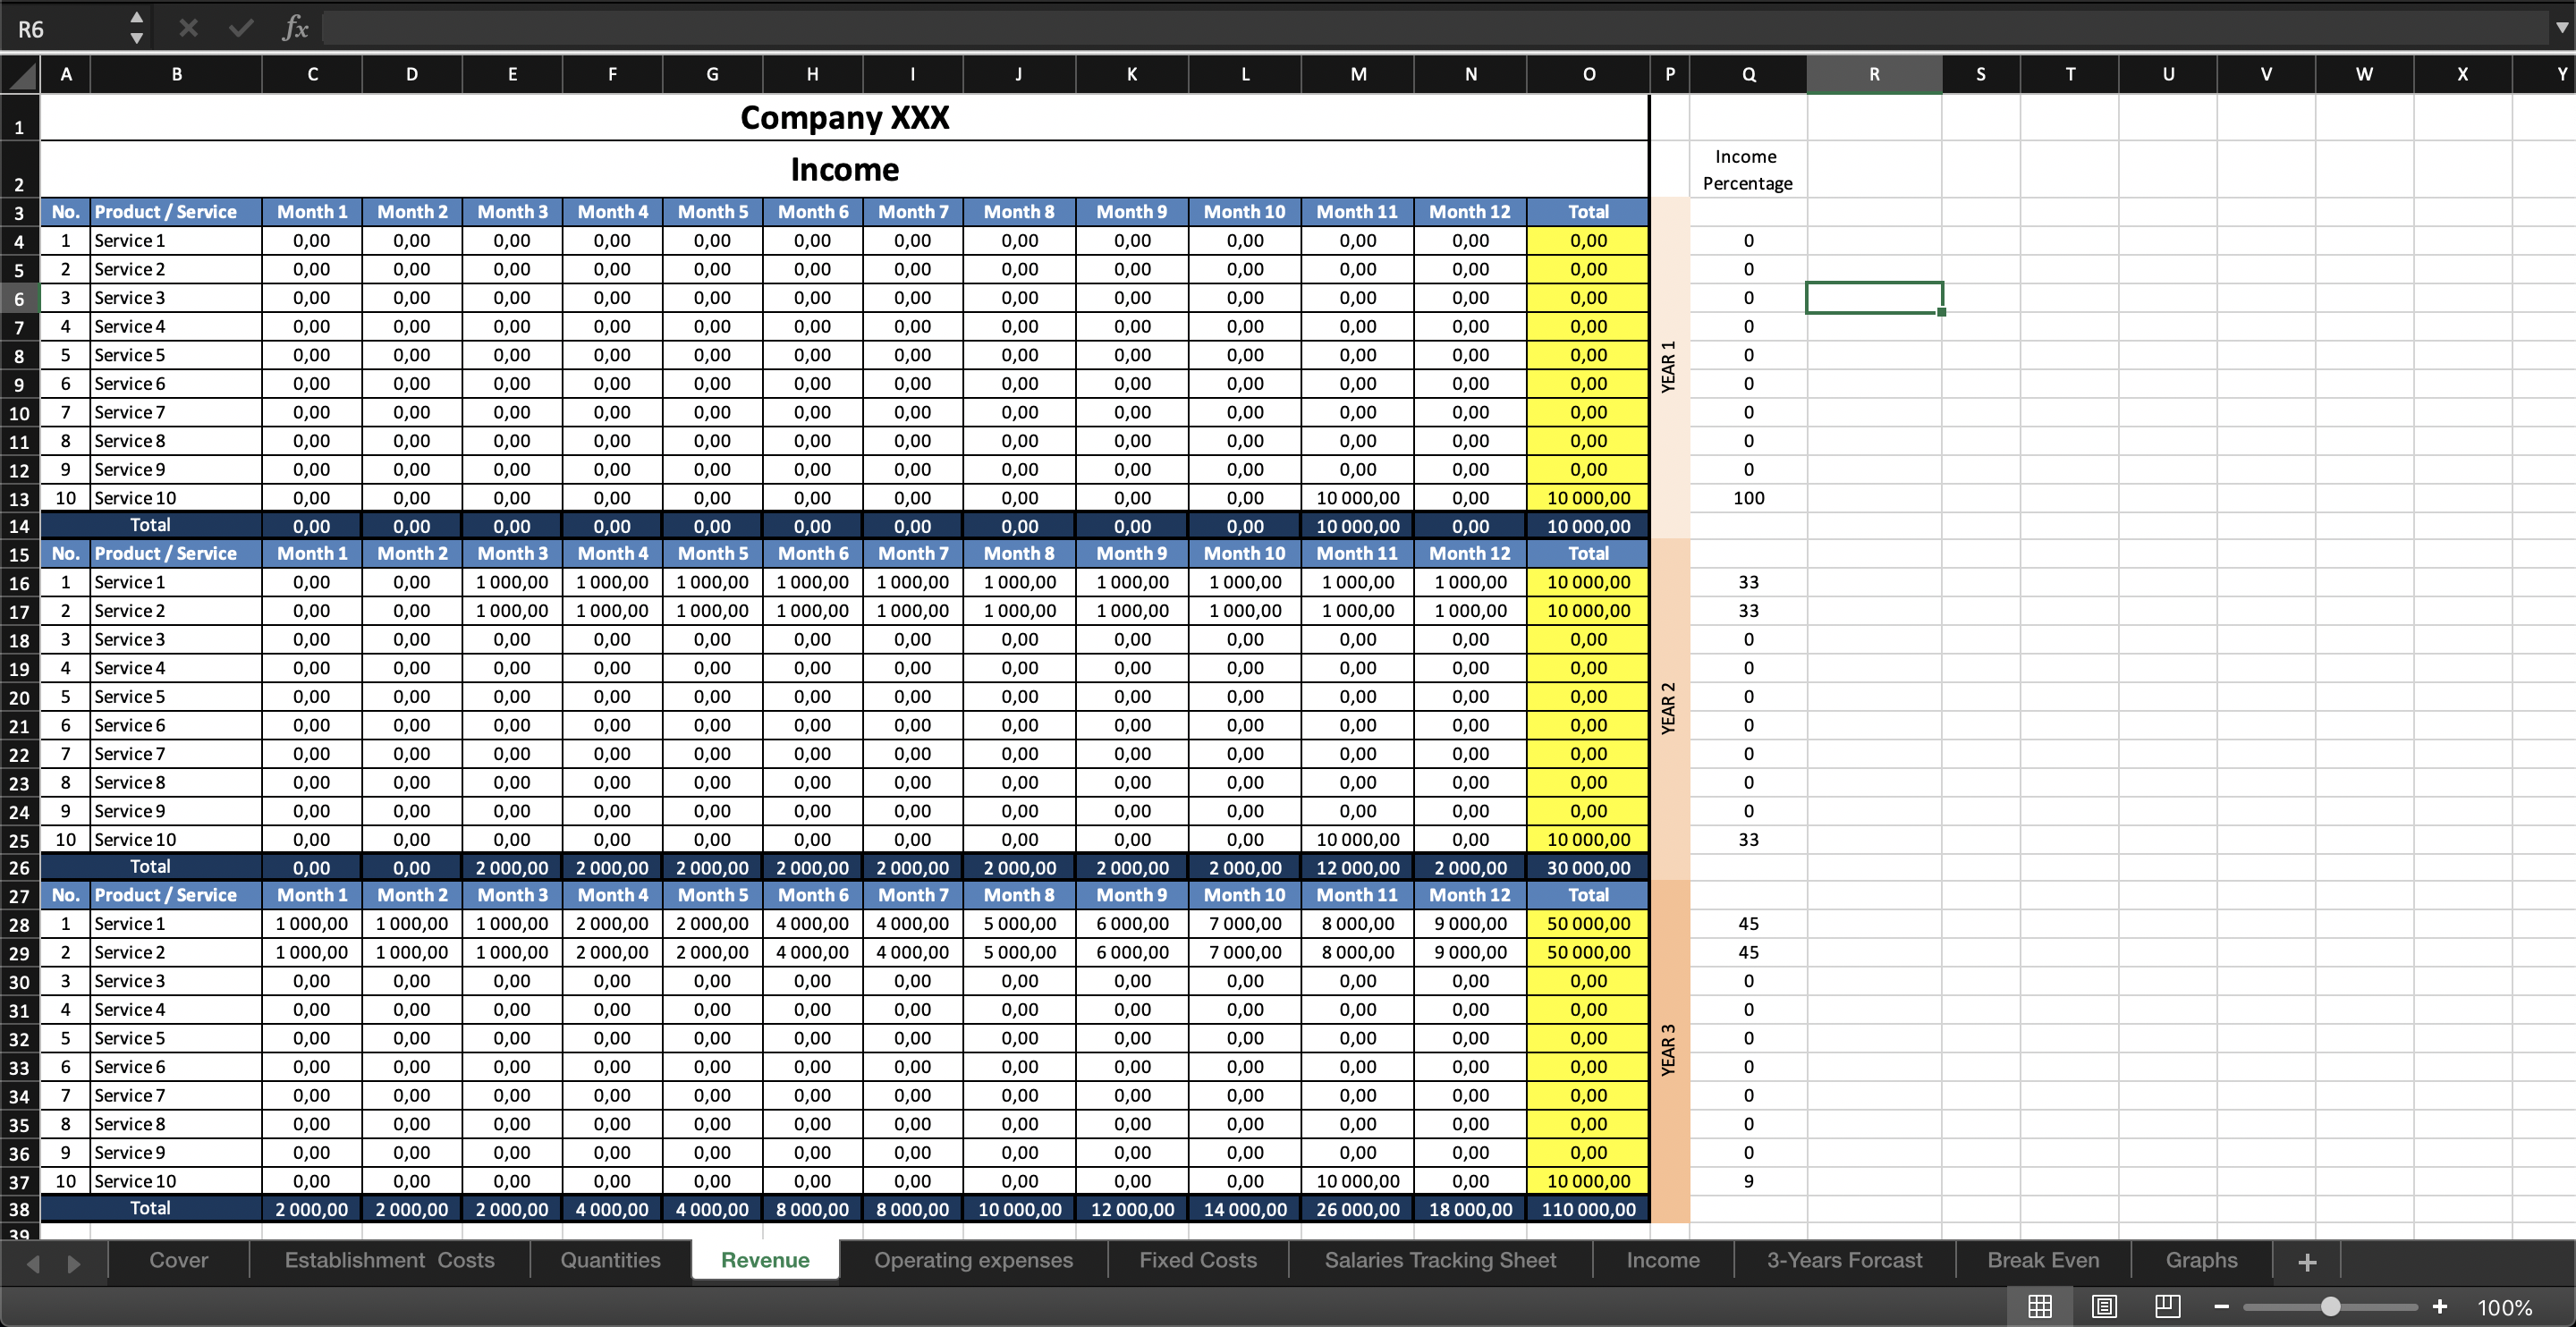
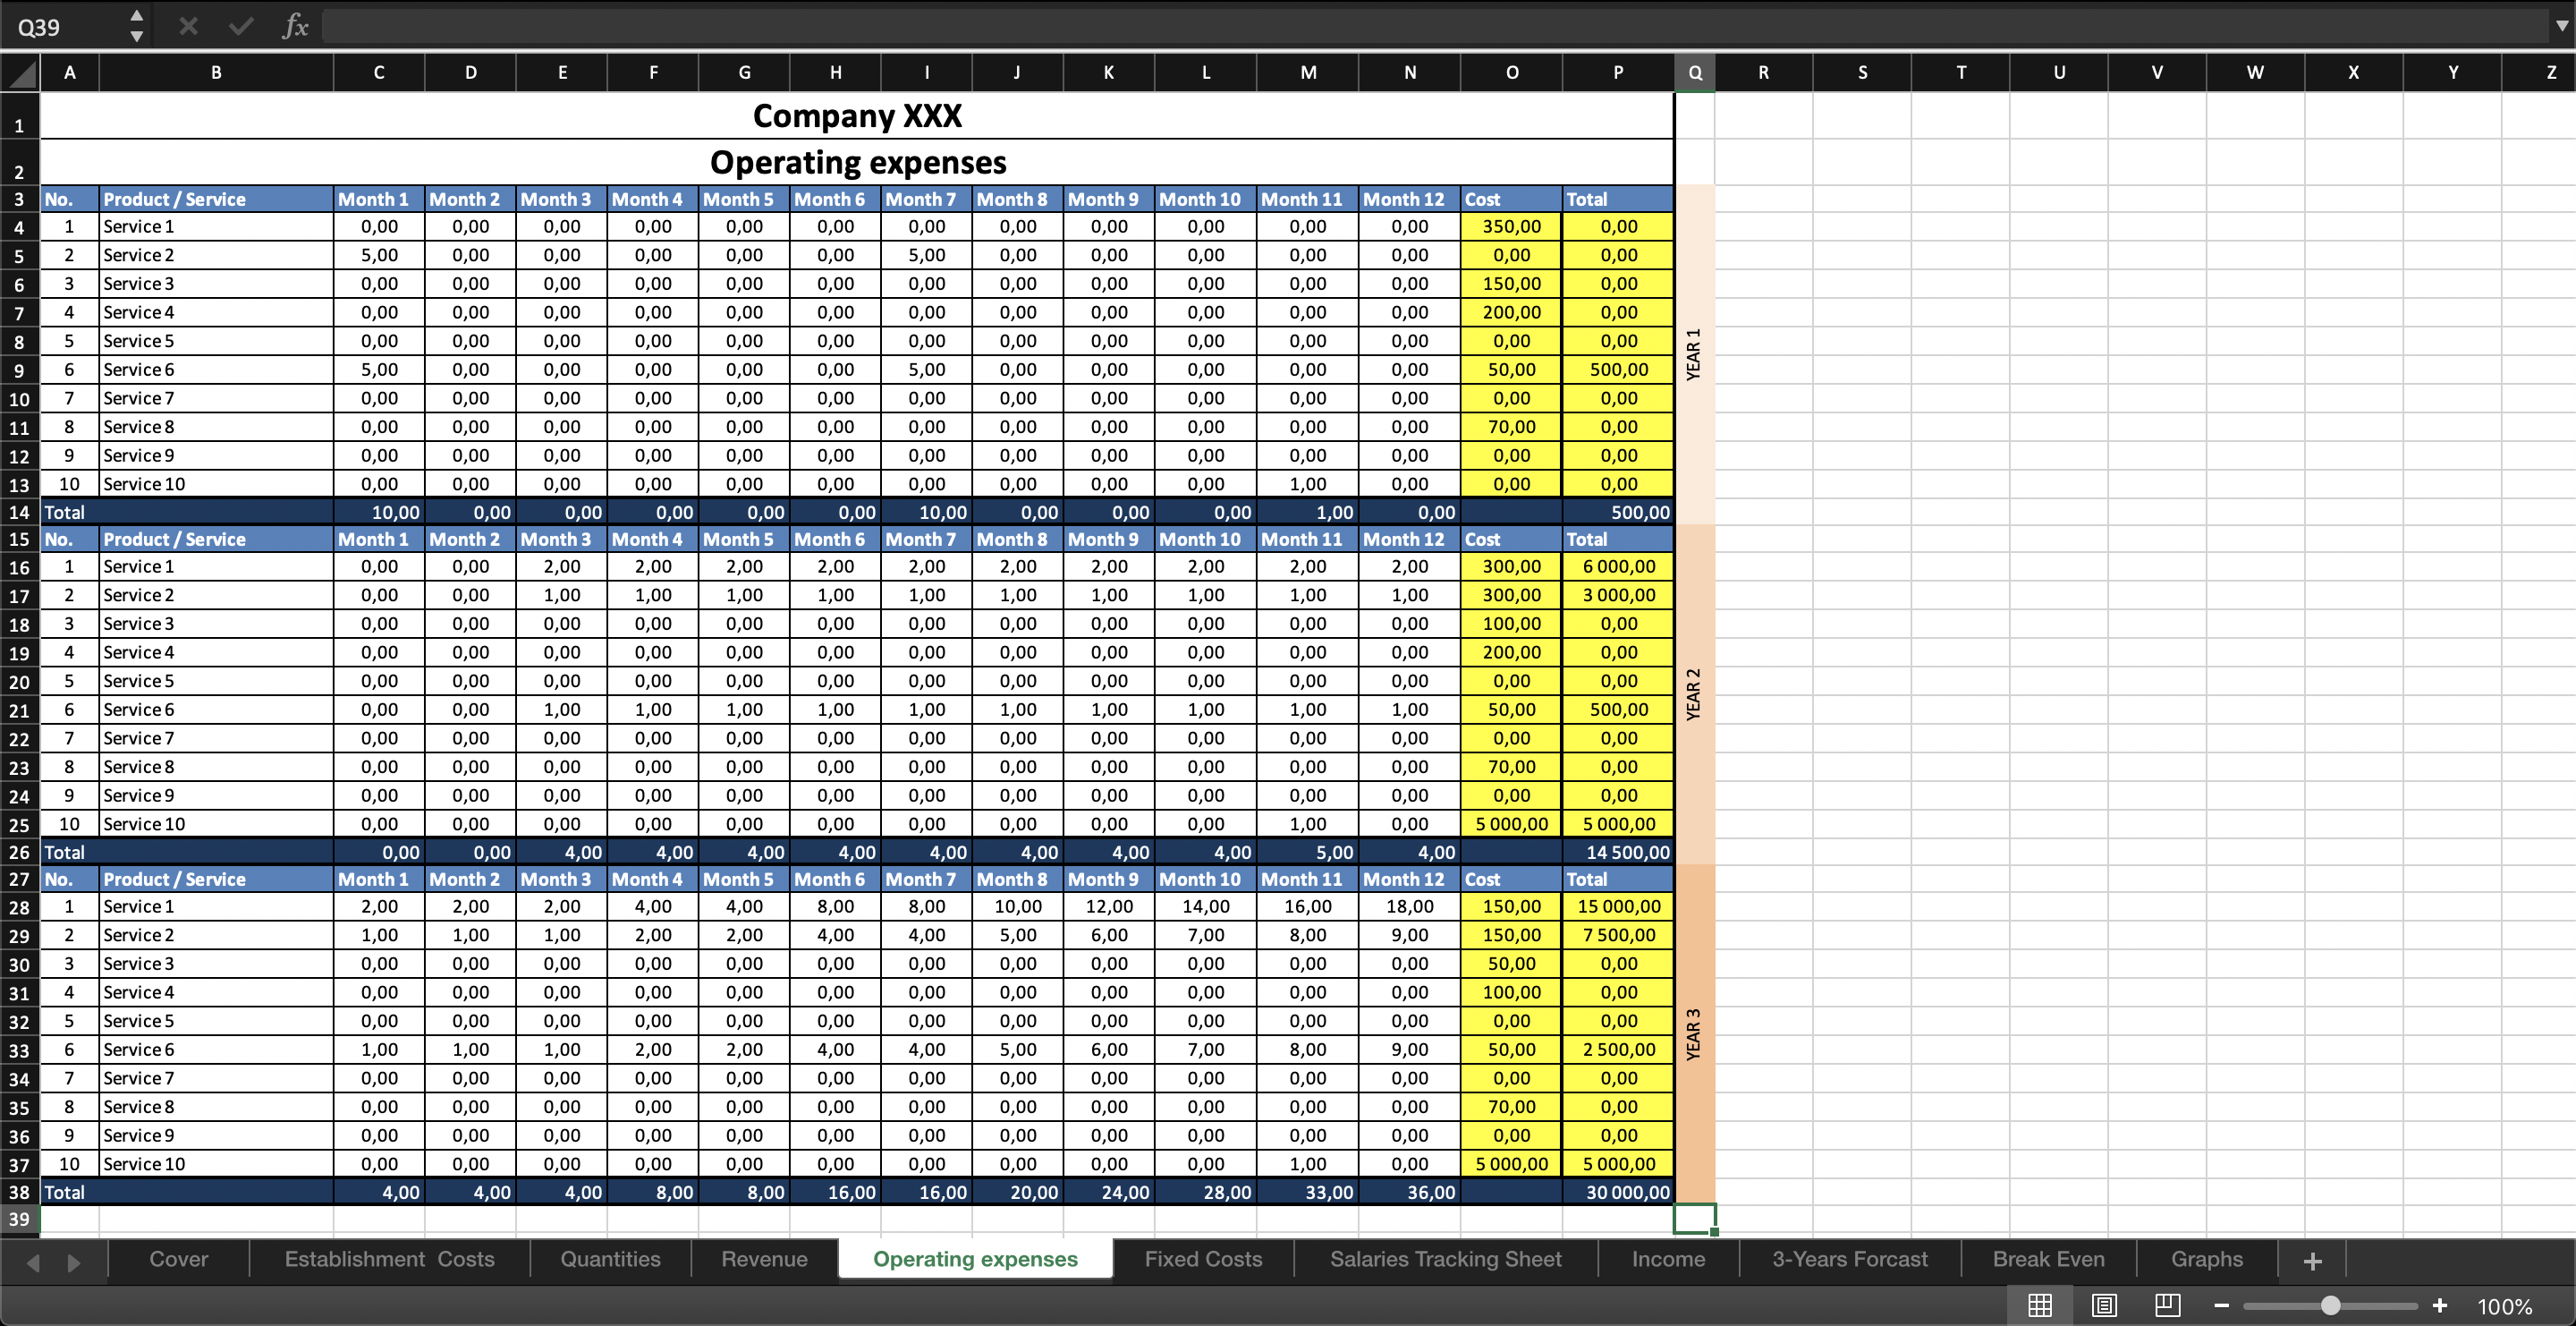
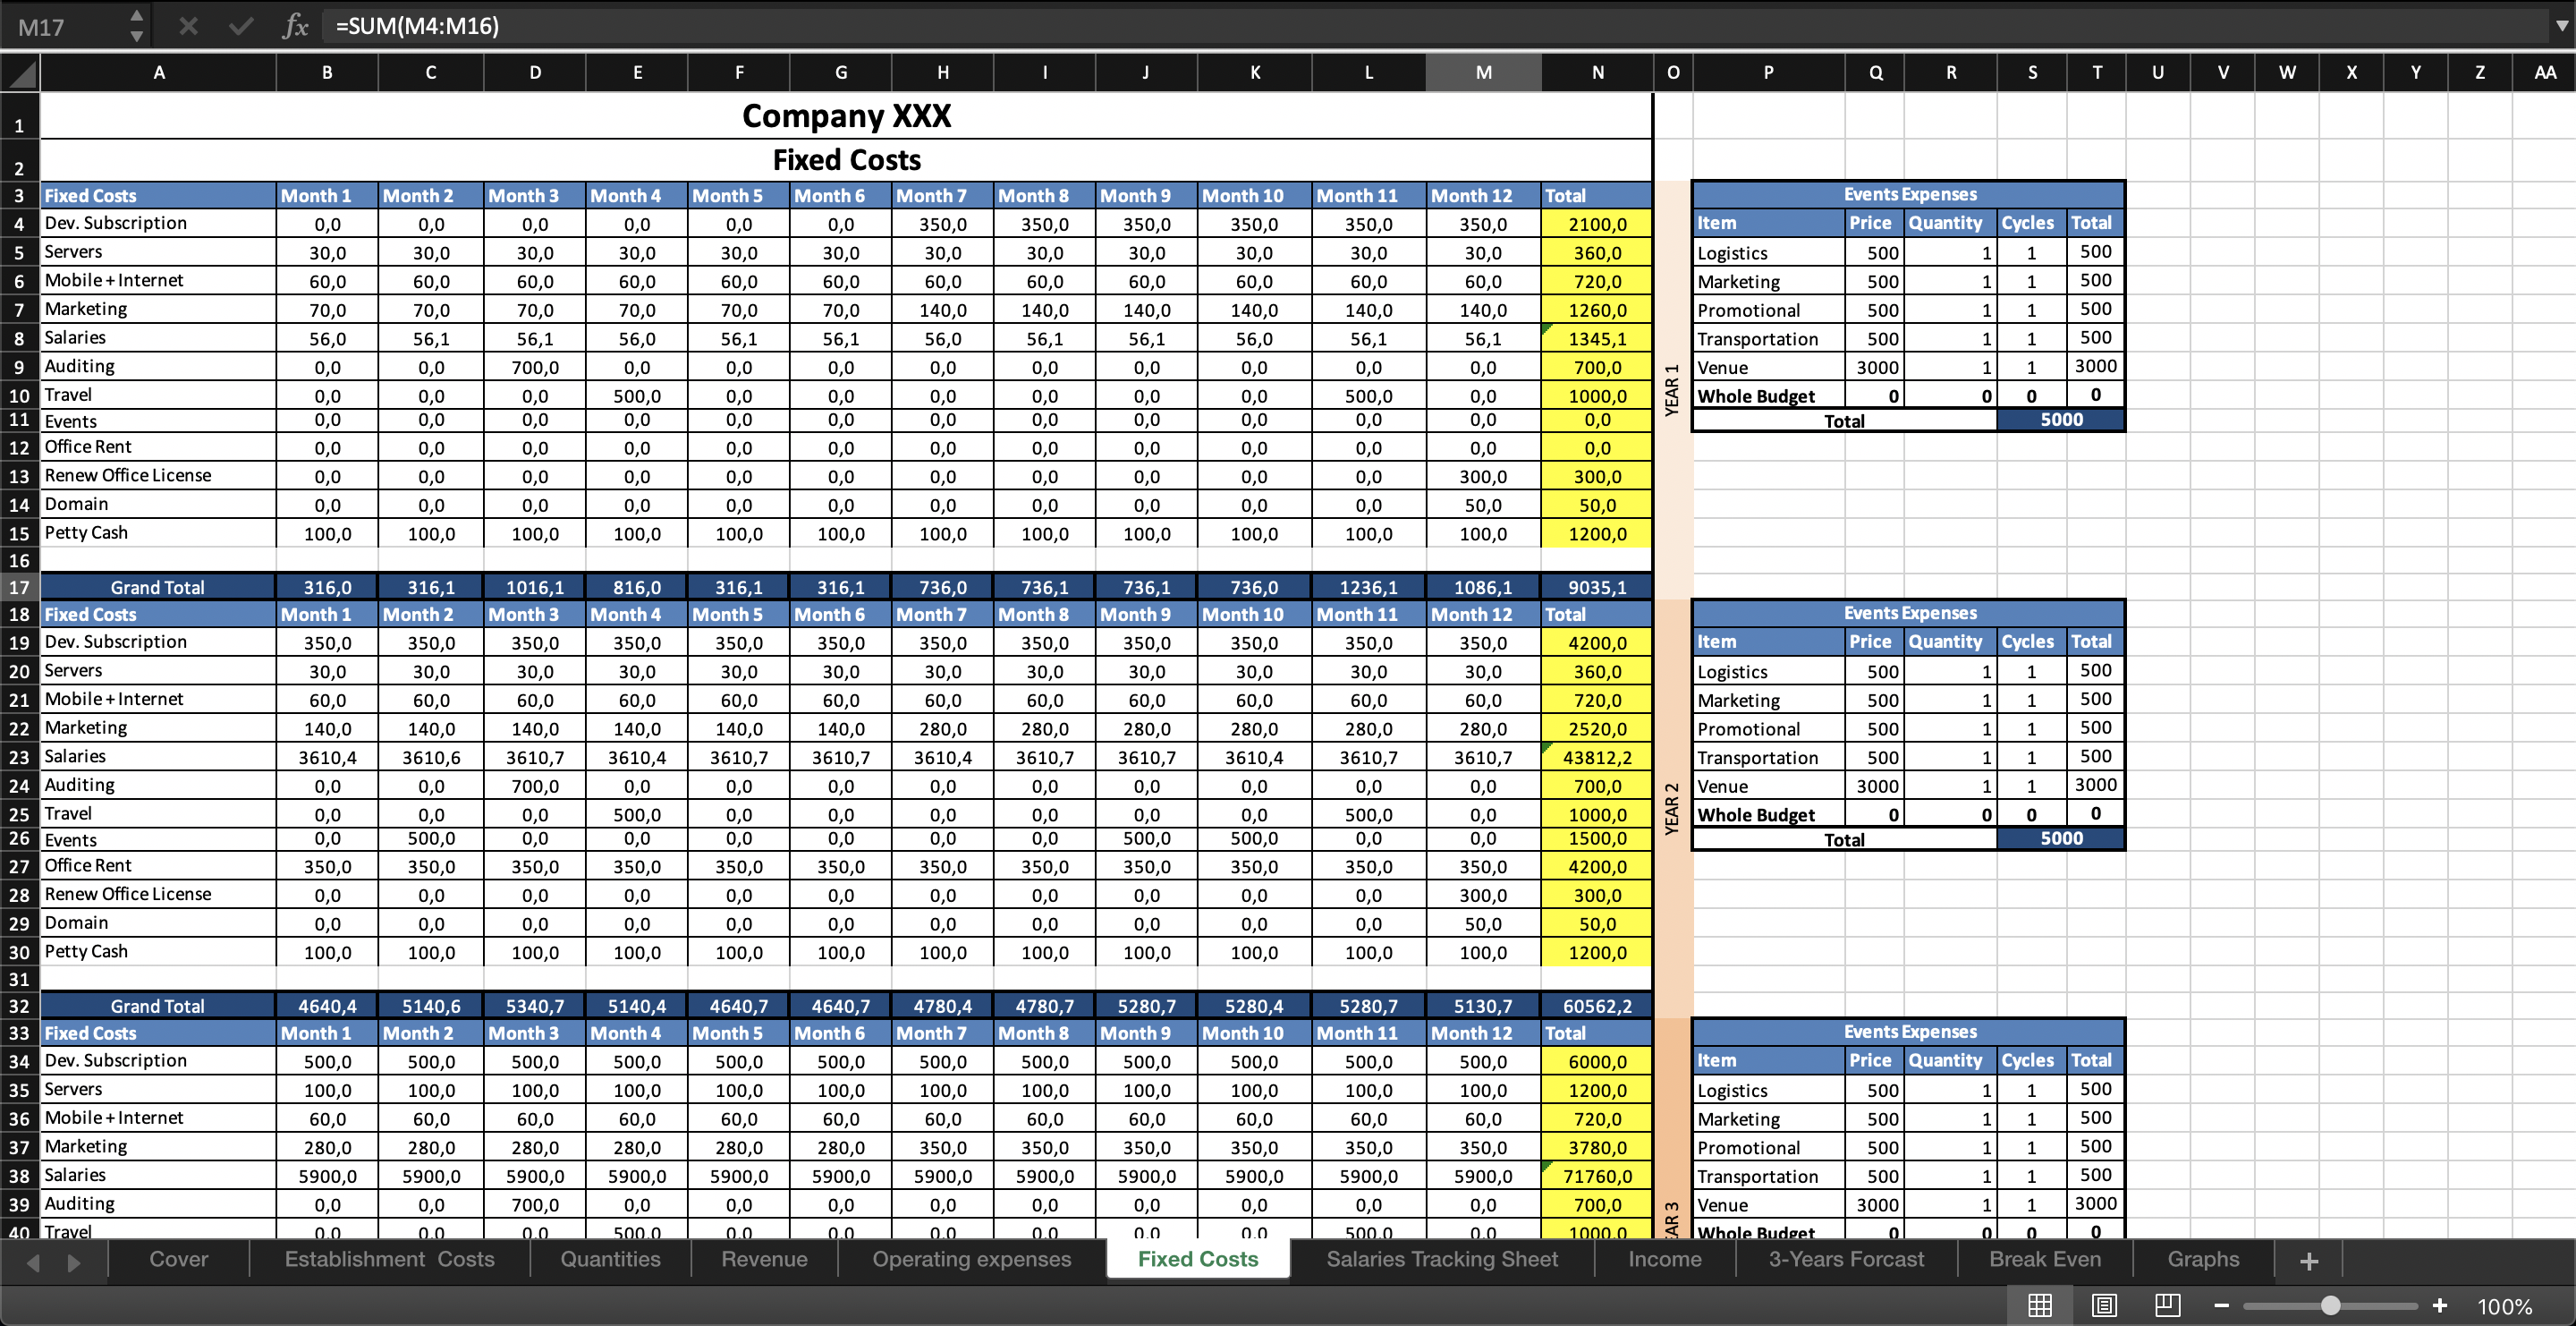
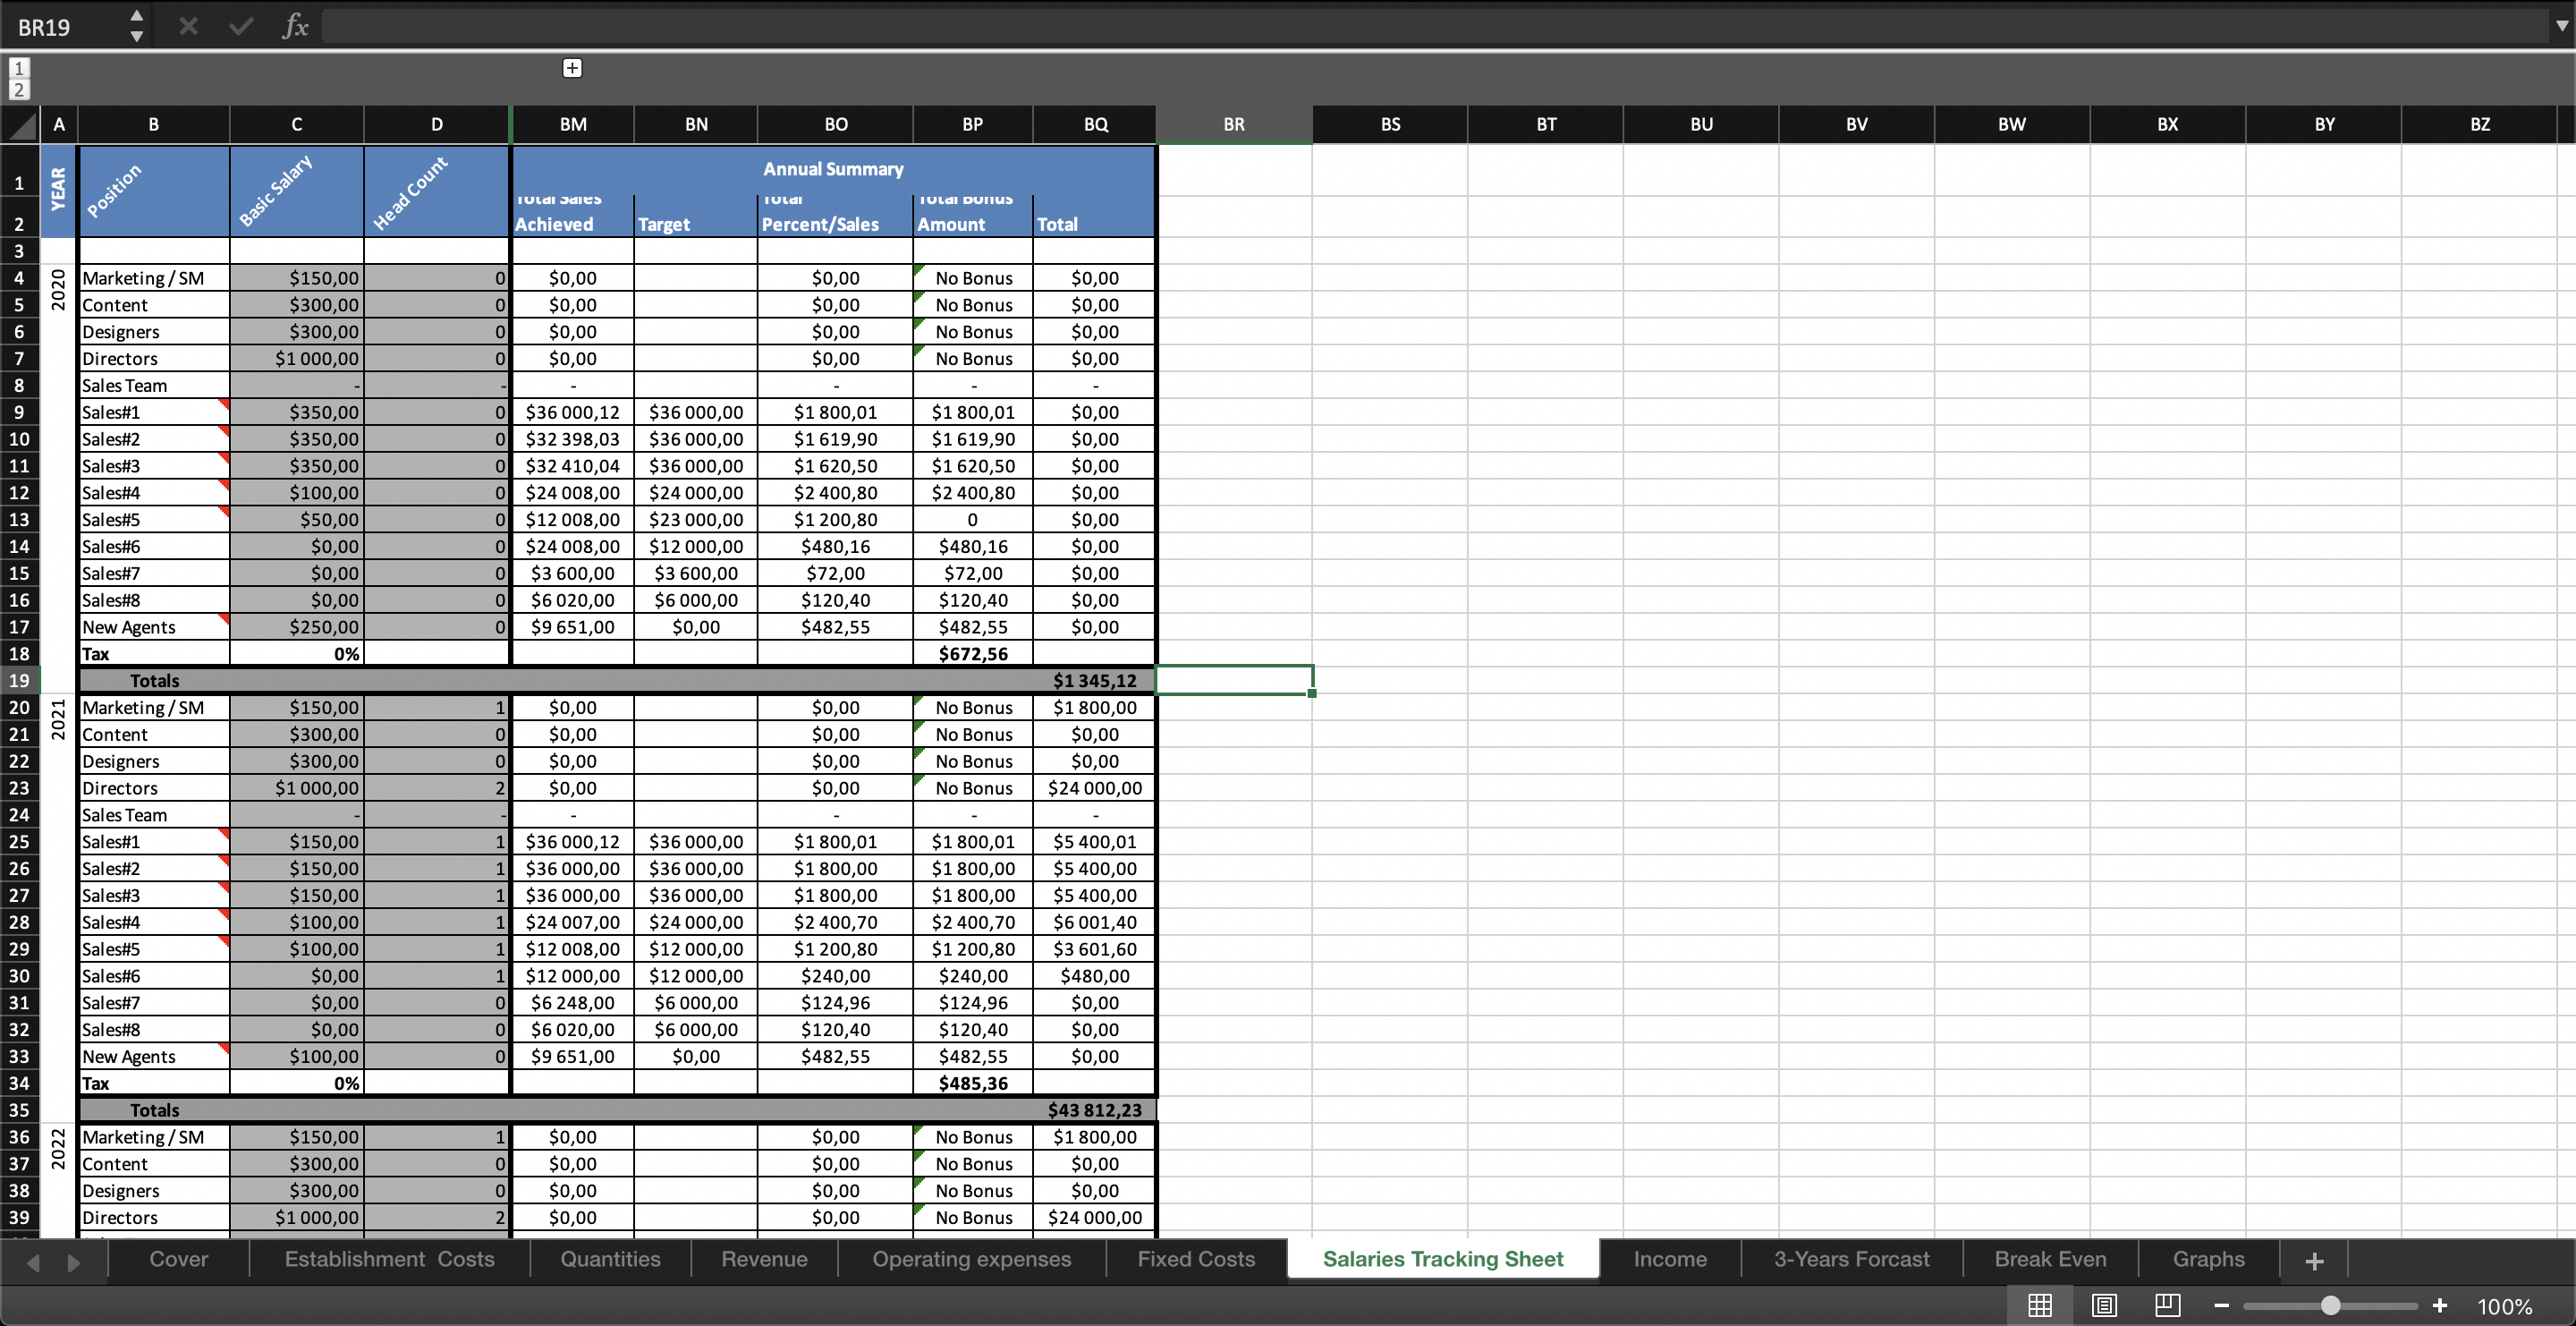
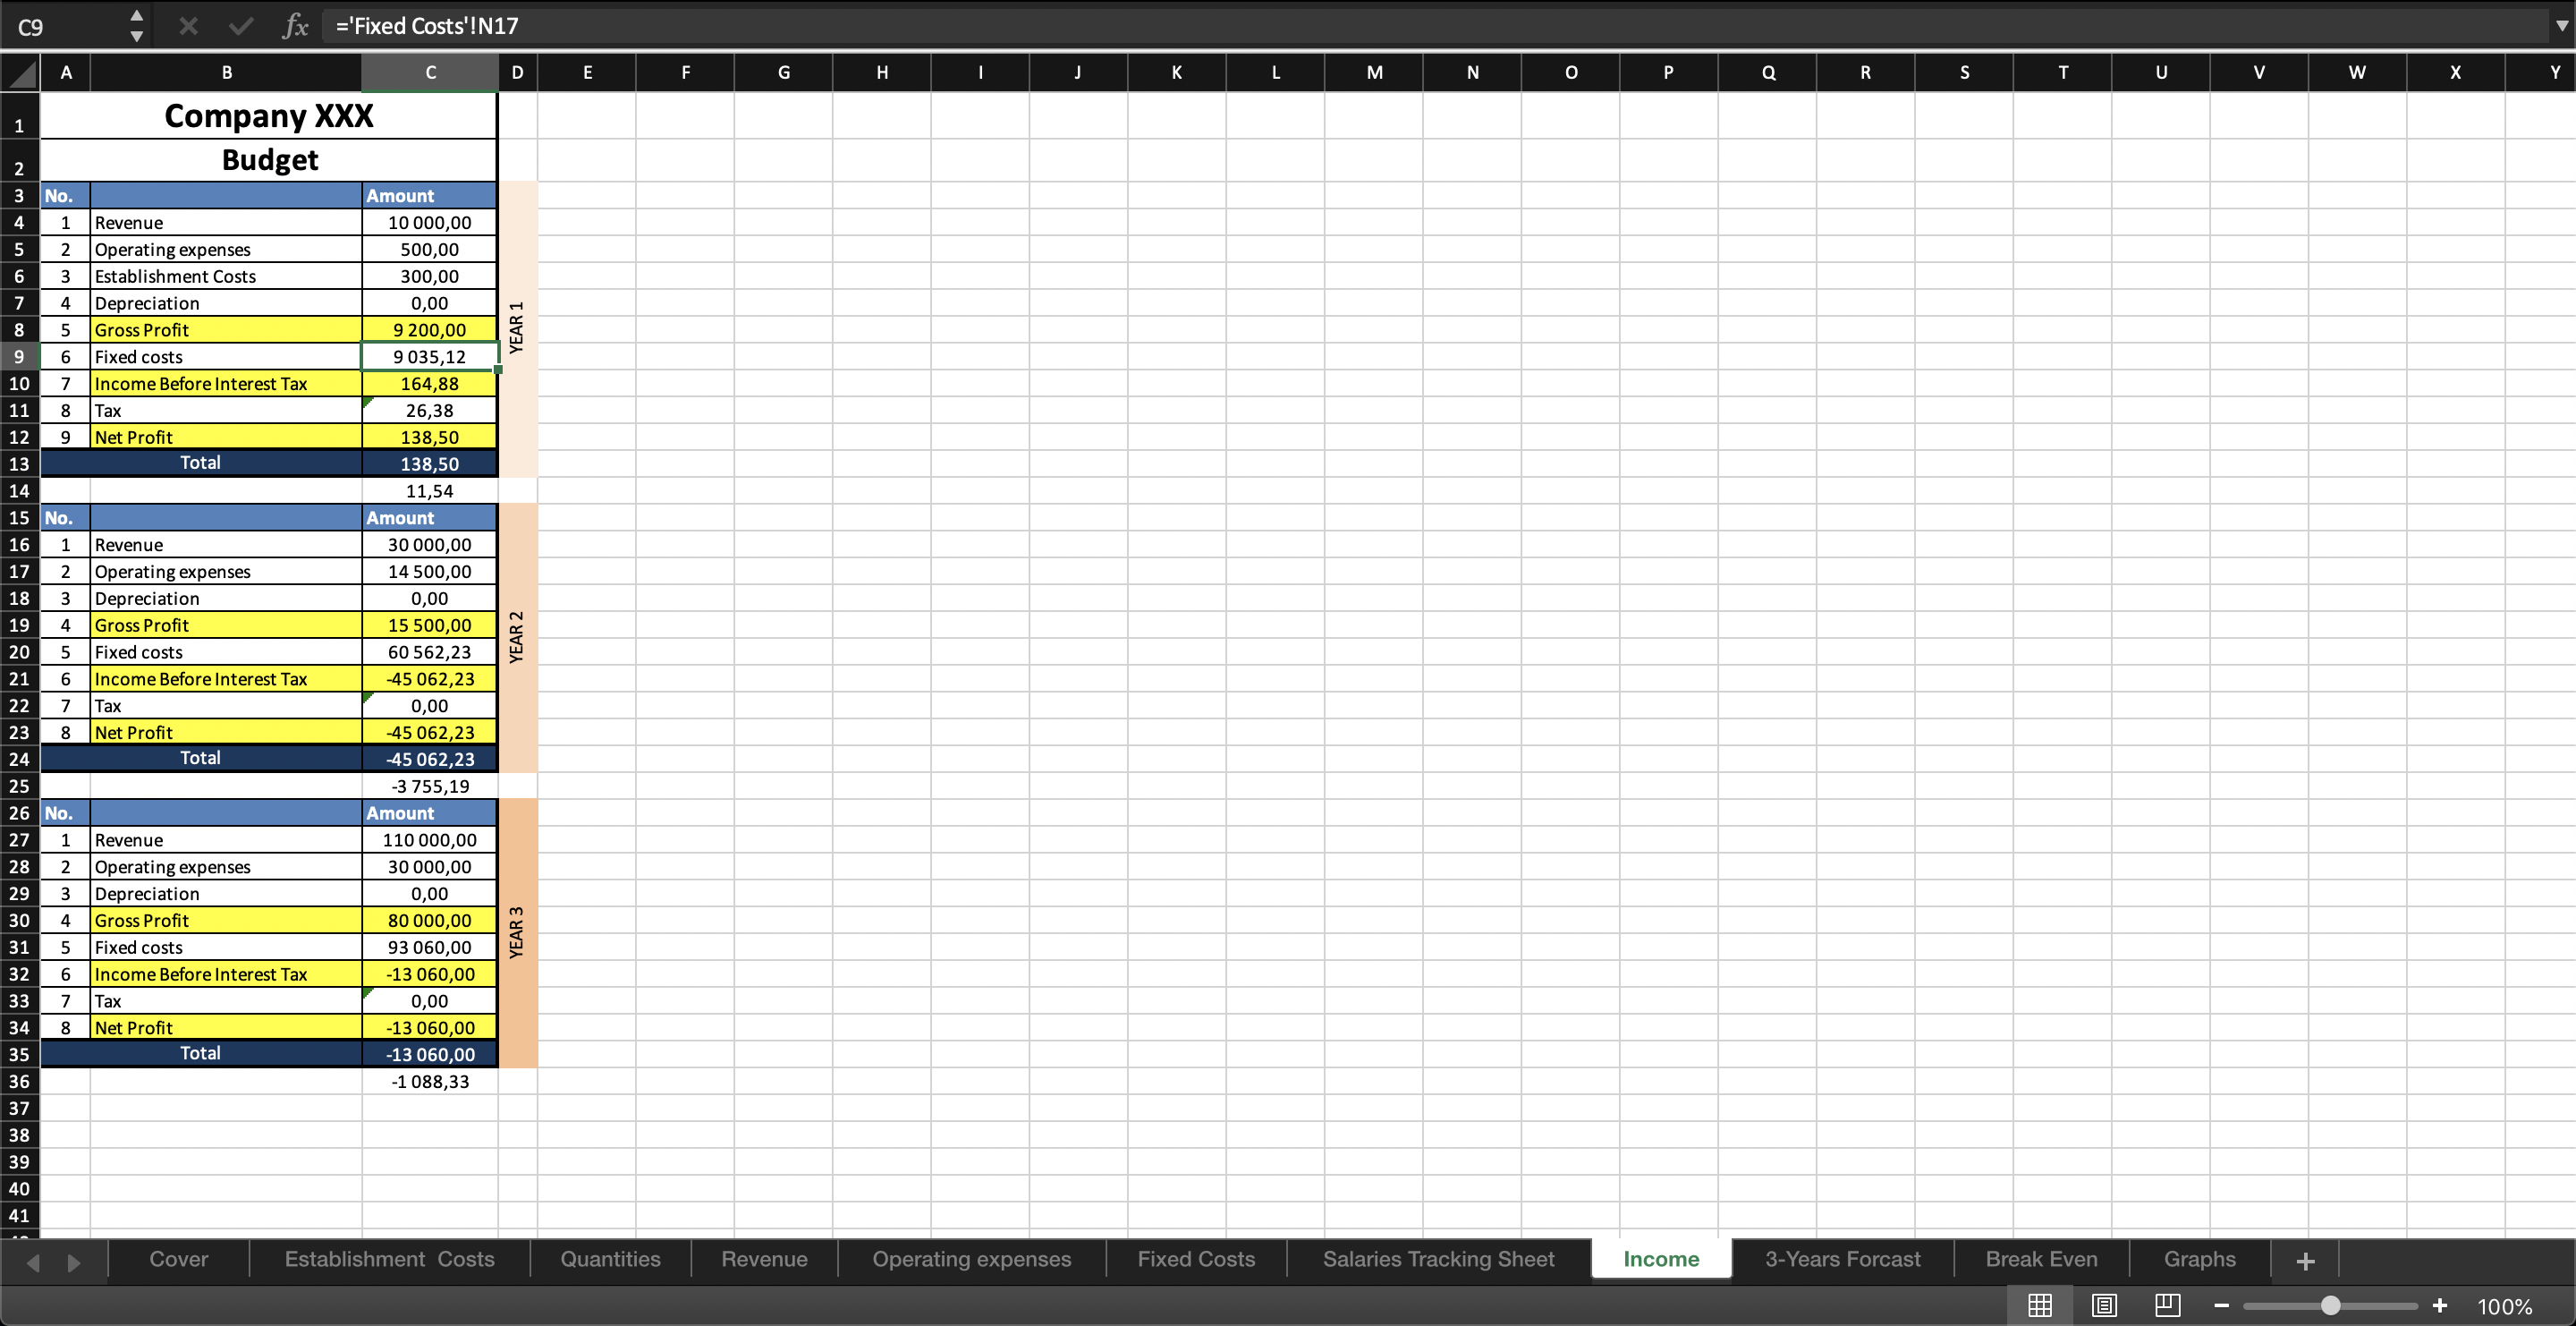
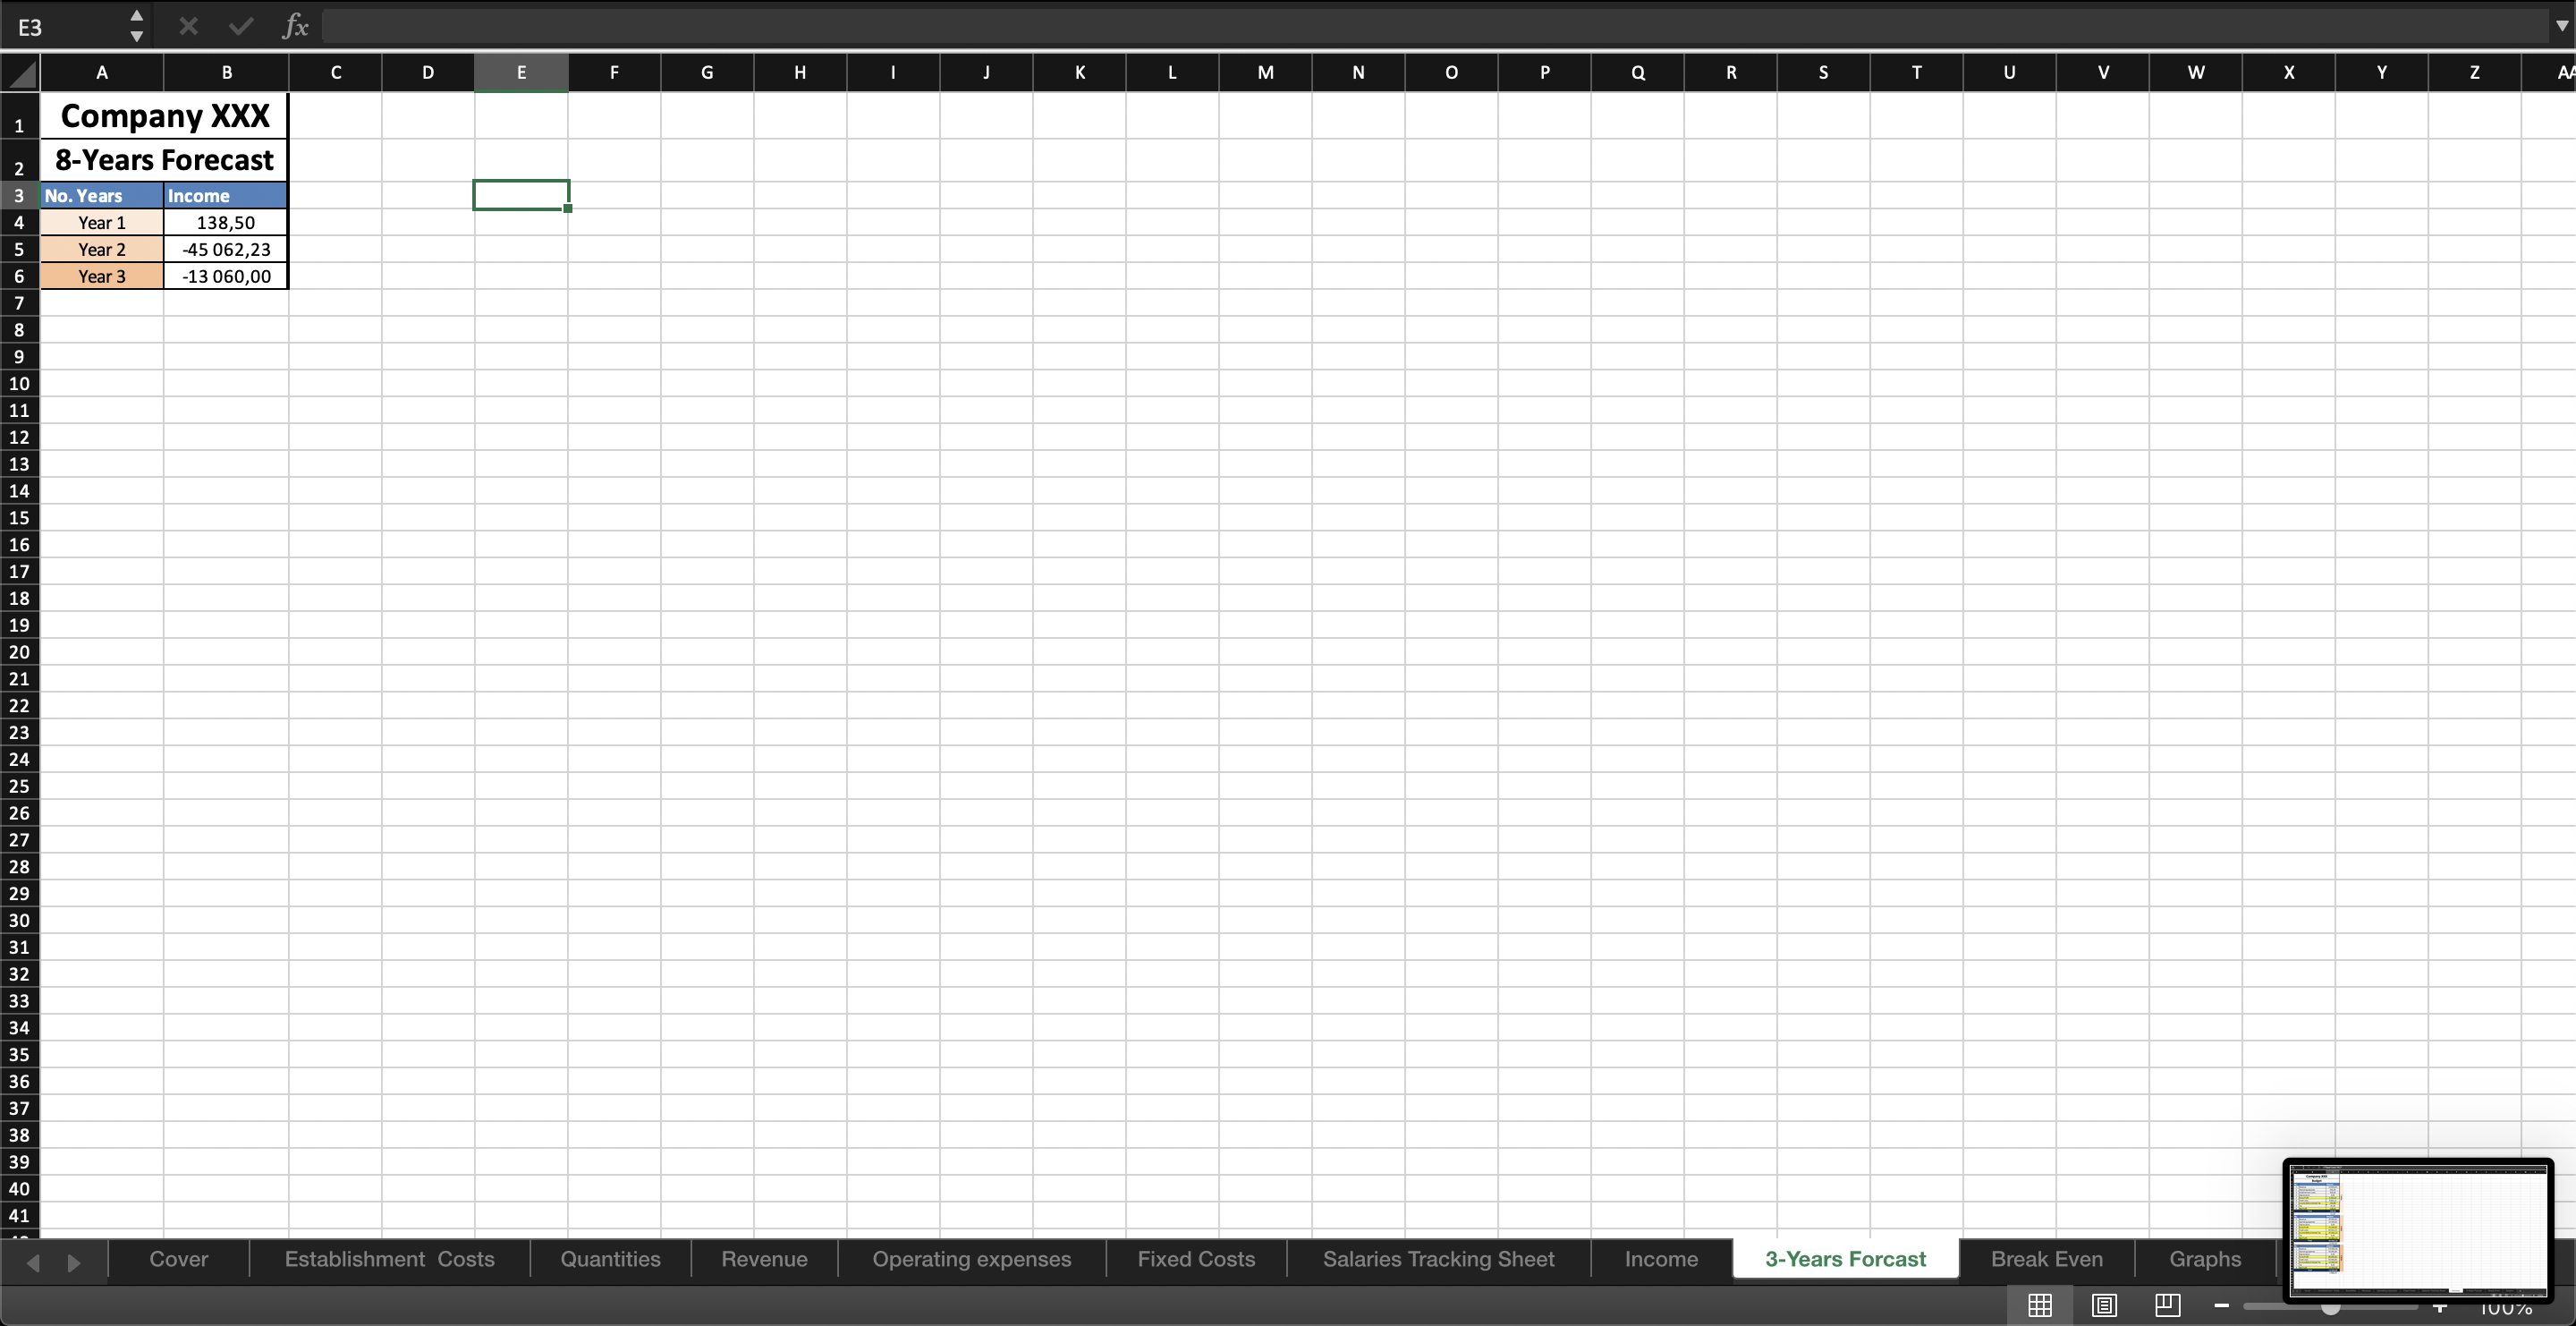
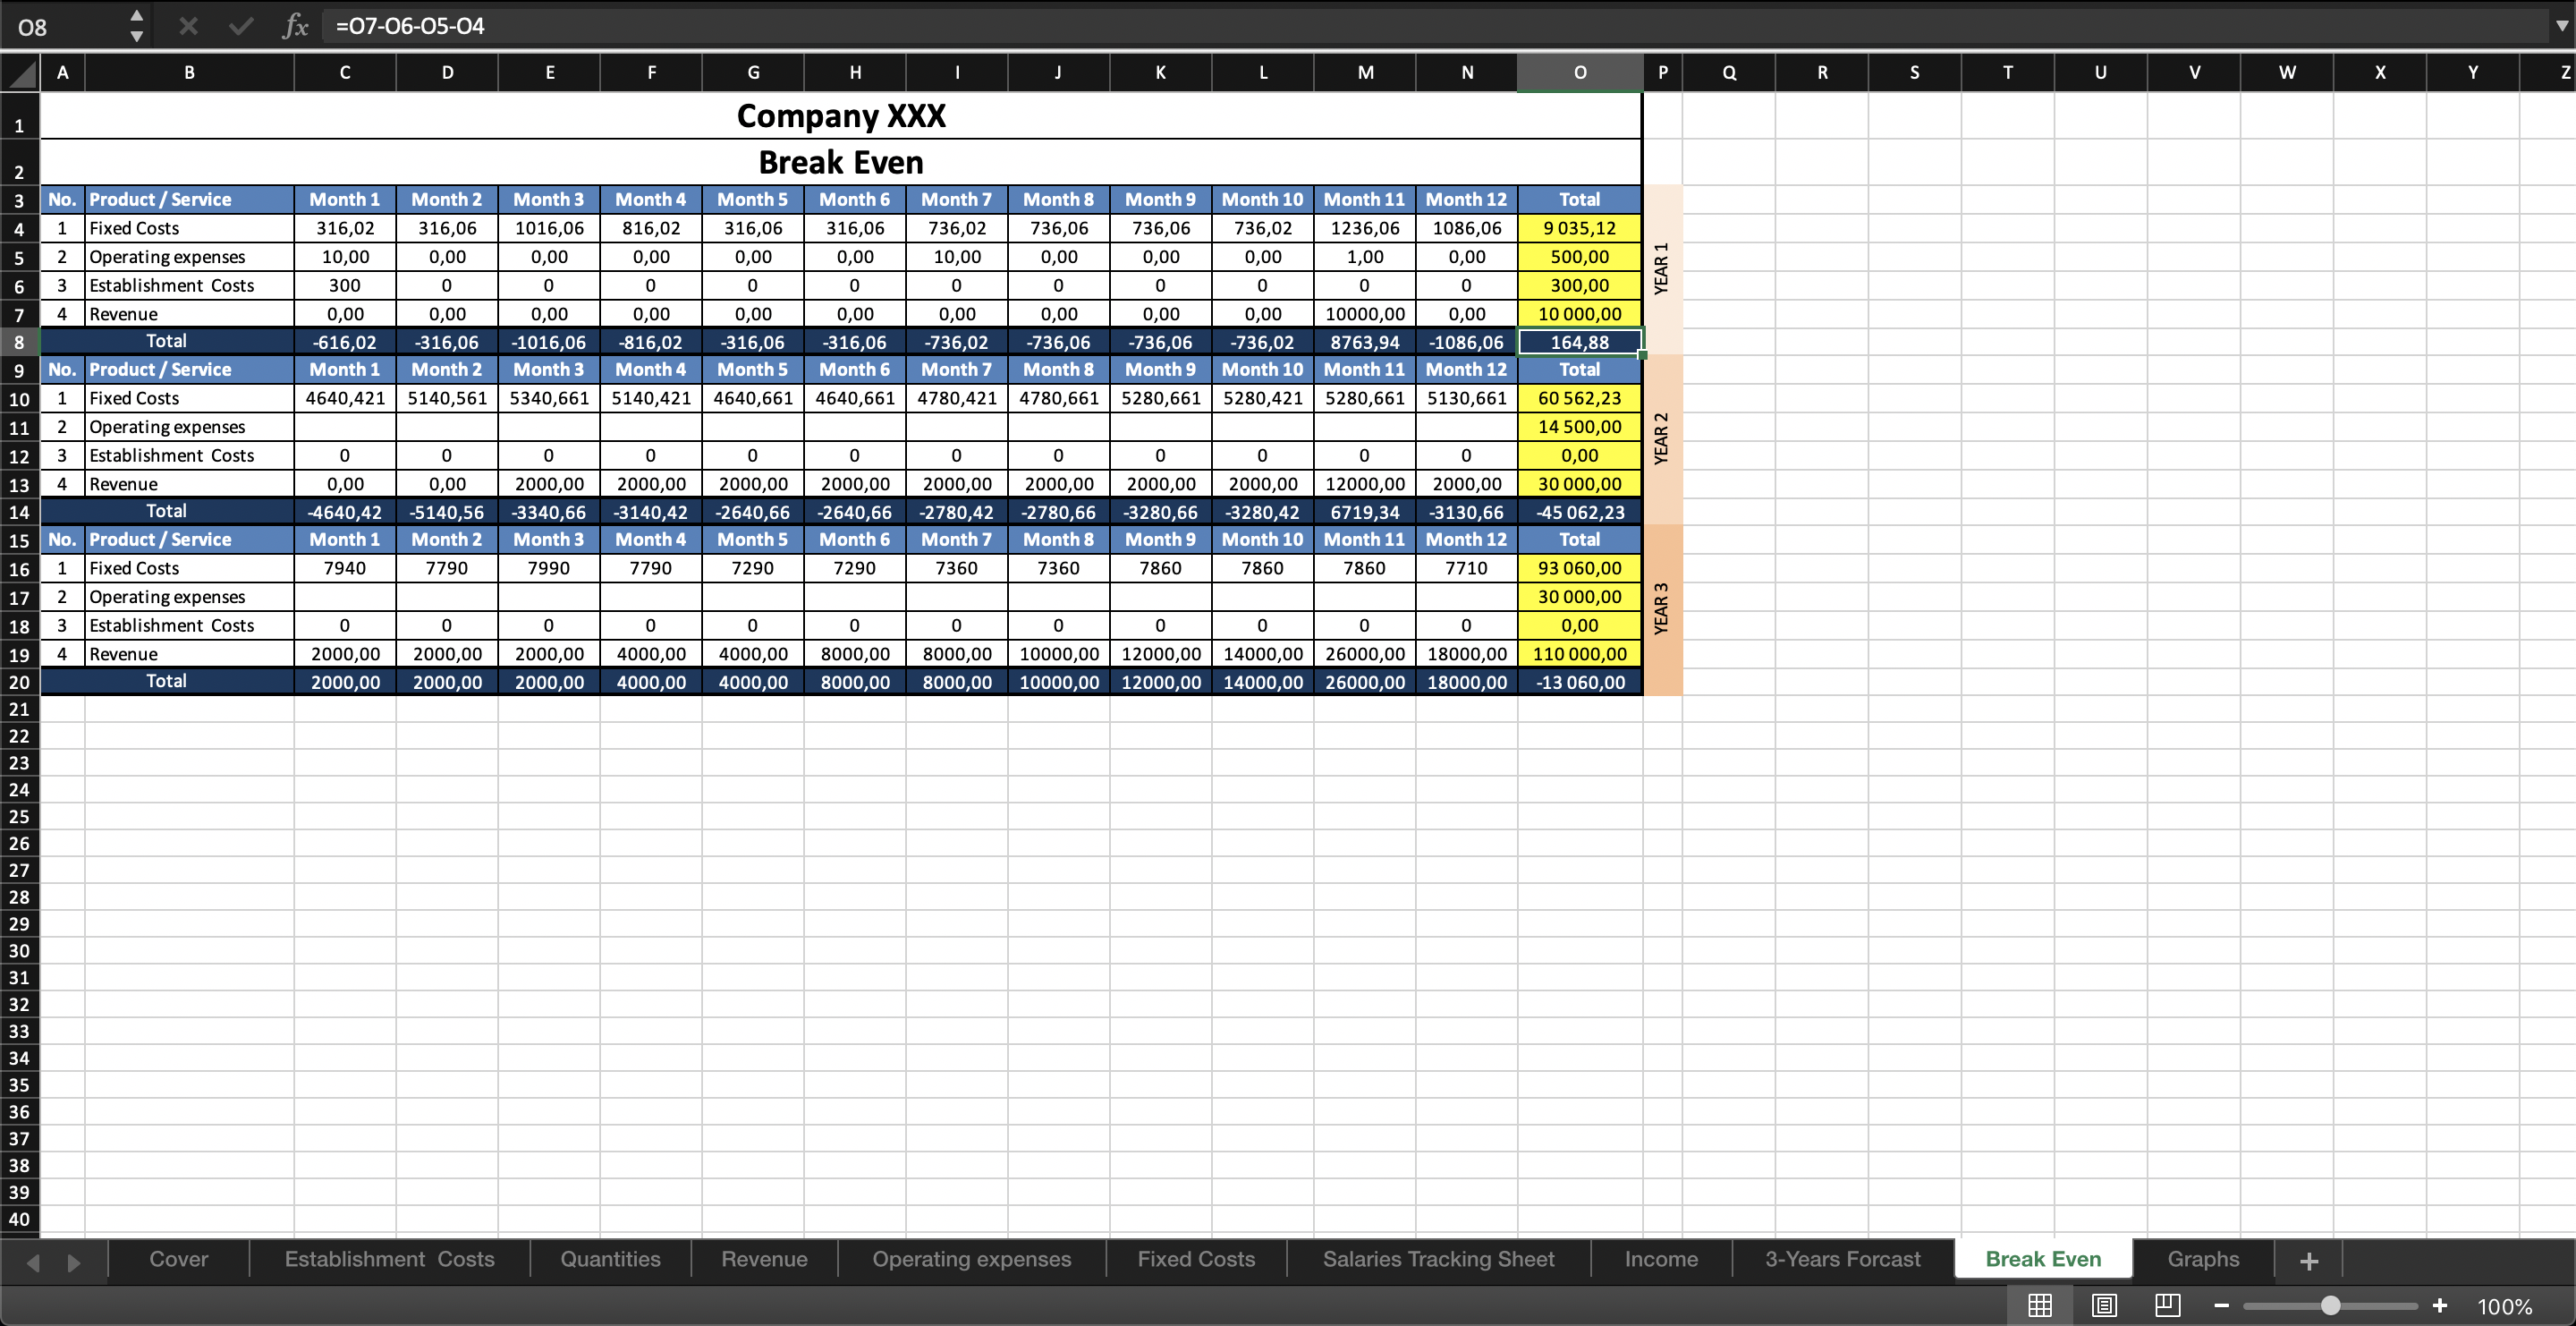
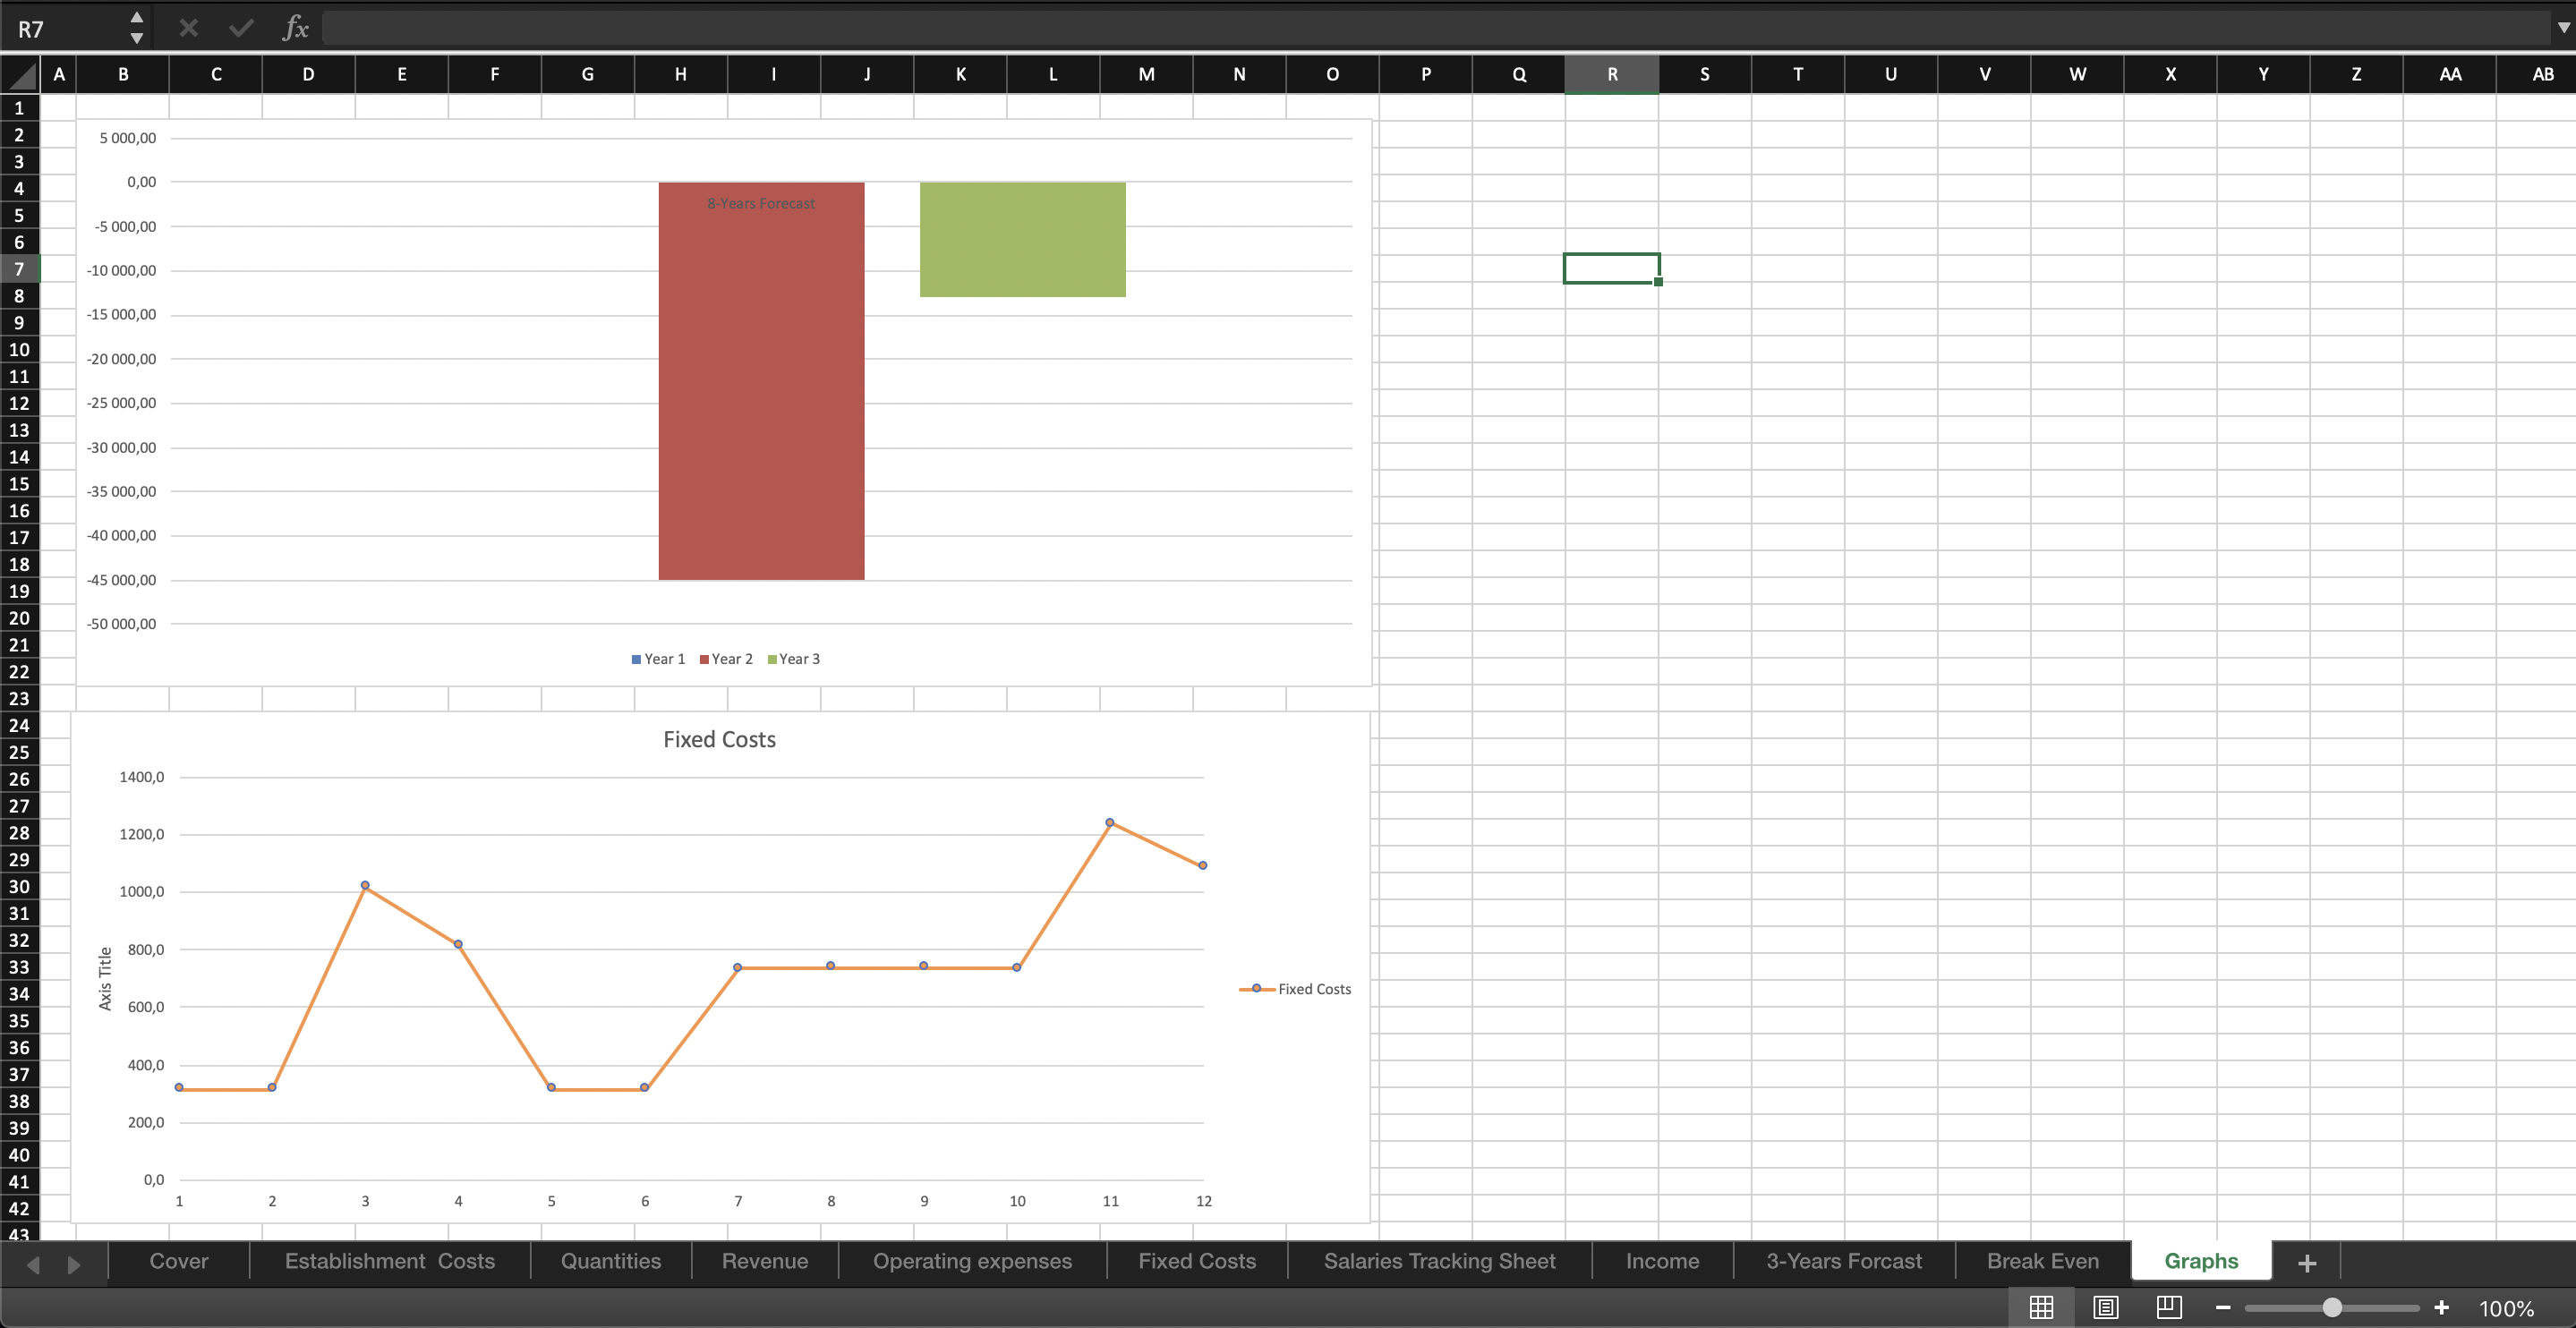
IT Startup Financial Projections (Advanced)
Advanced IT Startup Financial Projections Excel workbook.
Agile Product Manager with 12+ Years of Tech Experience | Passion for Innovation Management | Digitalization | FinTech | Logistics | PropTechFollow 10
Further information
Financial Projections for Startups
