Originally published: 14/10/2020 06:49
Last version published: 23/03/2021 08:44
Publication number: ELQ-43865-2
View all versions & Certificate
Last version published: 23/03/2021 08:44
Publication number: ELQ-43865-2
View all versions & Certificate

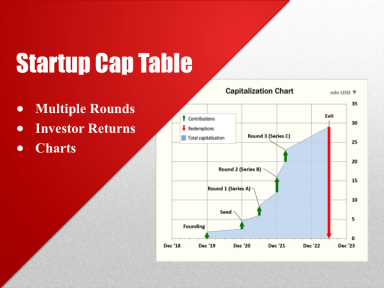
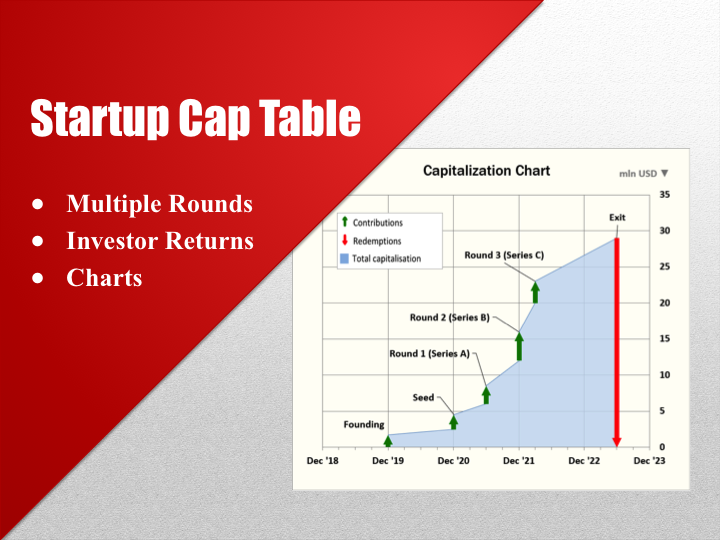
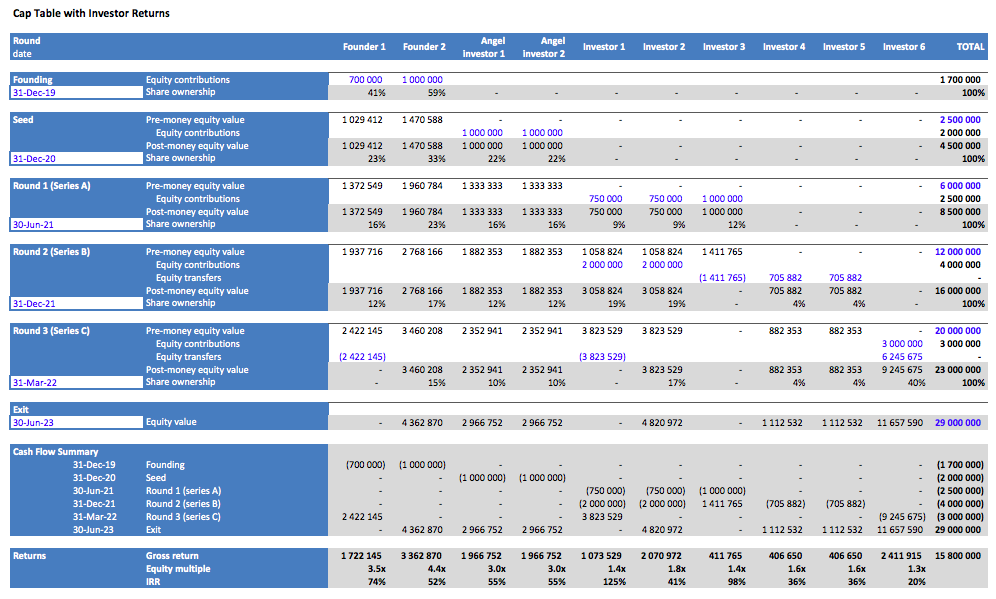
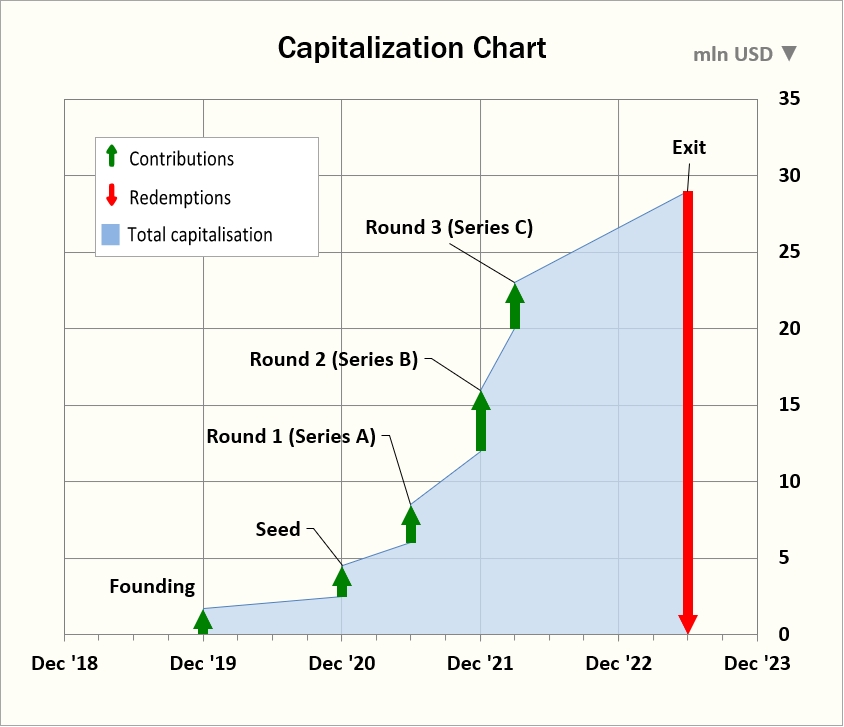
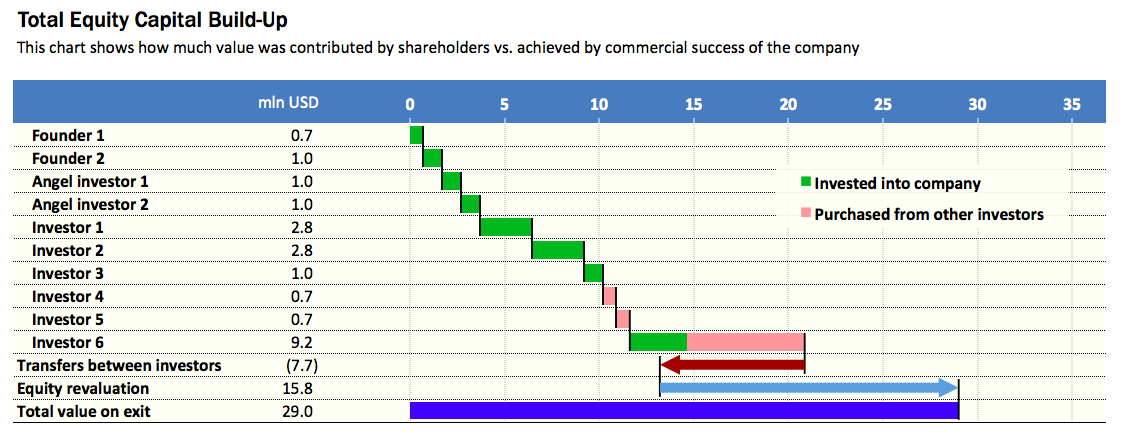
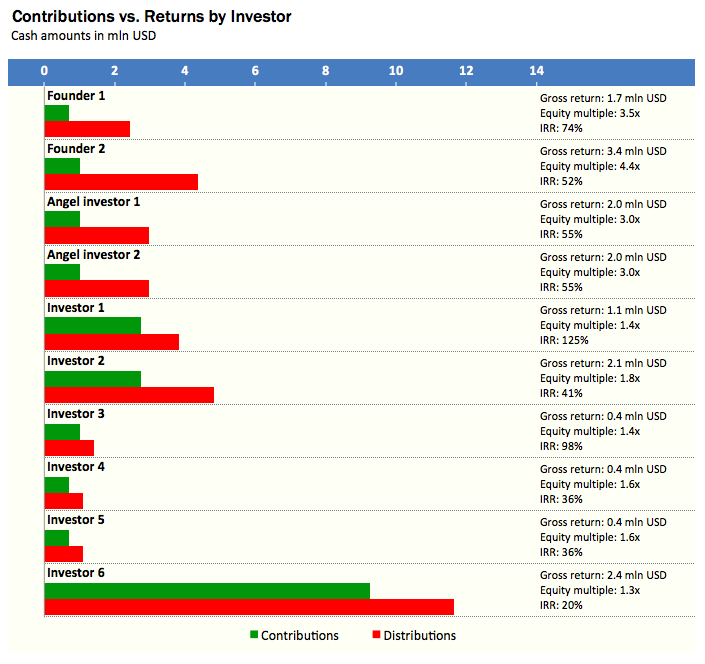
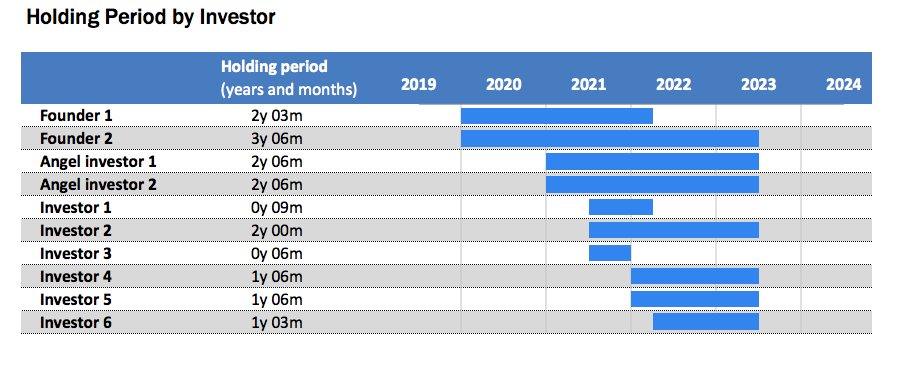
Cap Table with Investor Returns and Charts
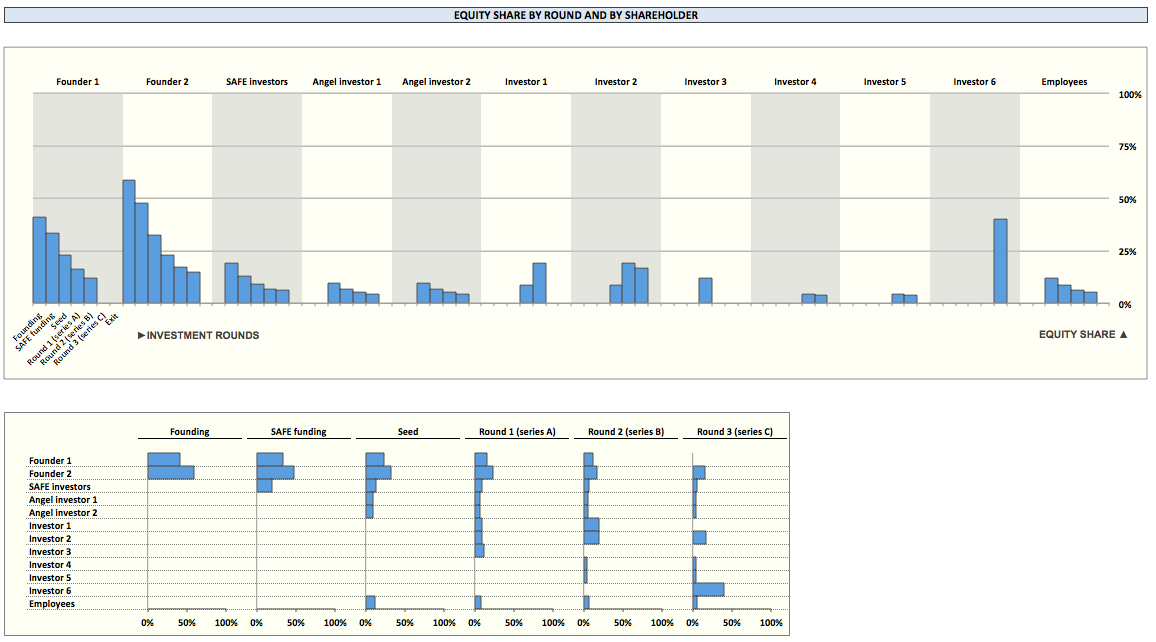
Cap table with 5 investment rounds for up to 10 investors
Further information
Calculate investors shares and equity value at each investment round
A startup with multiple investment rounds
n/a
