
Originally published: 29/11/2021 09:08
Publication number: ELQ-54405-1
View all versions & Certificate
Publication number: ELQ-54405-1
View all versions & Certificate

Sales Pipeline Manager (CRM) Excel Template
This template is an efficient solution to Sales Pipelines Management, helping you to make educated decisions to improve conversation and increase sales.
sales pipeline managersales pipelinecustomer relationship managementsales funnel performance chartcrm sales softwaresales funnel
Description
This easy-to-use template uses CRM Sales Software to give visibility to your sales funnel and help you to make better decisions.
The template’s benefits include:
- Gain a better understanding of your sales funnel or pipeline.
- Discover the weak areas in your sales funnel and then take relevant actions to increase conversion rate.
- Identify issues in the sales process and take actions to shorten the sales cycle.
- Understand your current active pipeline and forecast future sales.
- Gain valuable insights on the most successful types of deals and prioritize them in the future.
- Track customer relationship management activities in one file.
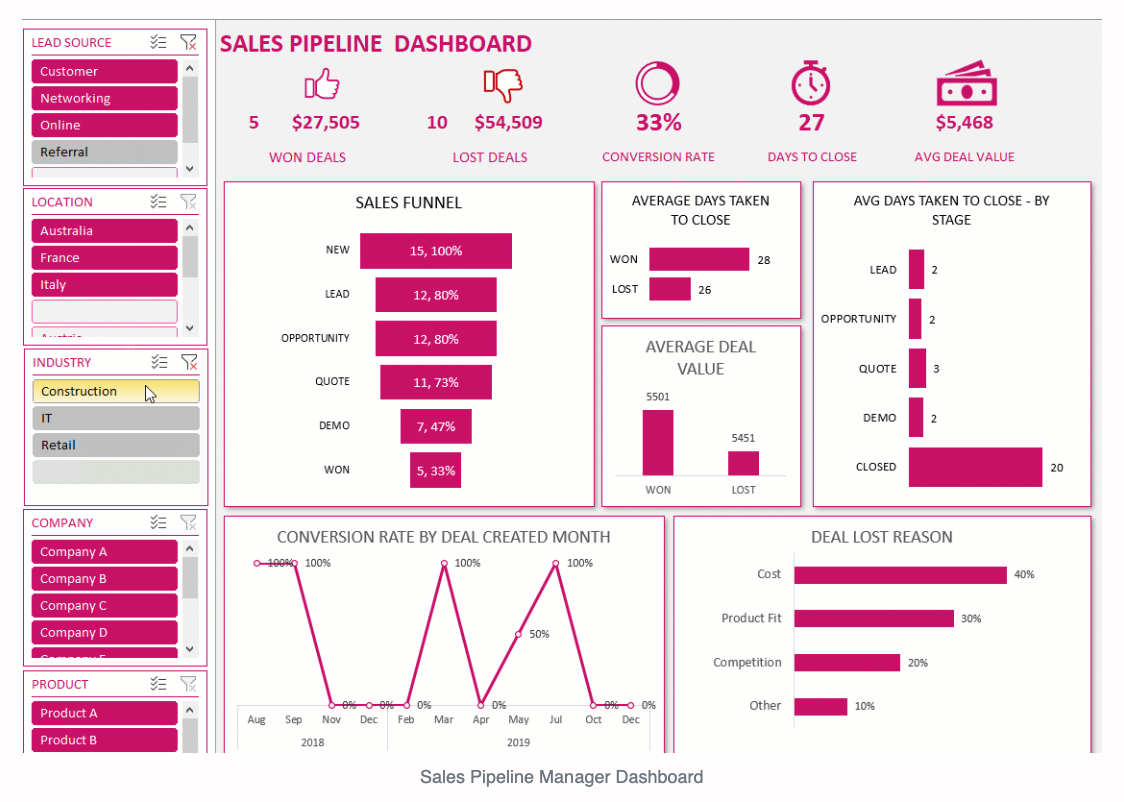
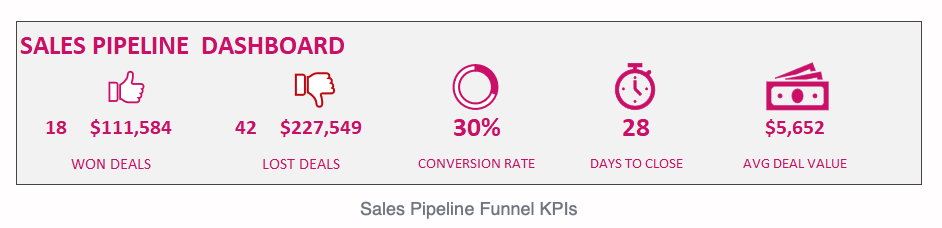
The template’s automated and interactive dashboard contains operational Sales Funnel KPIs. View key metrics by Won Deals, Lost Deals, Conversion Rate, Avg Days to Close Deal and Avg Deal Value.
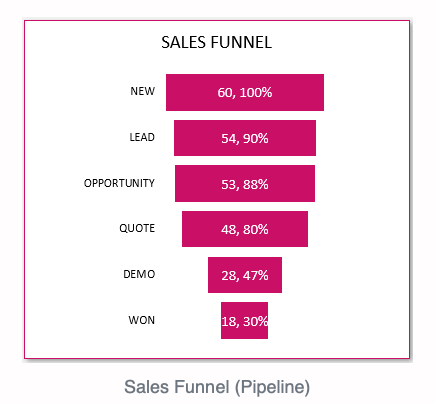
With the Sales Funnel performance chart, view the number of deals that reach each stage of the pipeline process and at which stage deals are dropping off. You can then take appropriate actions to improve the deal selection process or develop activities at each stage to increase conversion rates.
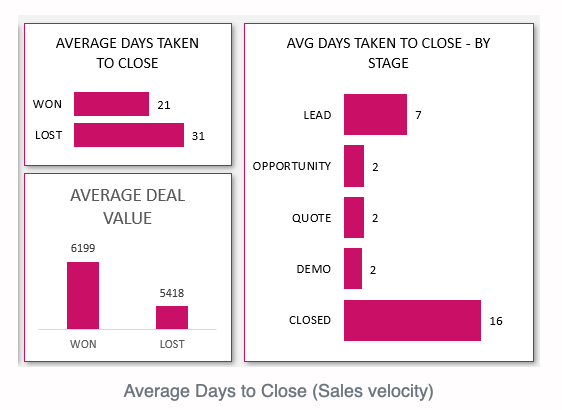
You can see the average number of days it takes to close a deal and how long each stage of the sale takes in the Dashboard feature. This will enable you to see any bottlenecks in the sales process and then improve sales cycle efficiency.
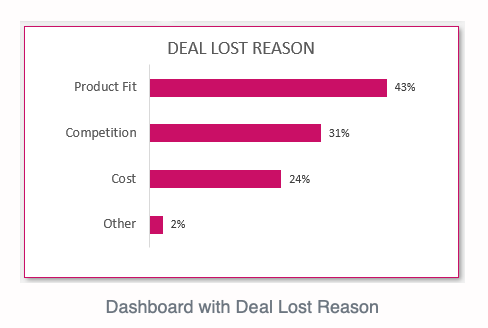
The Dashboard will also show the main reasons why deals are lost so you can improve those areas and thus the conversion rate. Filter the Dashboard by 5 different attributes and the Deal Created Month.
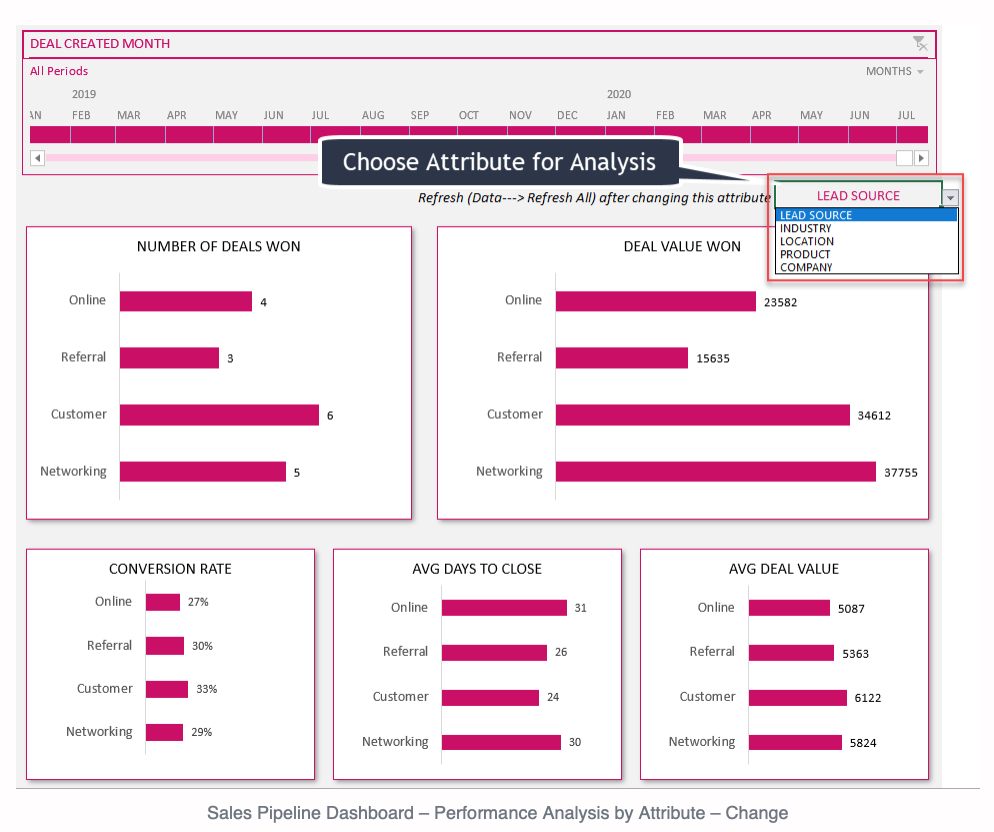
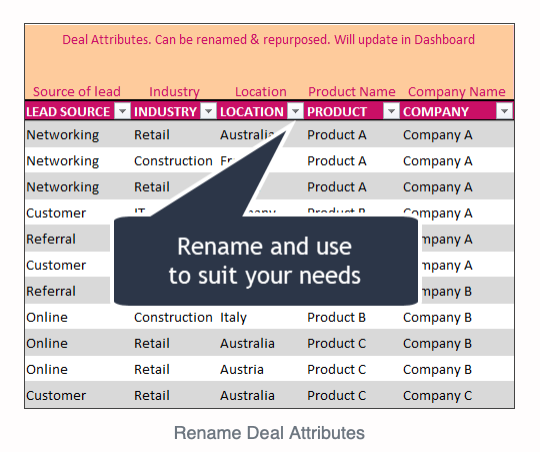
The Dashboard also enables you to see the most successful types of deals so you can continue the success in those areas. This template gives you access to valuable information to make educated decisions to increase sales. You can track 5 customizable attributes for each deal.
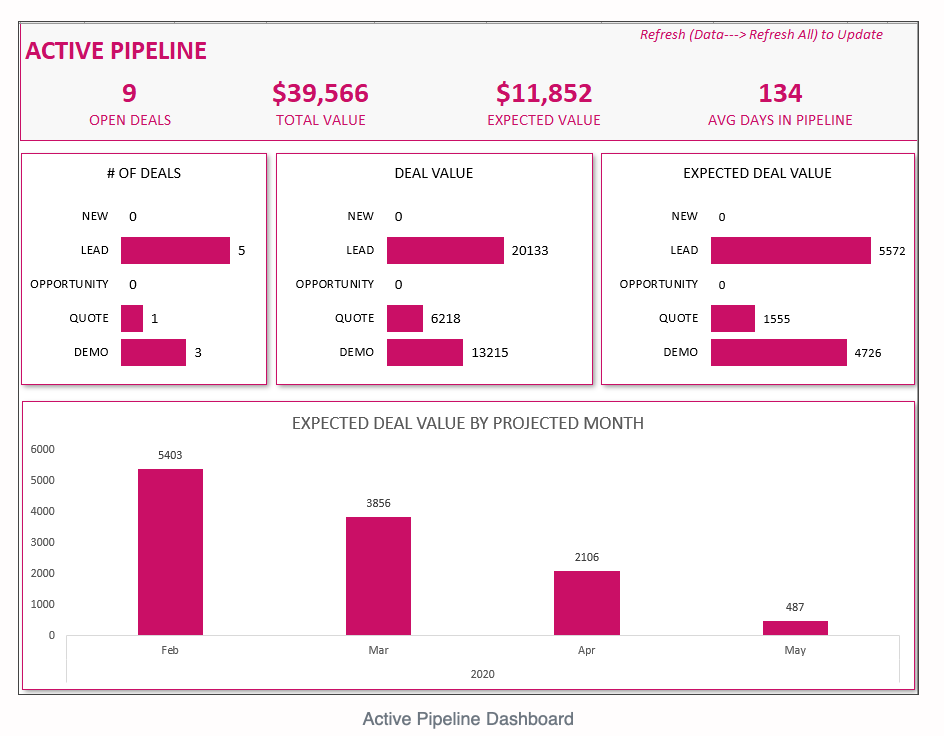
You can also view the active deals, the total deal value, and the expected deal value.
Expected Value: calculated on deal value and win % expected.
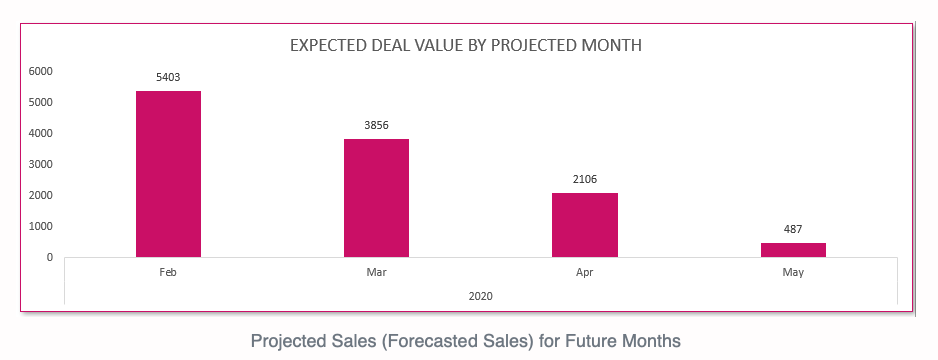
Forecasting: enter the projected closing date of current deals to show the forecasted sales.
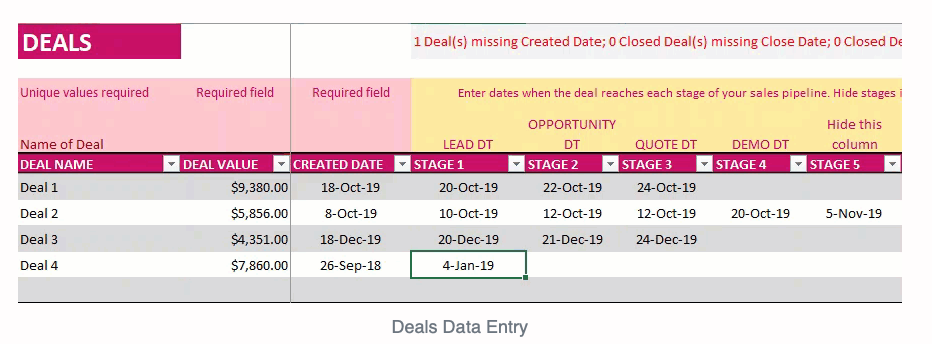
The template only requires a small amount of data input and is customizable to your needs. In data entry, customize most columns to the title of your choosing. You can also rename the stages as needed and input up to 12 total stages.
To change the size or location of each chart in the Dashboard, unlock it using the password ‘indzara’ and move/resize the charts.
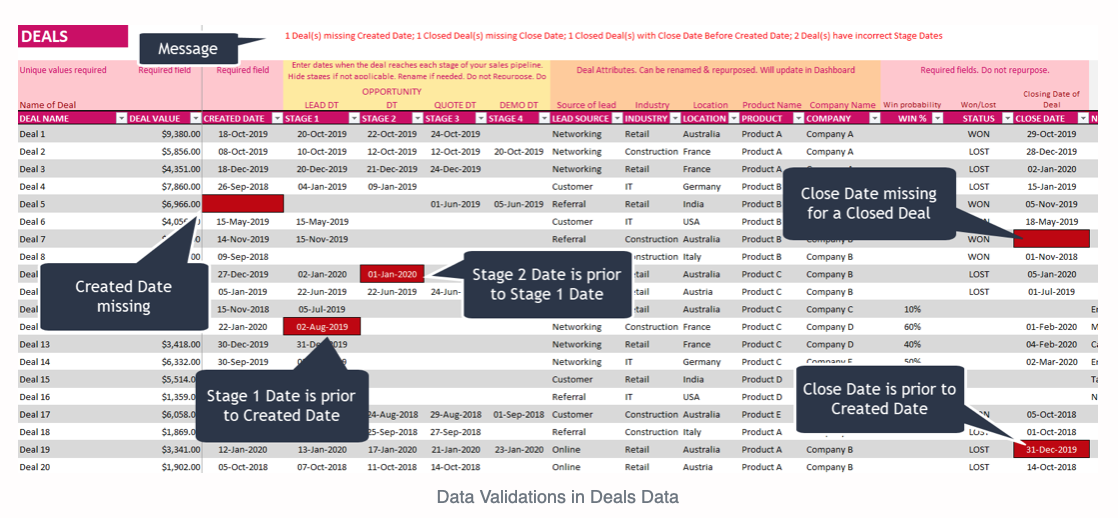
If there are errors in your data entry, a message will pop-up at the top of the Deals sheet stating the error. Red rectangles will show on the cells containing an error, and these will not be included in the Dashboard.
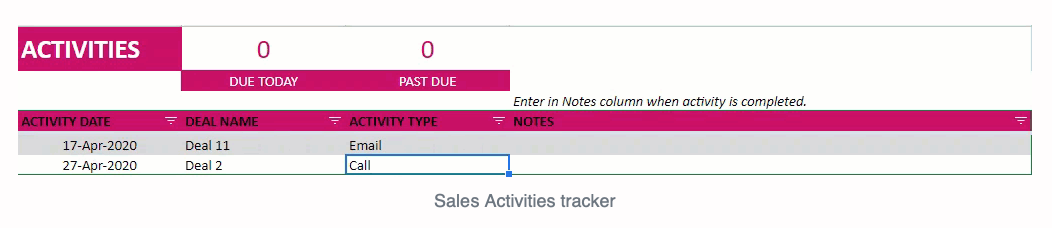
There is a small module in the template to track sales activities concerning customer and prospect communications.
Enter the Activity Date, Deal Name, Activity Type and Notes about the activity in the Activities sheet. This will be the source for your notes about sales leads. To set a reminder to complete follow-up activity, enter a future dates activity and deal name.
This easy-to-use template uses CRM Sales Software to give visibility to your sales funnel and help you to make better decisions.
The template’s benefits include:
- Gain a better understanding of your sales funnel or pipeline.
- Discover the weak areas in your sales funnel and then take relevant actions to increase conversion rate.
- Identify issues in the sales process and take actions to shorten the sales cycle.
- Understand your current active pipeline and forecast future sales.
- Gain valuable insights on the most successful types of deals and prioritize them in the future.
- Track customer relationship management activities in one file.
The template’s automated and interactive dashboard contains operational Sales Funnel KPIs. View key metrics by Won Deals, Lost Deals, Conversion Rate, Avg Days to Close Deal and Avg Deal Value.
With the Sales Funnel performance chart, view the number of deals that reach each stage of the pipeline process and at which stage deals are dropping off. You can then take appropriate actions to improve the deal selection process or develop activities at each stage to increase conversion rates.
You can see the average number of days it takes to close a deal and how long each stage of the sale takes in the Dashboard feature. This will enable you to see any bottlenecks in the sales process and then improve sales cycle efficiency.
The Dashboard will also show the main reasons why deals are lost so you can improve those areas and thus the conversion rate. Filter the Dashboard by 5 different attributes and the Deal Created Month.
The Dashboard also enables you to see the most successful types of deals so you can continue the success in those areas. This template gives you access to valuable information to make educated decisions to increase sales. You can track 5 customizable attributes for each deal.
You can also view the active deals, the total deal value, and the expected deal value.
Expected Value: calculated on deal value and win % expected.
Forecasting: enter the projected closing date of current deals to show the forecasted sales.
The template only requires a small amount of data input and is customizable to your needs. In data entry, customize most columns to the title of your choosing. You can also rename the stages as needed and input up to 12 total stages.
To change the size or location of each chart in the Dashboard, unlock it using the password ‘indzara’ and move/resize the charts.
If there are errors in your data entry, a message will pop-up at the top of the Deals sheet stating the error. Red rectangles will show on the cells containing an error, and these will not be included in the Dashboard.
There is a small module in the template to track sales activities concerning customer and prospect communications.
Enter the Activity Date, Deal Name, Activity Type and Notes about the activity in the Activities sheet. This will be the source for your notes about sales leads. To set a reminder to complete follow-up activity, enter a future dates activity and deal name.
This Best Practice includes
1 Excel Template
