Graphing Calculator in Excel
Originally published: 18/06/2024 13:37
Last version published: 08/07/2024 07:33
Publication number: ELQ-75204-4
View all versions & Certificate
certified

Graphing Calculator in Excel

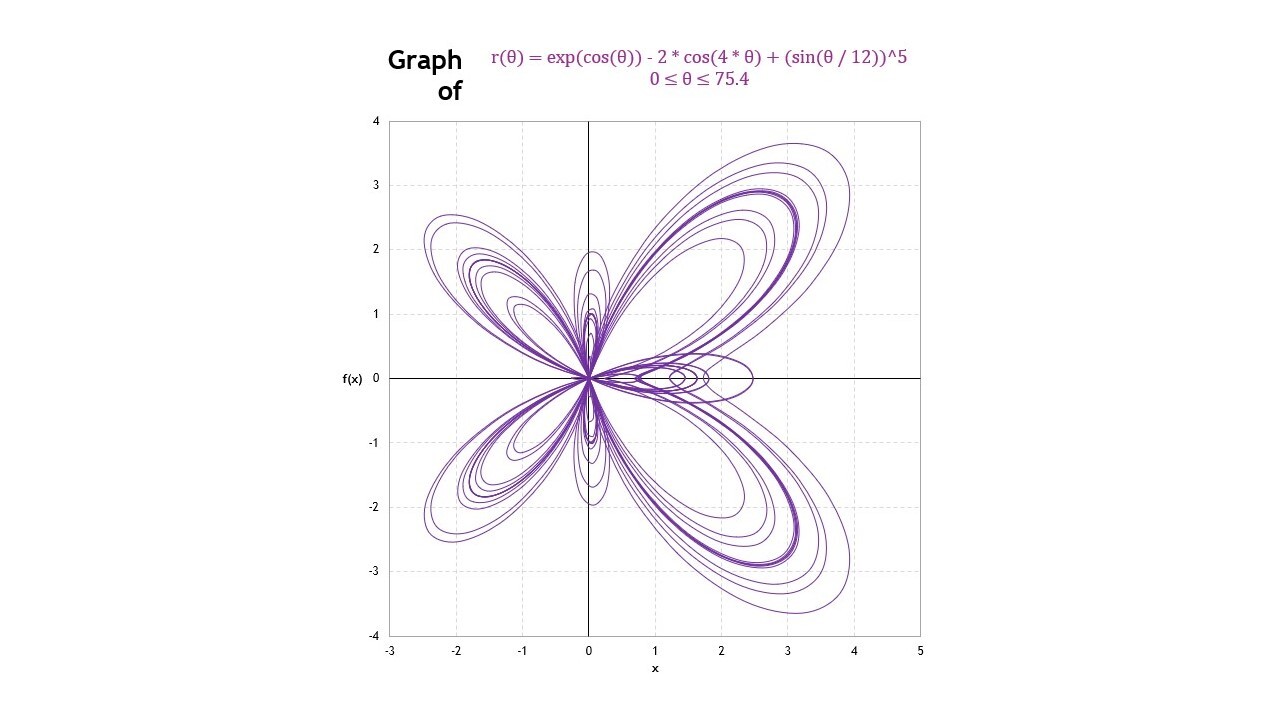
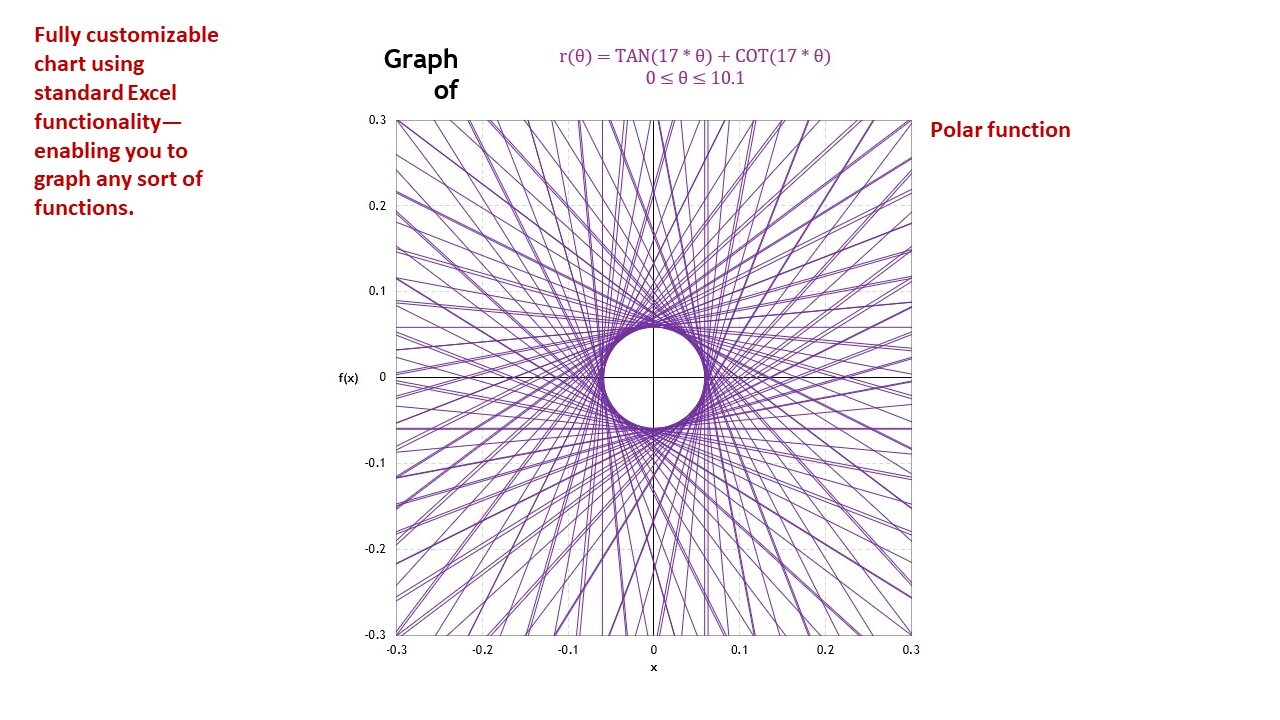
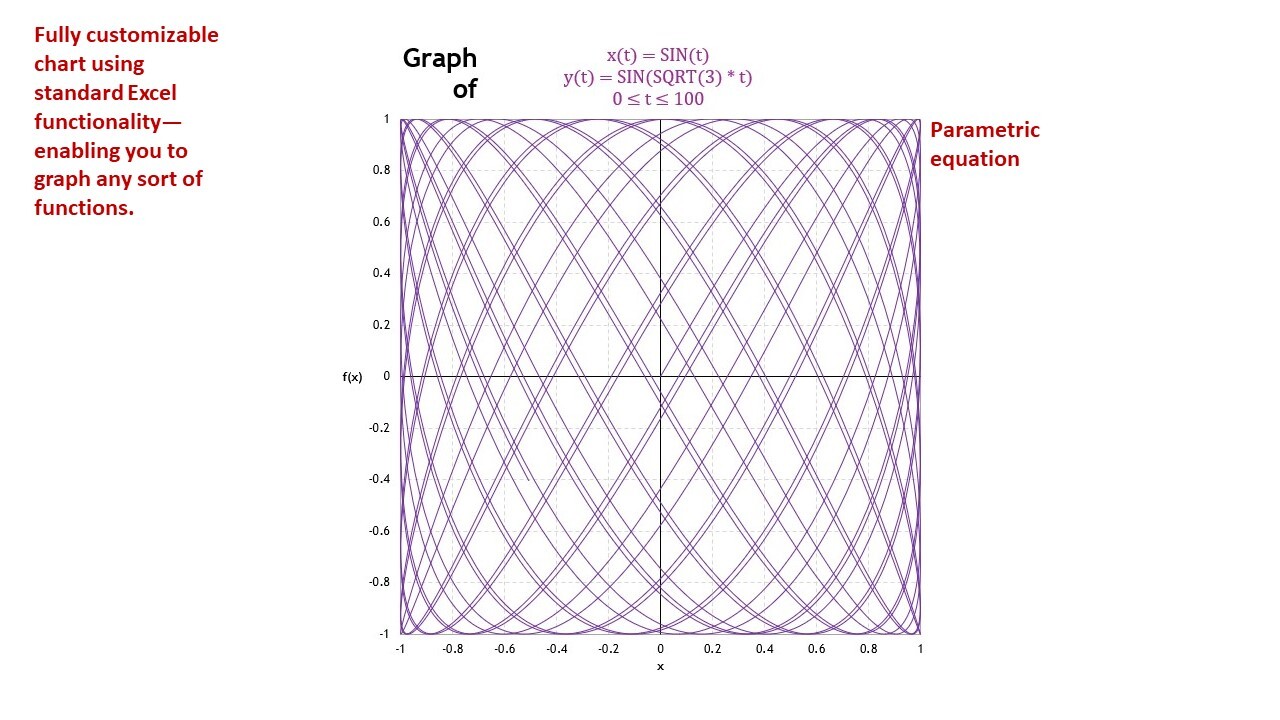
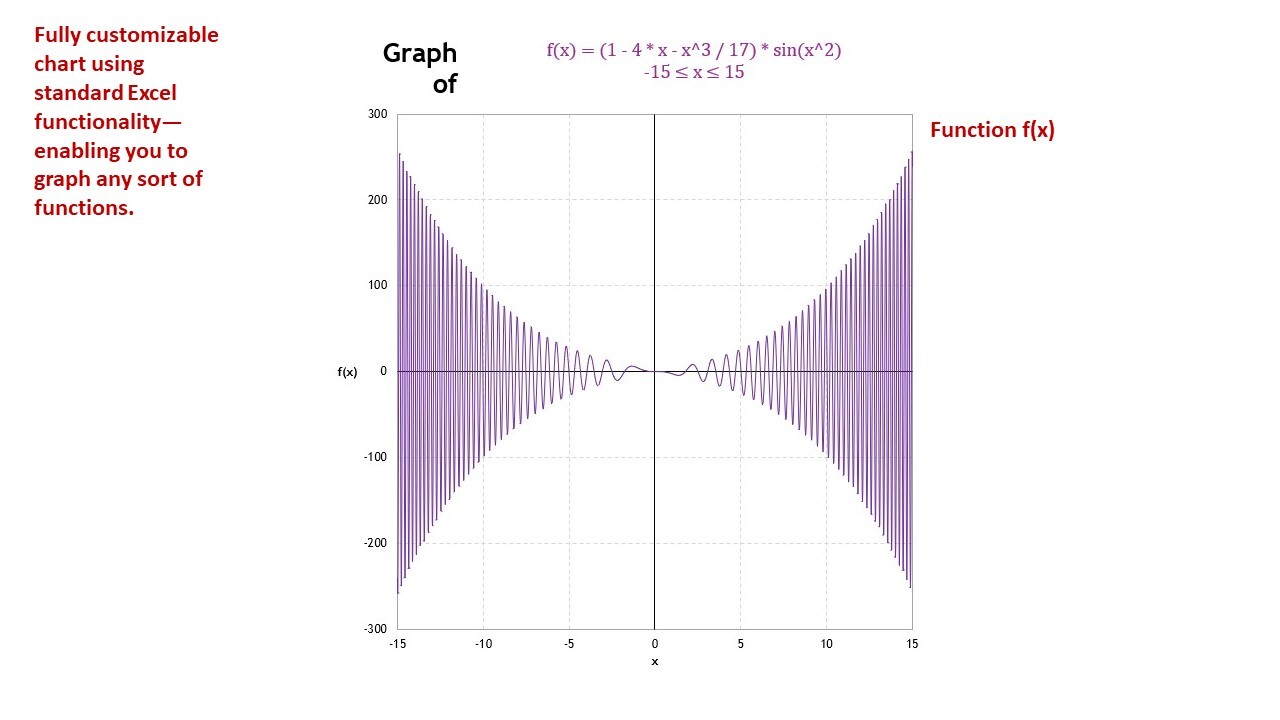
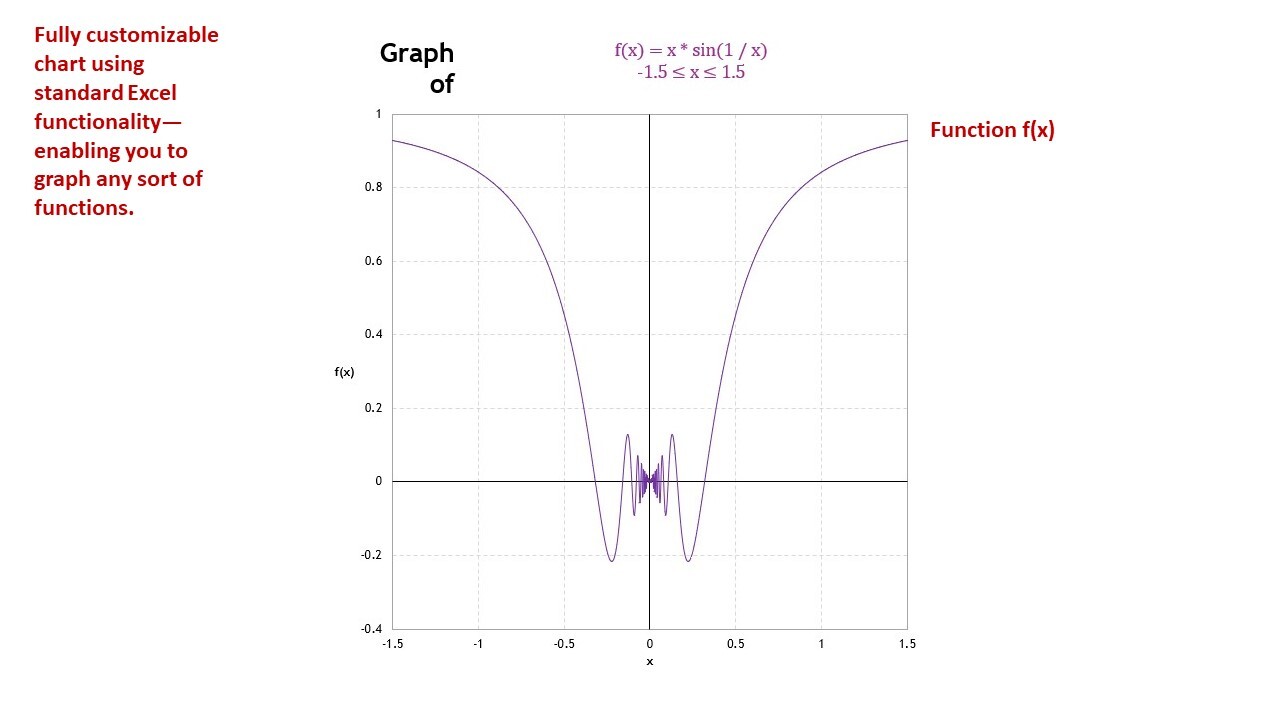
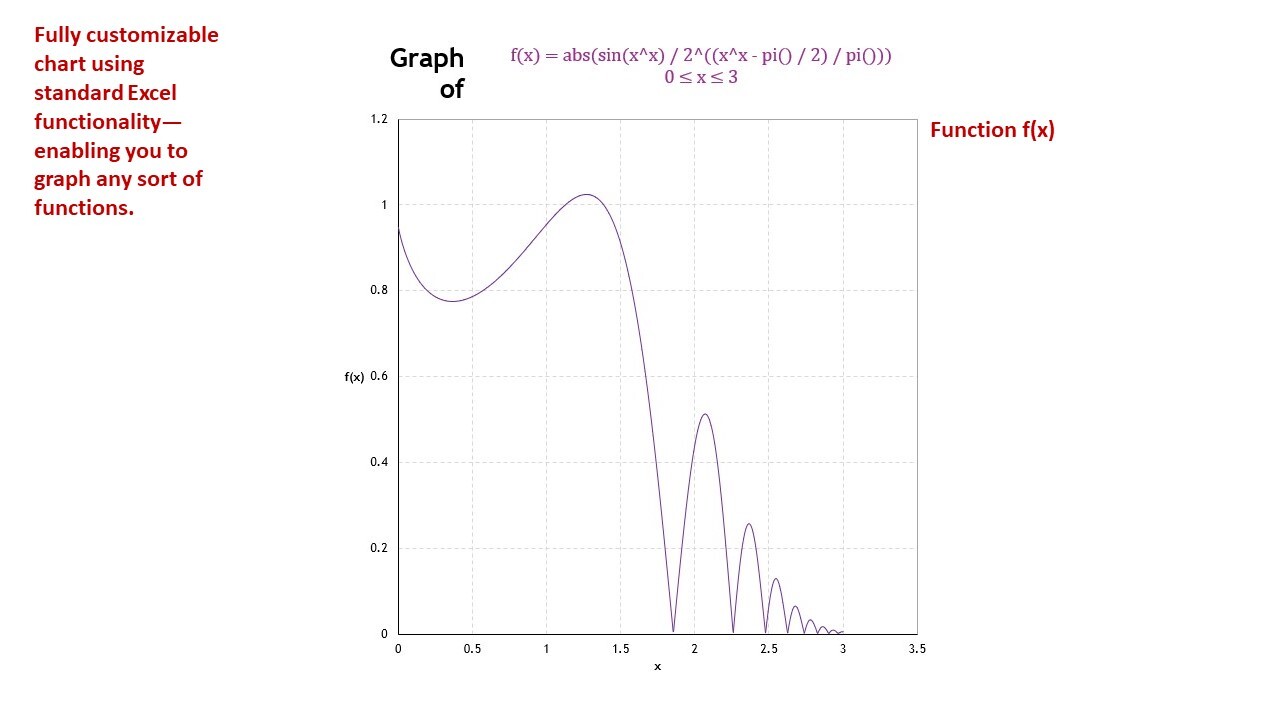
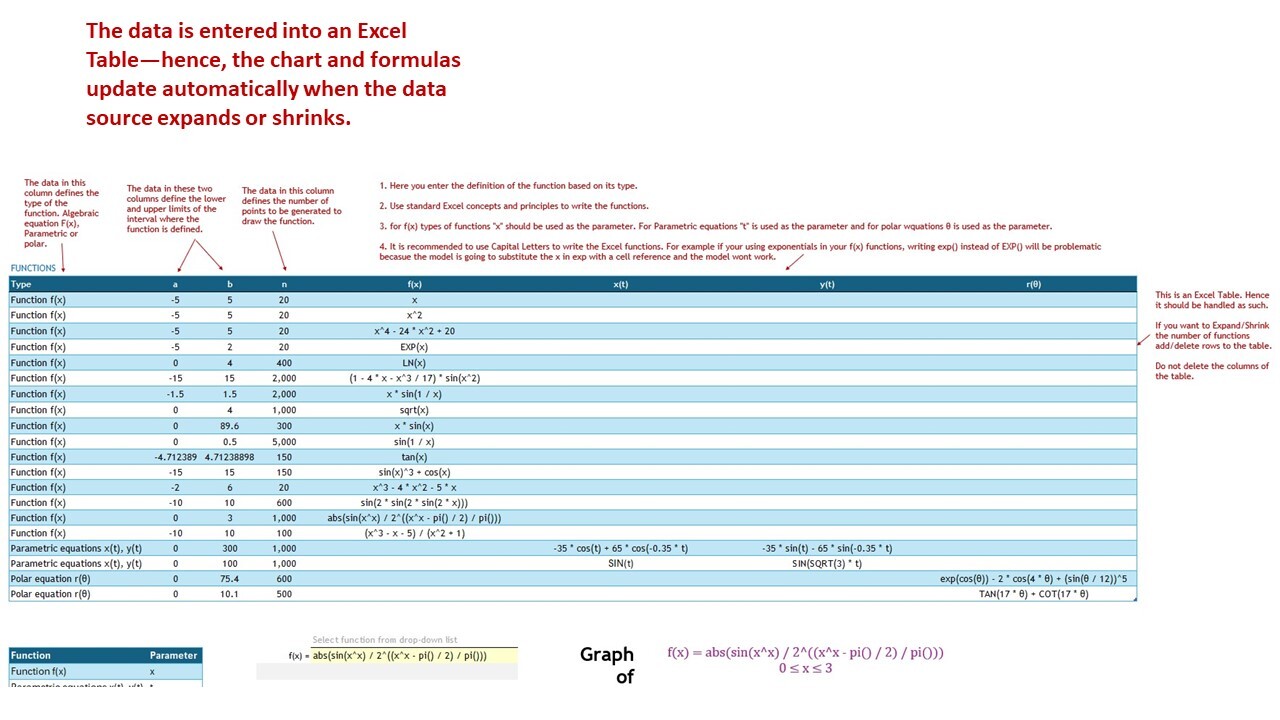
A graphing calculator in Excel to plot 2D cartesian functions f(x), parametric equations x(t), y(t) and polar equations r(θ).

Description
When you were in high school, you may have used your graphing calculator to plot math functions. It was magical typing in the equation and having the calculator instantly plotting the graph of complex functions.


But, Excel and a graphing calculator differ in how they produce graphs of functions defined by formulas. Excel can create these graphs but it’s not as straightforward as using a graphing calculator.


Wouldn't it be nice, instead, to input your function inside a cell--as in (1 - 4 * x - x^3 / 17) * sin(x^2)--and have Excel read that string of characters and plot the function--similar to a graphing calculator? Well that's what this template is going to do.


Unfortunately, Excel charting library doesn't include native capabilities to plot math functions. Users are either obliged to resort to VBA or to take the time consuming task of following a long list of steps to create one.


So here I'm offering you an Excel template that takes a data set of functions as an input and plot the functions by selecting them from a dropdown list.


The Excel model has the following capabilities:


- Graph 2D cartesian functions of the type f(x).

- Graph 2D parametric equations x(t),y(t).
- Graph 2D polar equations r(θ).
- Define the lower and upper bounds for the interval where the function is defined.
- Define the number of points required to plot the function.
- The functions are defined using standard Excel concepts and principles for writing formulas.
- User-friendly interface to adjust the above settings.
- Data entered into Excel Table—hence the chart and formulas update automatically when the datasource expands or shrinks.
- The size of the data matrix is only limited by Excel's charting and calculating capabilities.
- Fully customizable chart using standard Excel functionality.
- Unlocked workbook/worksheets with ability to expand template to suit your needs.


What's the refund policy?

If what you see is not what you expected, just reply to the download email within 30 days, and you'll get a full refund. No questions asked.

NOTE: THE TEMPLATE RELIES HEAVILY ON EXCEL'S DYNAMIC ARRAYS CAPABILITIES, ONLY AVAILABLE TO MICROSOFT 365 SUBSCRIBERS.


ALSO, THE MODEL USES THE EVALUATE() FUNCTION THAT IS AN EXCEL 4.0 MACRO. HENCE, THE FILE IS SAVED IN .XLSM FORMAT FOR IT TO WORK. FOR THE MODEL TO WORK ON YOUR COMPUTER THE MACRO SETTINGS ON YOUR SYSTEMS SHOULD CHECK THE ENABLE EXCEL 4.0 MACROS WHEN VBA MACROS.

This Best Practice includes
1 Excel model

Acquire business license for $25.00

Add to cart

Add to bookmarks

Discuss

Further information

To enable students, teachers and scientists to graph polar equations r(θ), parametric equations x(t), y(t) and functions of the type f(x) in Excel.

Calculus, math, mathematics, graphing polar, parametric and f(x) functions.

Template relies heavily on Excel's Dynamic Arrays capabilities, only available to Office 365 subscribers. Also, the model uses the EVALUATE() function that is an Excel 4.0 Macro. Hence, the file is saved in .xlsm format for it to work. For the model to work on your computer the Macro settings on your systems should check the Enable Excel 4.0 macros when VBA macros.


0.0 / 5 (0 votes)

please wait...