I build tools that make data analysis, data visualization and real estate investment analysis easier, faster and more fun. Follow

- views 17k
- downloads 61
- reviews 20
- Downloadable Best Practices 19
Hicham Bou Habib
I build tools that make data analysis, data visualization and real estate investment analysis easier, faster and more fun.
Discuss with Hicham Bou Habib!
Follow


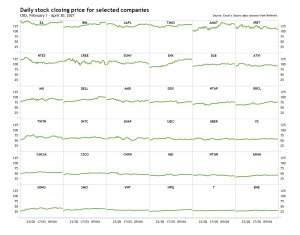
Small Multiple of Bar Graphs or Line Charts in Excel (Trellis / Coplot)
Excel template to build a Small Multiple of Bar Graphs or Line Charts—in one chart—for ease of analysis and formatting.1,095Discussadd_shopping_cart$20.00Dynamic Scatterplot in Excel
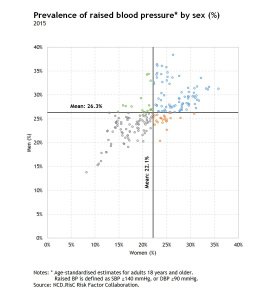
Excel template to build a dynamic scatterplot along with the statistical model and the 6-Plot charts needed for assessment of the fit of regression analysis.460Discussadd_shopping_cart$10.00One-dimensional Scatterplot with Jitter in Excel
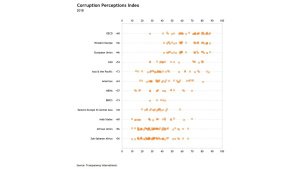
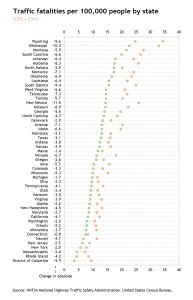
Excel/PowerPoint template to build 1-dimensional scatterplots—with jitter—to show distributions for several categories.1,111Discussadd_shopping_cart$10.00Dot plot / Dumbbell and Lollipop charts in Excel
Excel/PowerPoint template to create Dot Plots, Dumbbell and Lollipop charts to rank one or two data series.1,548Discussadd_shopping_cart$10.0050 charts in PowerPoint
PowerPoint template to build 50 practical chart types--common in business.387Discussadd_shopping_cart$50.00The Box and Whisker plot in Excel
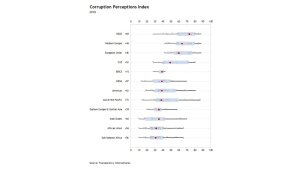
Excel template to build Box plots with 1-dimensional scatterplots—with jitter—to show and compare distributions for several categories.290Discussadd_shopping_cart$10.00Bar Chart With Color Ranges In Excel
Excel/PowerPoint template to build a bar graph with color ranges of bars representing another dimension in the data.662Discussadd_shopping_cart$10.00Non-ribbon Sankey Diagram in Excel
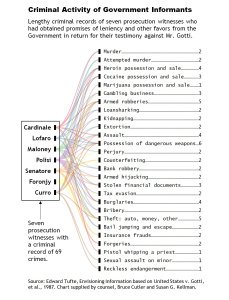
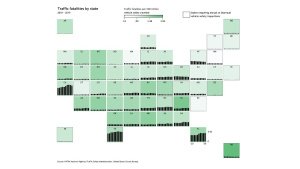
Excel template to create a Non-ribbon Sankey Diagram used to depict connections between one dataset and another.1,043Discussadd_shopping_cart$10.00Tile Grid Map in Excel with Sparklines
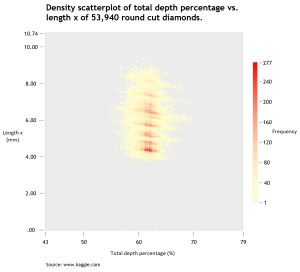
Excel template to create Tile Grid Maps with Sparklines to display up to three variables.419Discussadd_shopping_cart$25.00Density Scatterplot in Excel
Excel template to build a Density Scatterplot to solve the problem of over-plotting in statistical graphs.1,190Discussadd_shopping_cart$10.00Step Chart in Excel
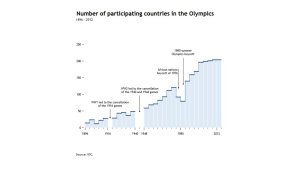
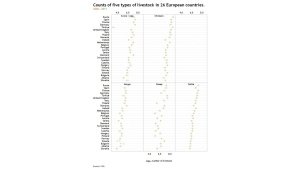
Excel/PowerPoint template to produce Step/Bar Charts to show trends over time.321Discussadd_shopping_cart$10.00Multiway Dot Plot in Excel
Excel template to build a Multiway Dot Plot—in one chart—for ease of analysis and formatting.246Discussadd_shopping_cart$20.00Cycle Plot in Excel
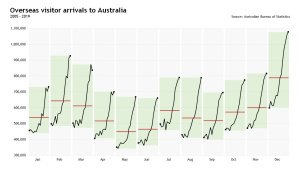
Excel/PowerPoint template to build Cycle Plots, Run Sequence Plots and Graph Envelope Overview to detect seasonality.866Discussadd_shopping_cart$10.00Arrow Chart in Excel
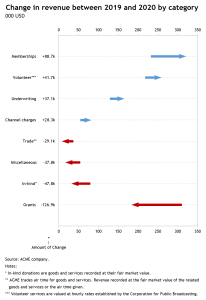
Excel/PowerPoint template to create Arrow Charts (Range bar graph) to show change between two points in time.858Discussadd_shopping_cart$10.00Slopegraph in Excel
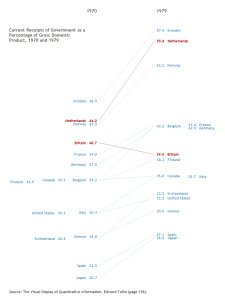
Excel/PowerPoint template to create Slopegraph to show change between two points in time.598Discussadd_shopping_cart$10.00Calendar Chart in Excel
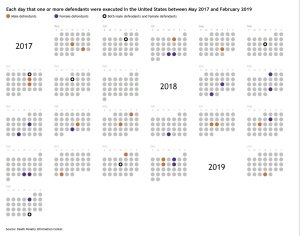
Excel template to create a Calendar Chart to highlight important dates for up to 3 variables over time.488Discussadd_shopping_cart$10.00