Last version published: 03/04/2017 10:30
Publication number: ELQ-77668-15
View all versions & Certificate

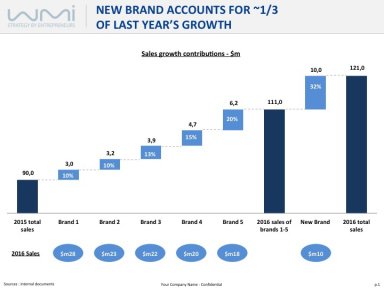
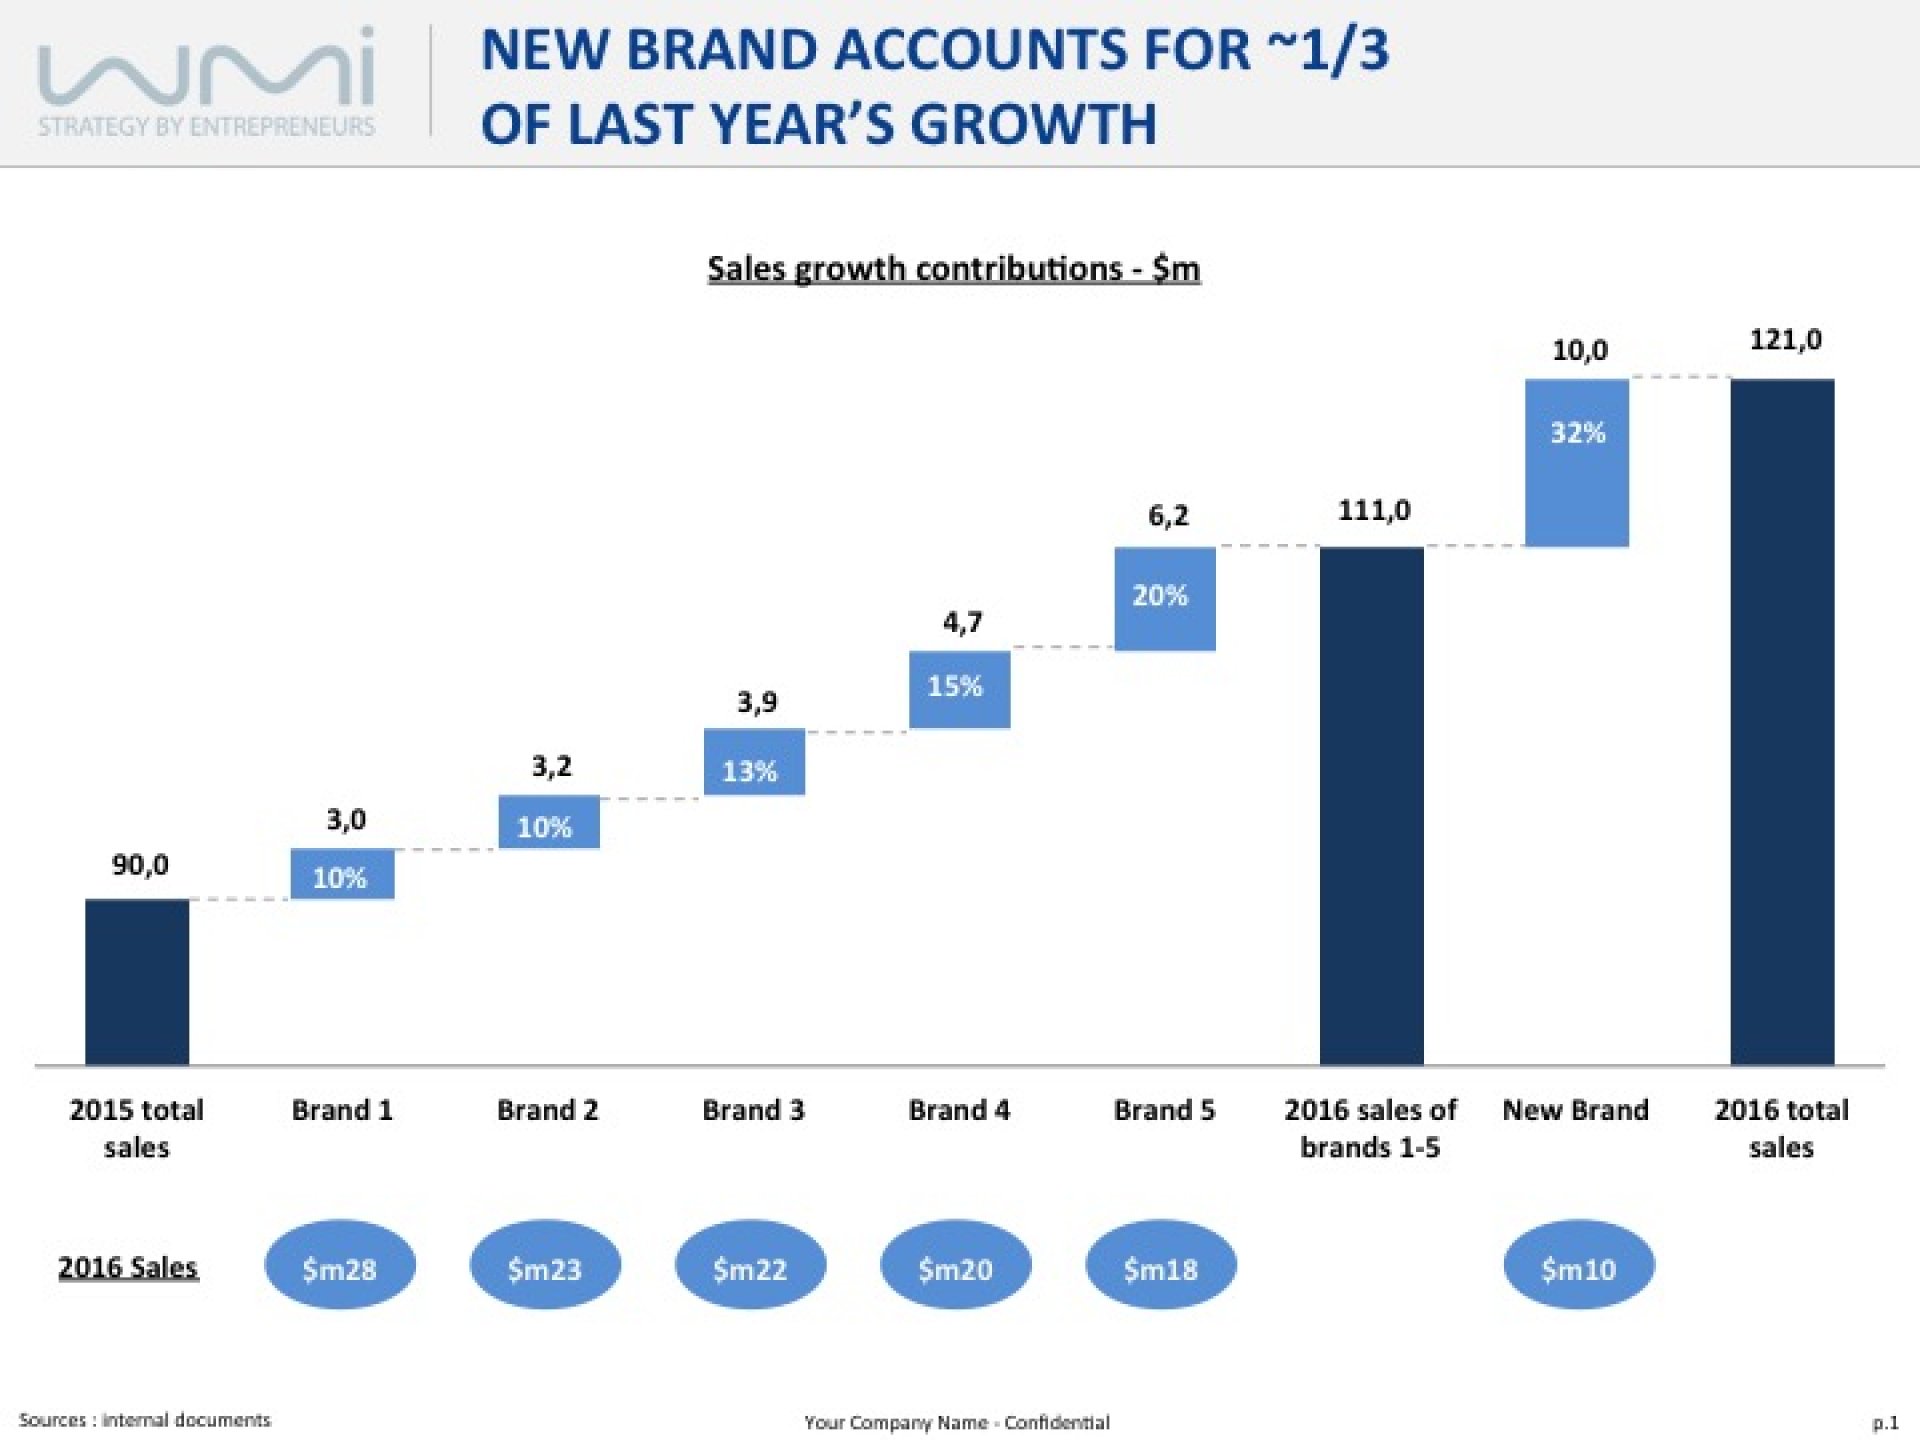
Sales growth contribution
Produce a bridge graph that shows your individual brands' contribution to overall sales growth.
Deputy Director #MBADMB EFAP | Strategy consulting & marketing @AdVentures Startup Studio (incl. Wimi)Follow
Further information
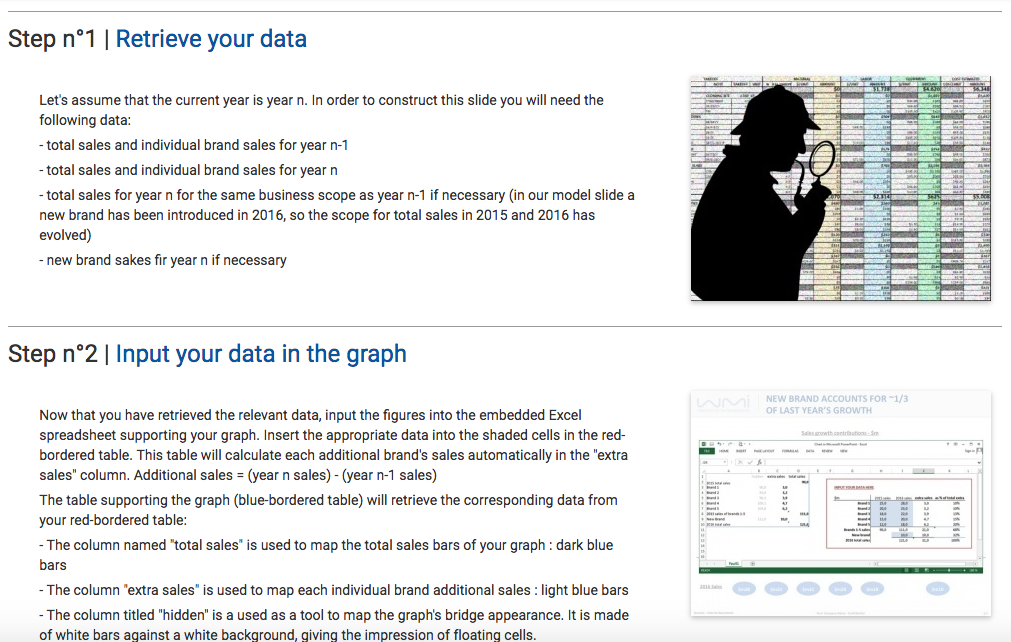
Objectives:
On top of showing your audience that your portfolio of brands as a whole has grown this year, visually demonstrate each brand's individual contribution to this growth. This slide allows you to display a variety of numbers graphically, allowing for better communication and understanding of your figures.
Expected Impact:
• Capture the attention of your audience with a readable and straightforward graphic
• Communicate a multitude of key figures in an aesthetically pleasing format
• Give a fresh perspective to your usual sales analysis
• Efficiently convey each brand's worth in your sales growth graph
• Create an efficient visual aid to your sales presentations
Insert in:
• Marketing plan
• Budget planning presentations
• Due diligence
• Market studies
Main sources:
• Your previous yearly results
• Budgets and business planning documents
• Your own vision and strategy
• You manage a portfolio of several brands
• You want to display one year's worth of sales figures
• You wish to detail the growth contribution of each of your brands
• You would rather communicate using charts rather than tables of numbers
• Your business cannot be separated into independent brands or units
• You want to display figures in greater detail
• One or more of your brands has experienced a sales decrease
• You want to report sales spanning over more than 12 months
