


Originally published: 02/05/2018 10:06
Publication number: ELQ-77705-1
View all versions & Certificate
Publication number: ELQ-77705-1
View all versions & Certificate

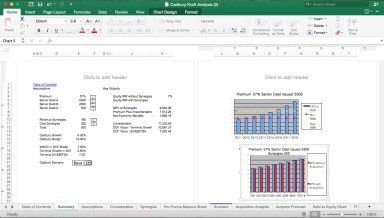
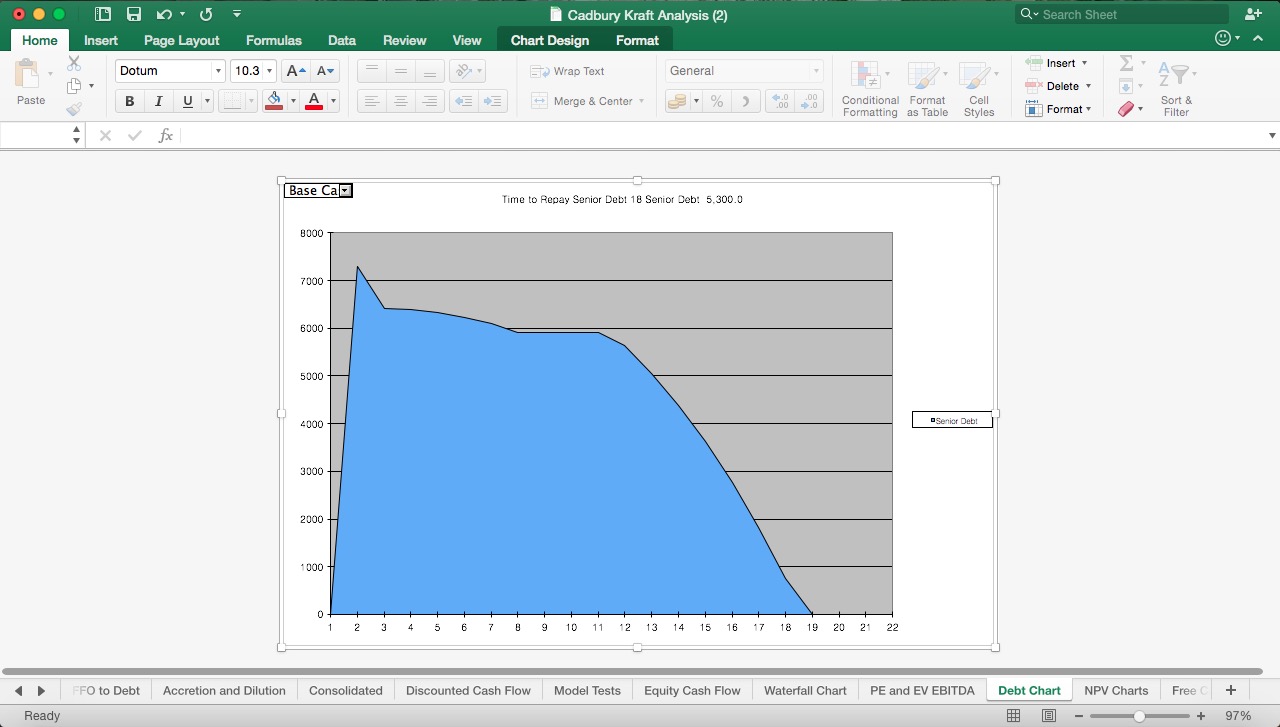
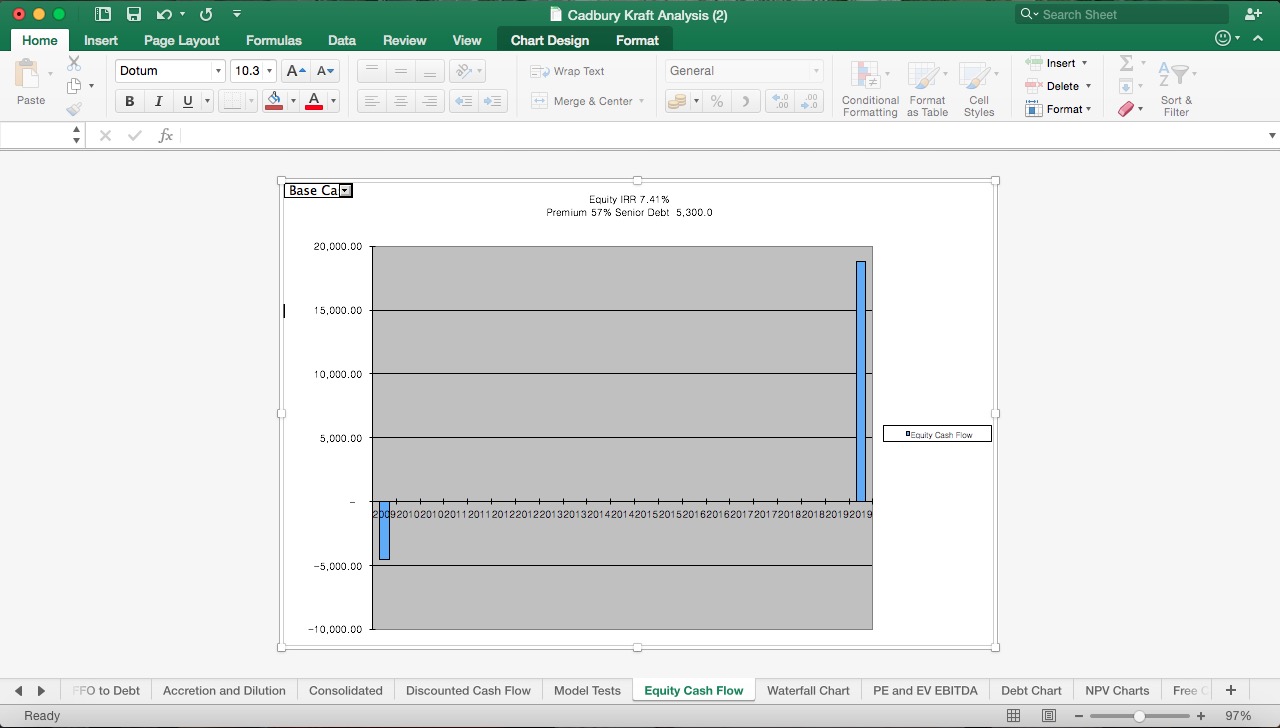
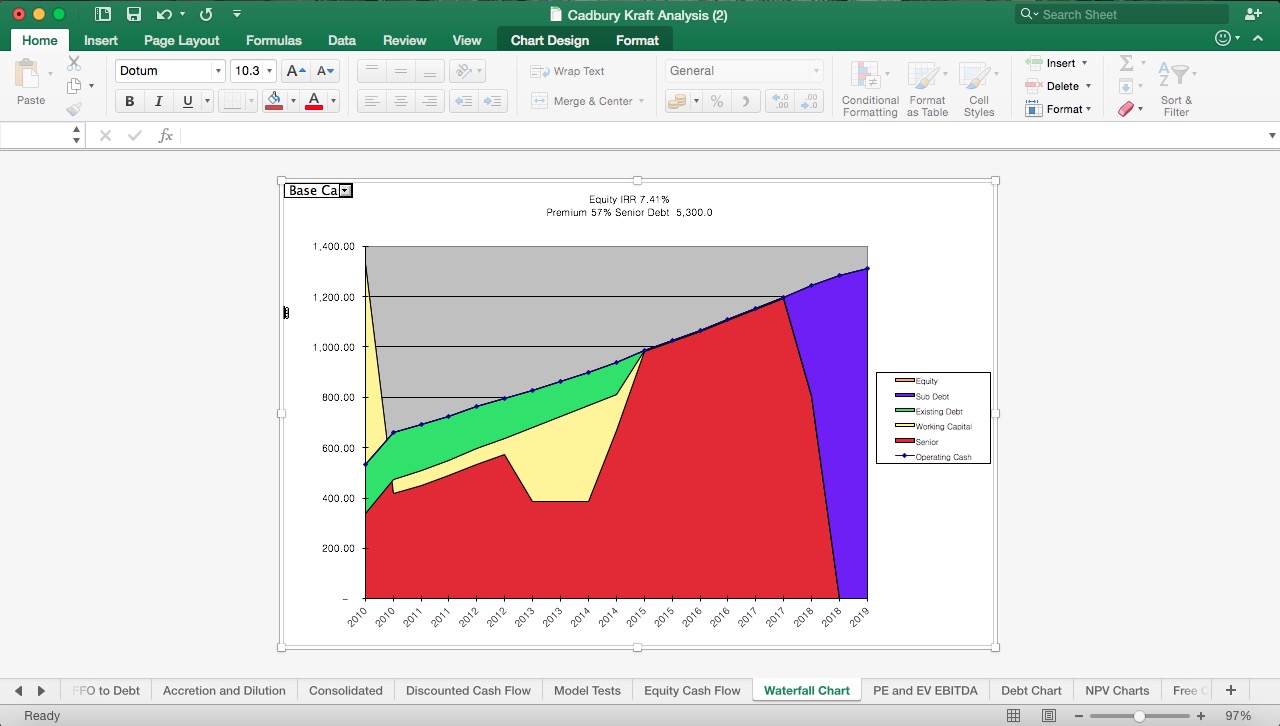
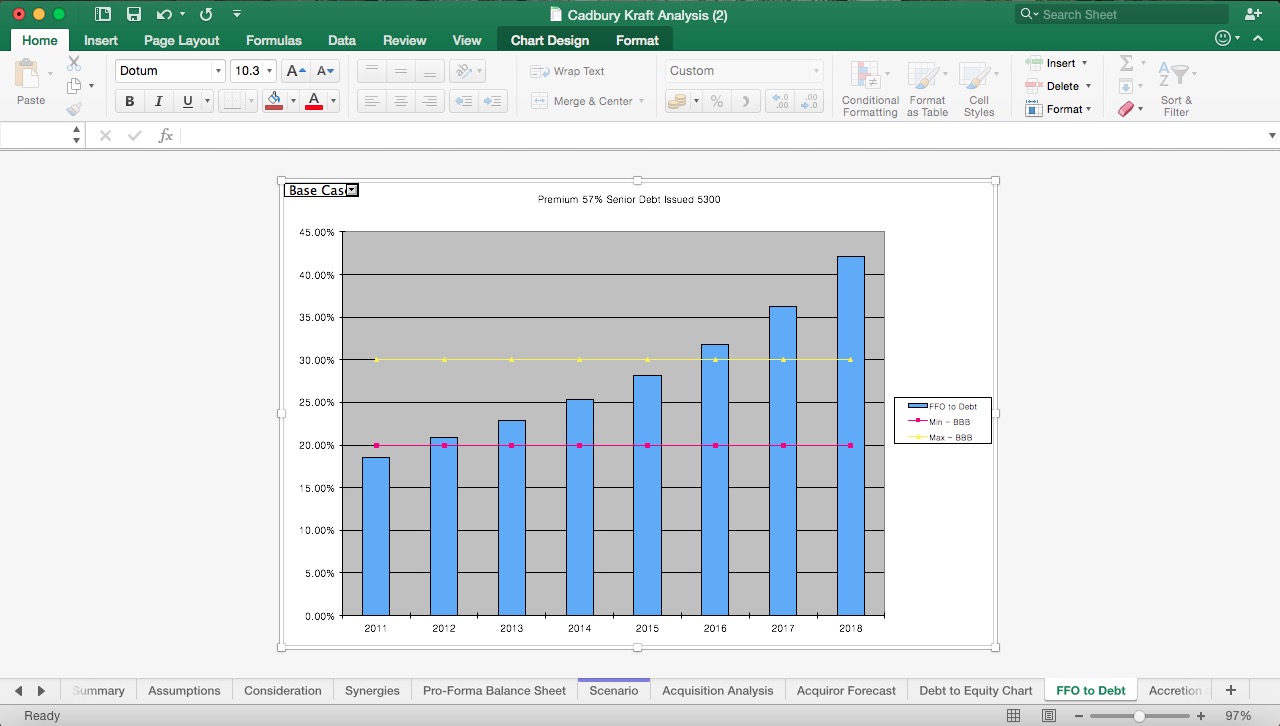
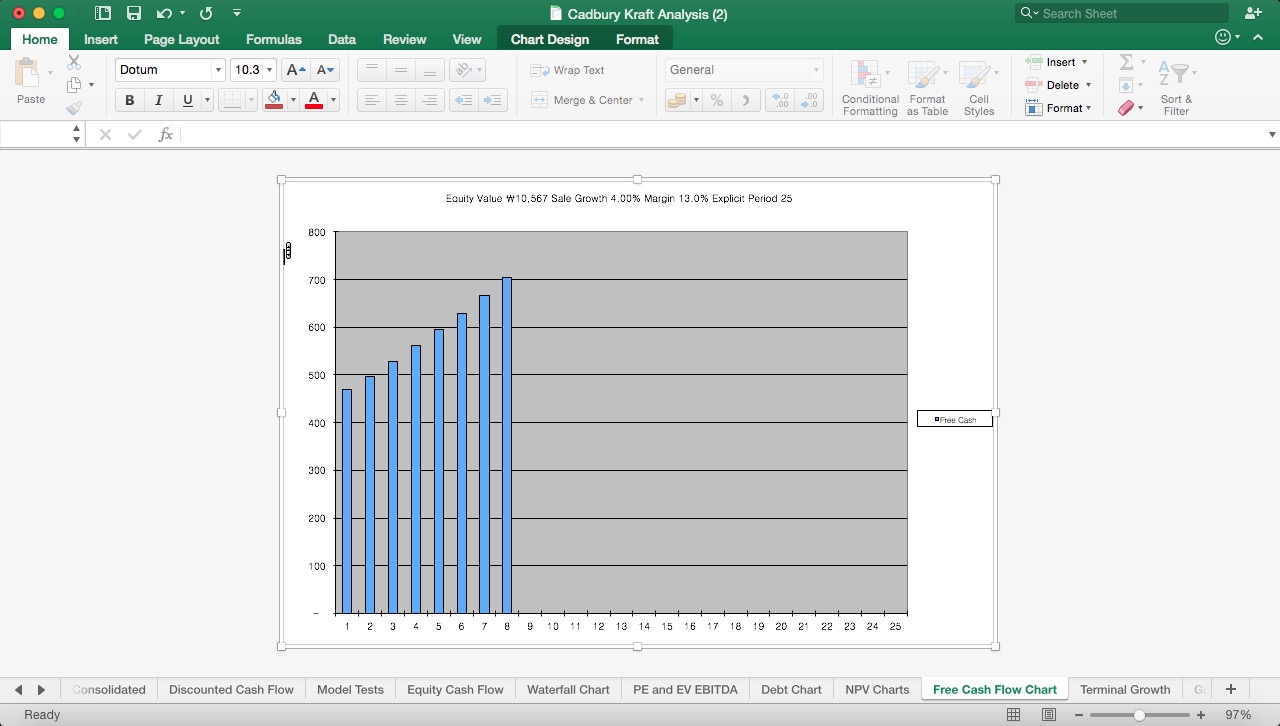
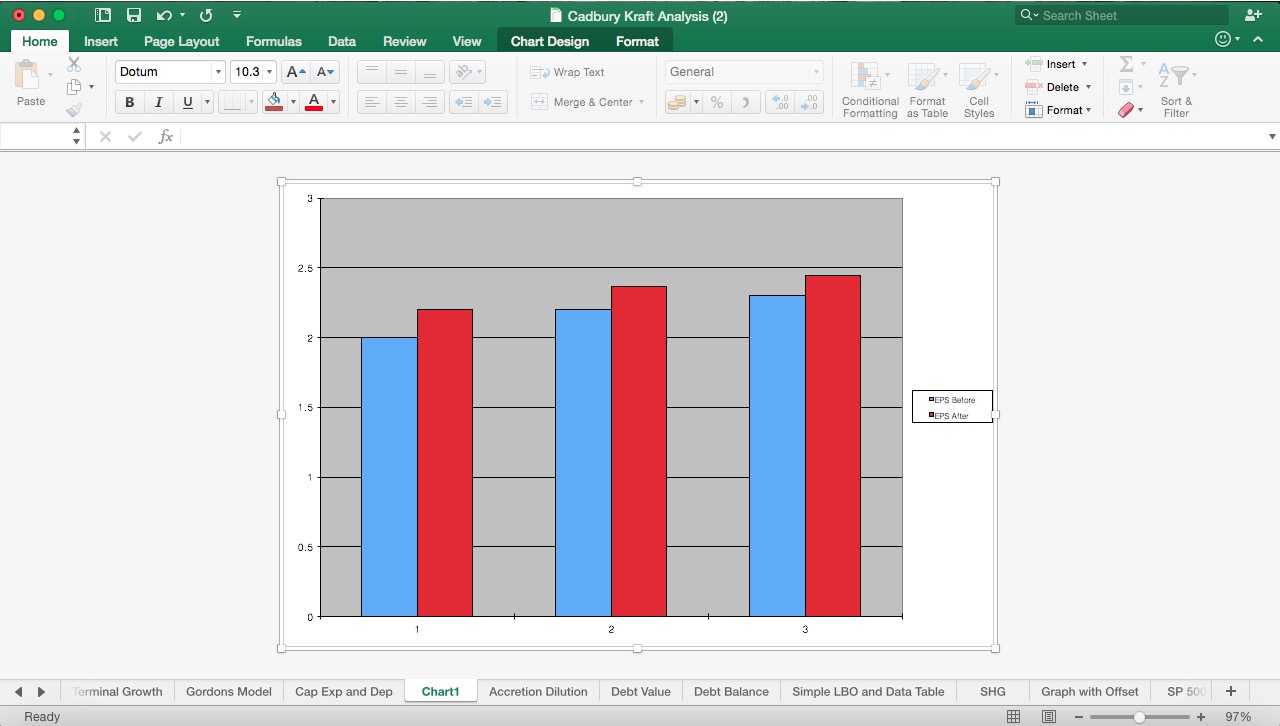
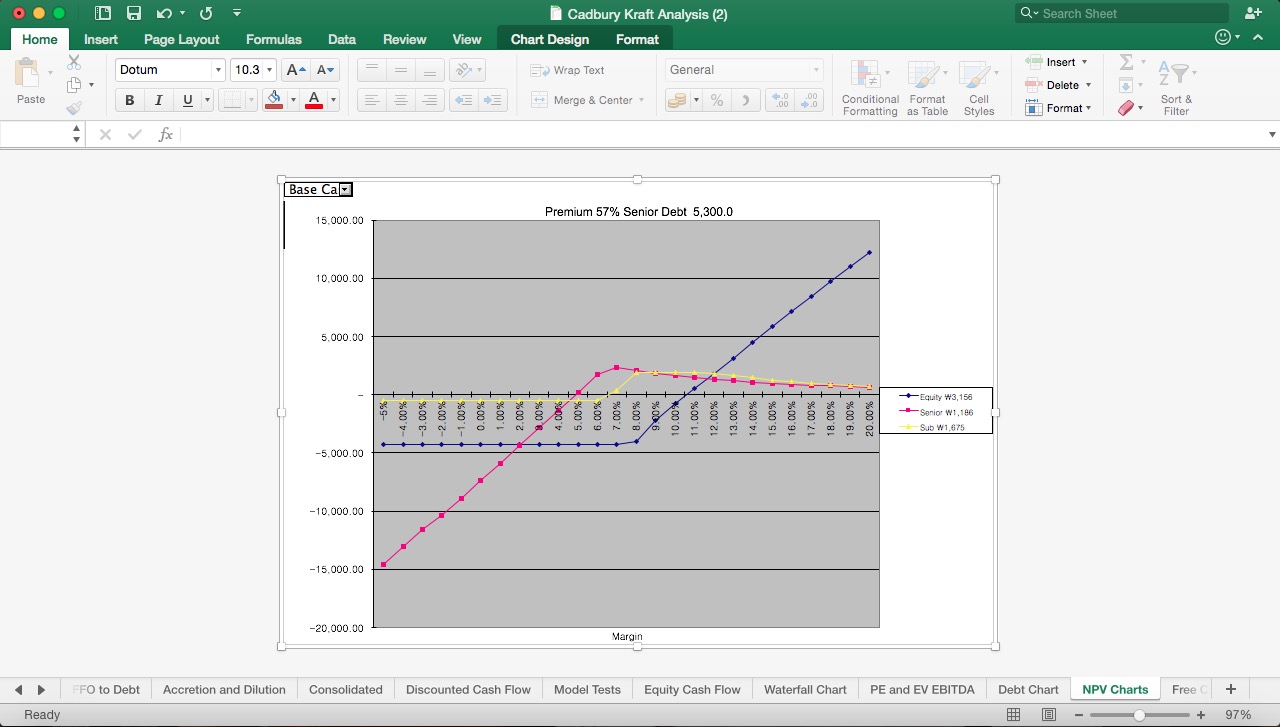
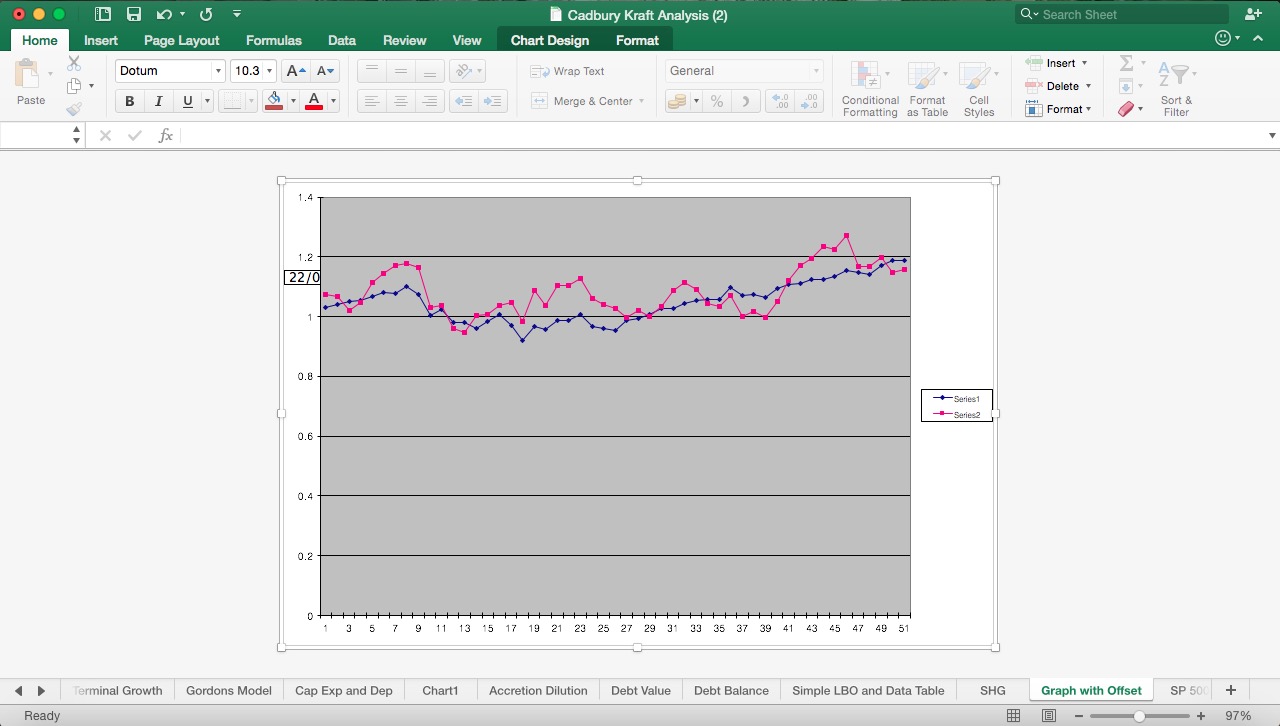
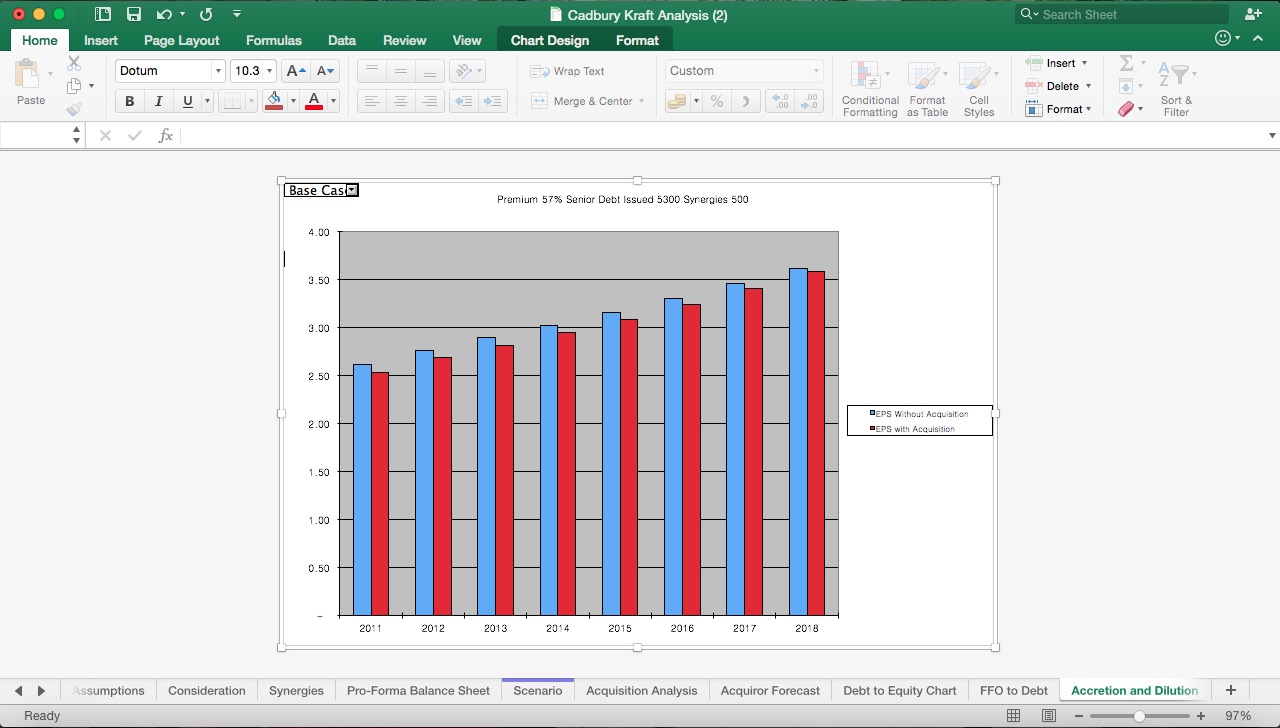
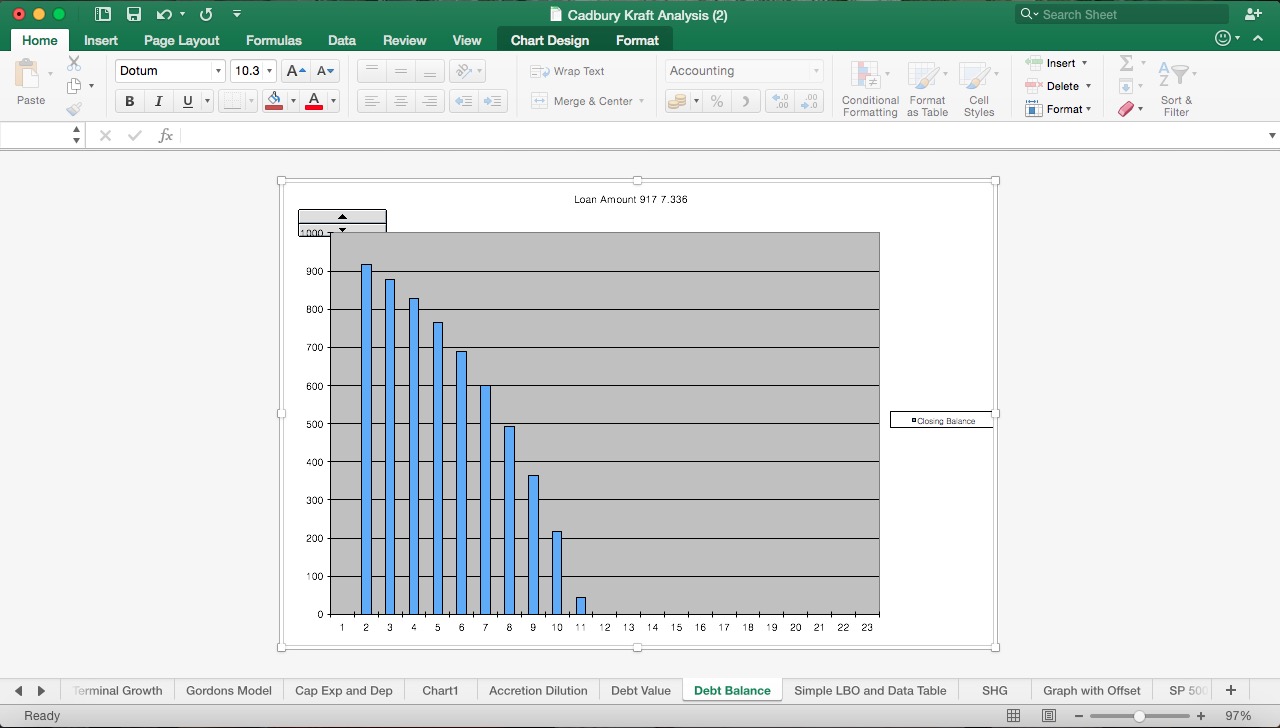
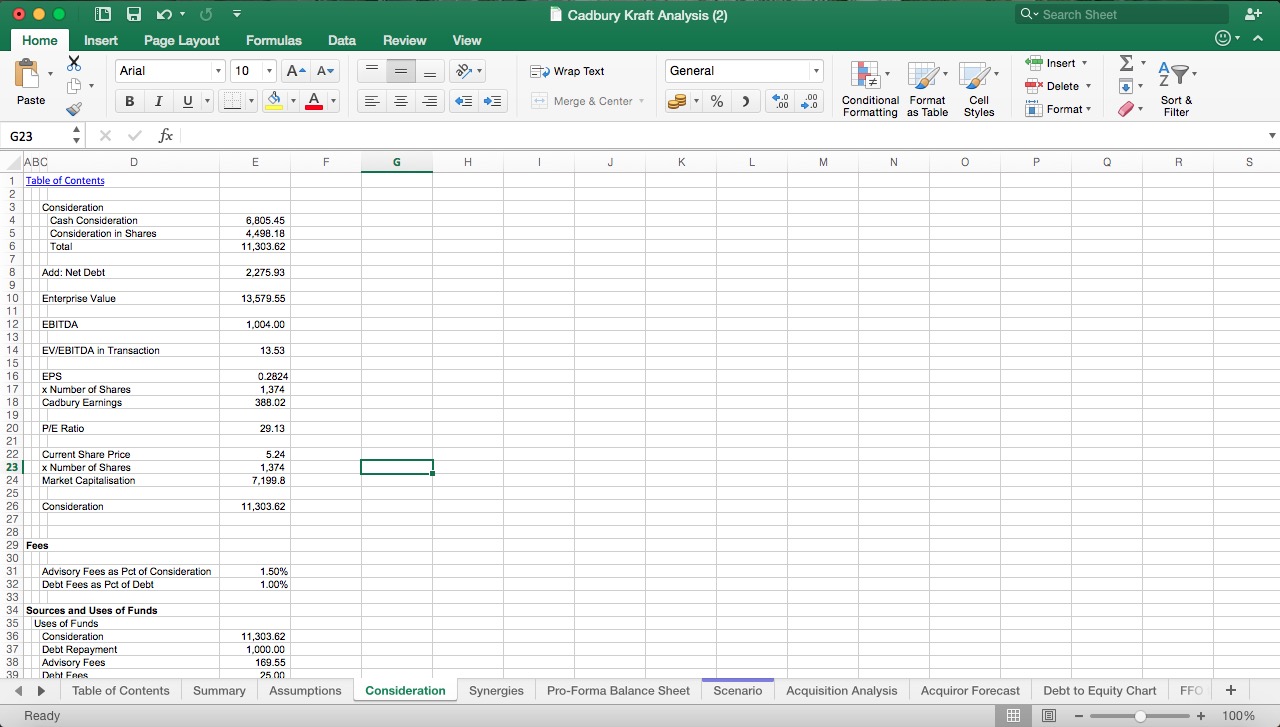
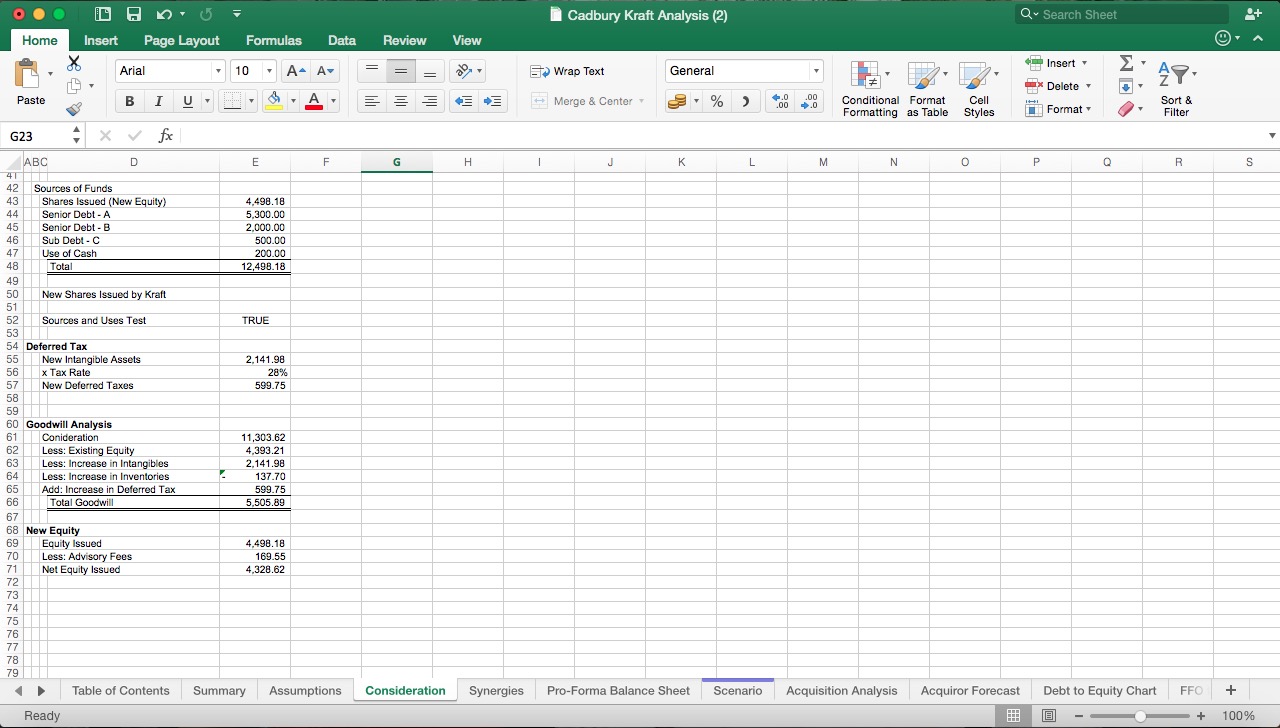
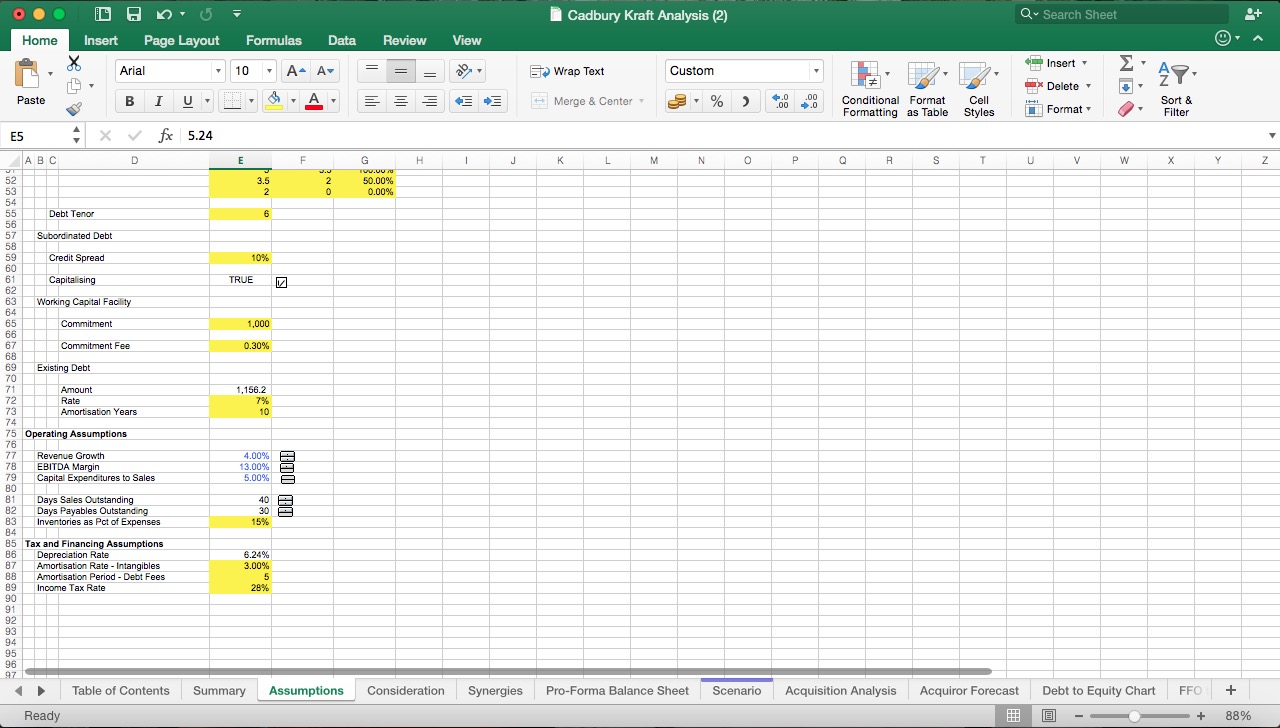
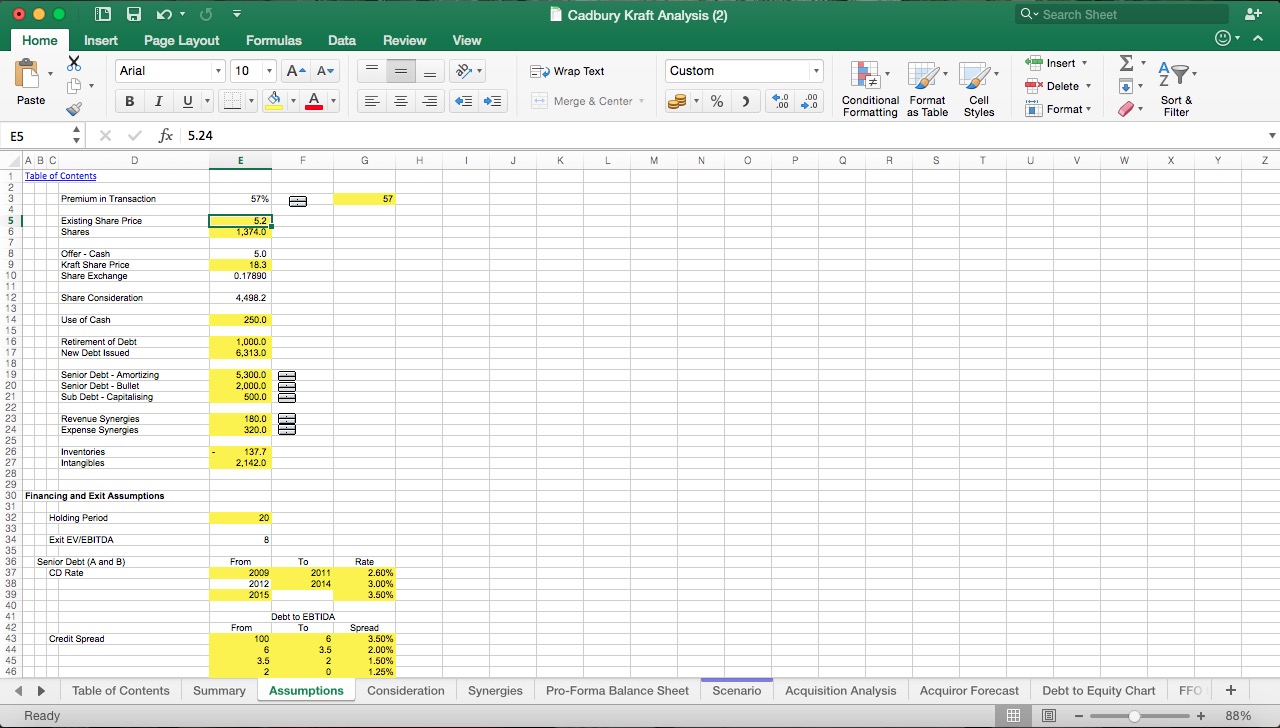
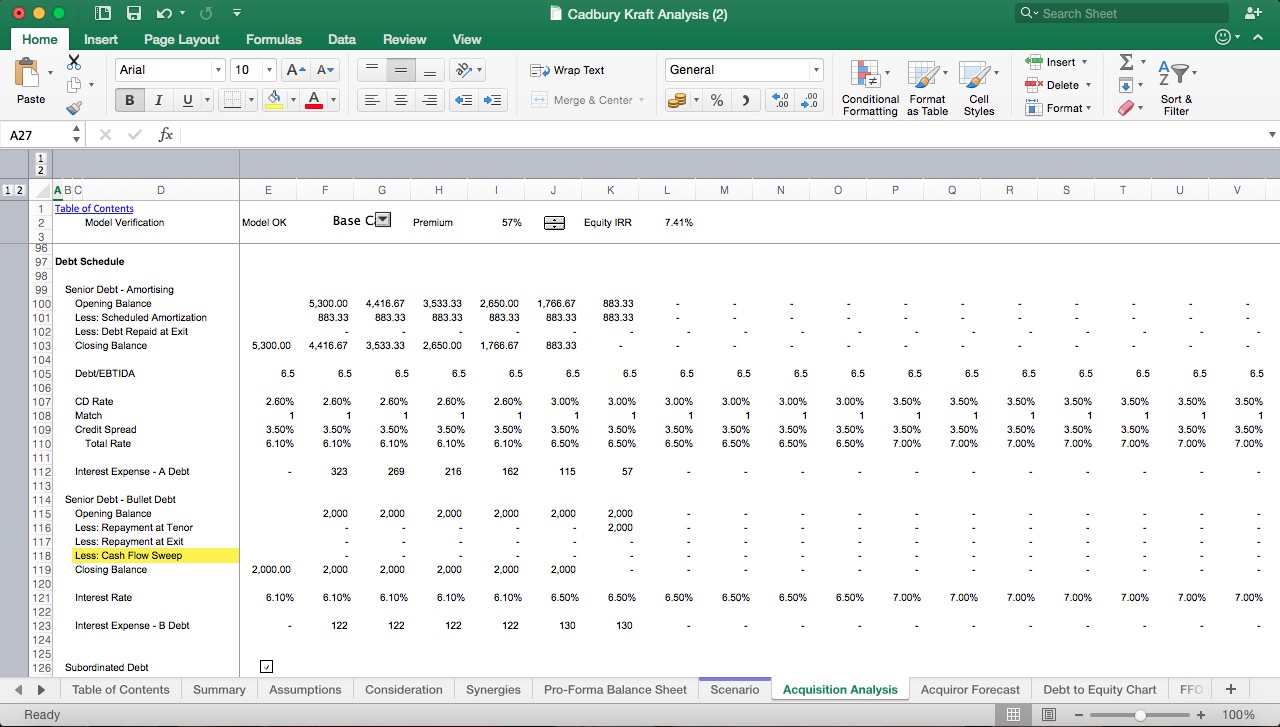
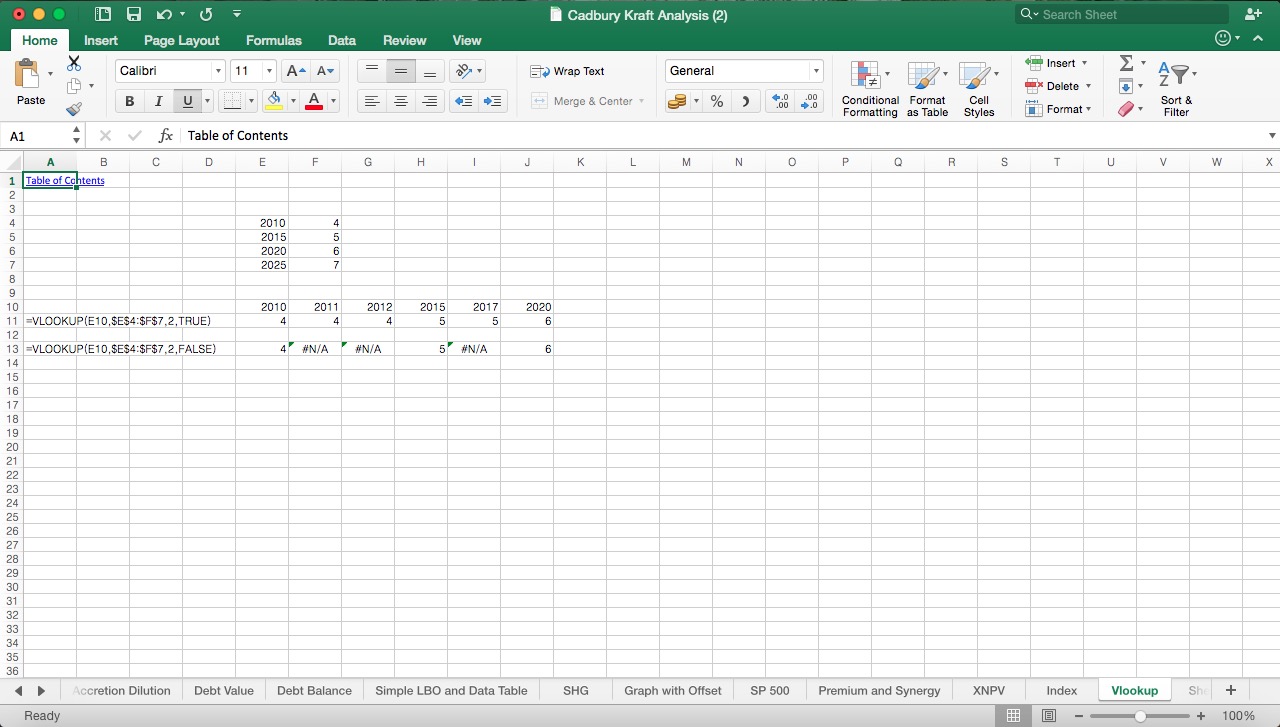
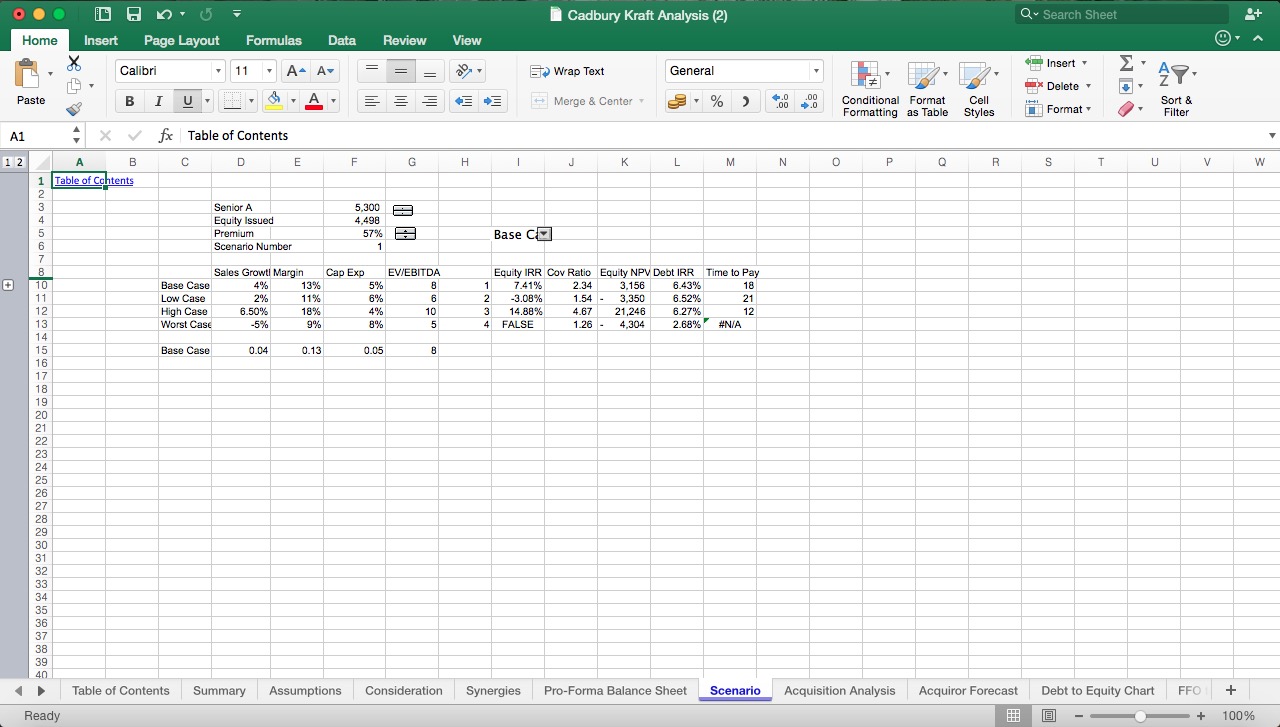
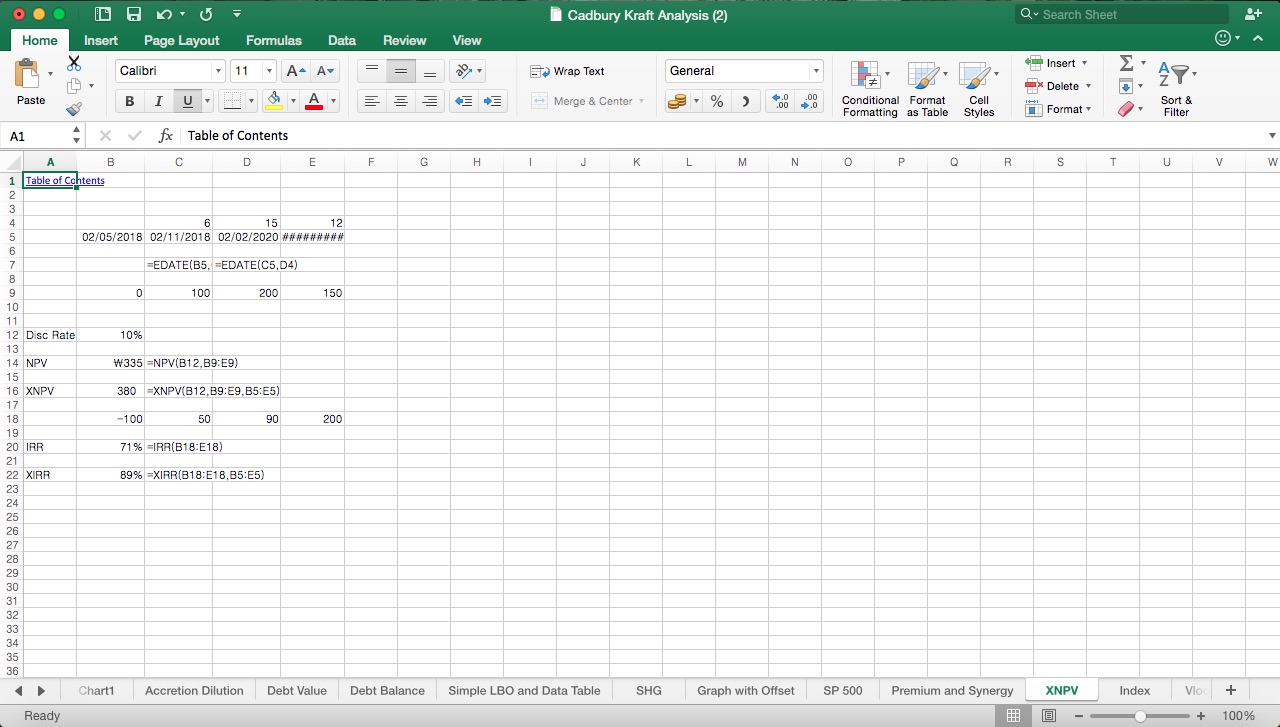
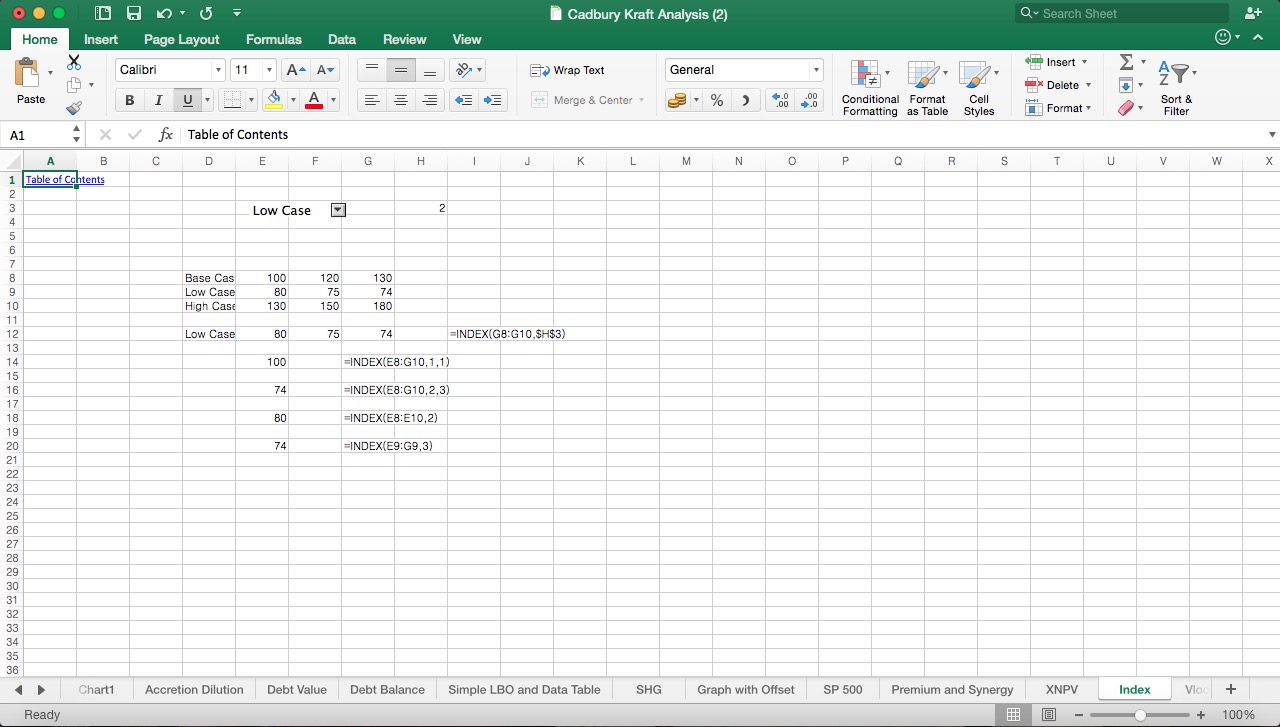
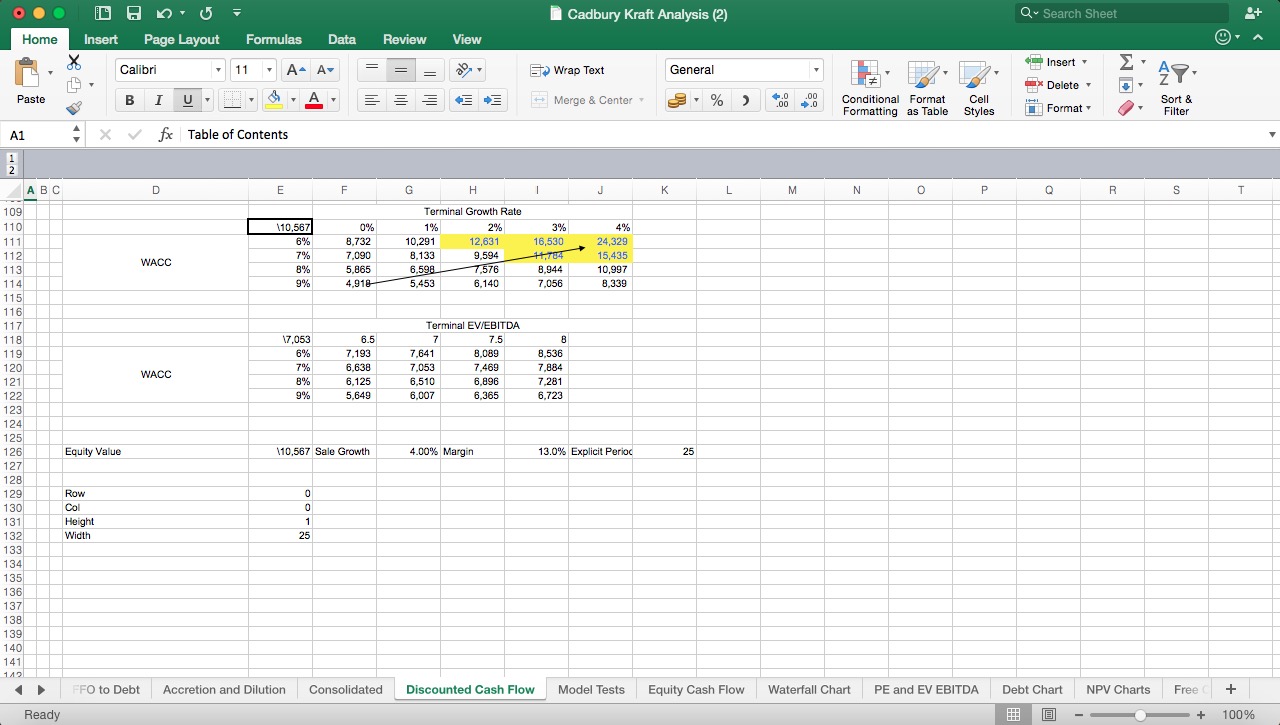
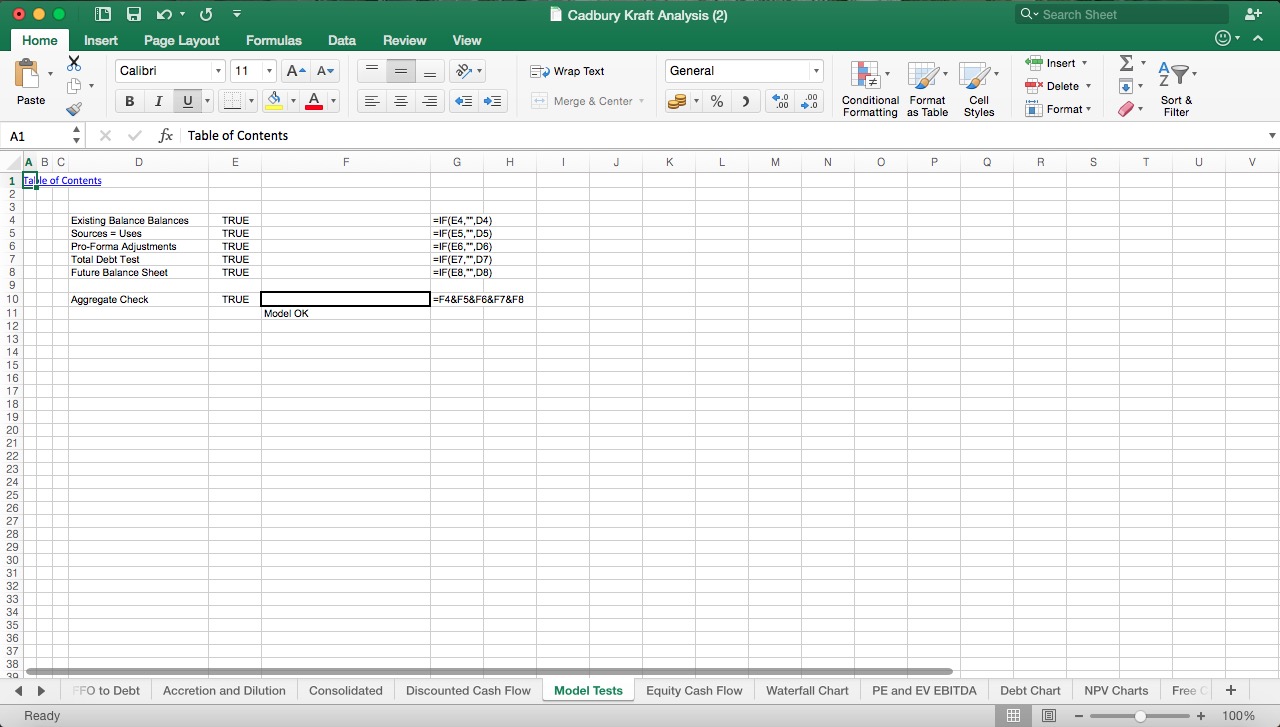
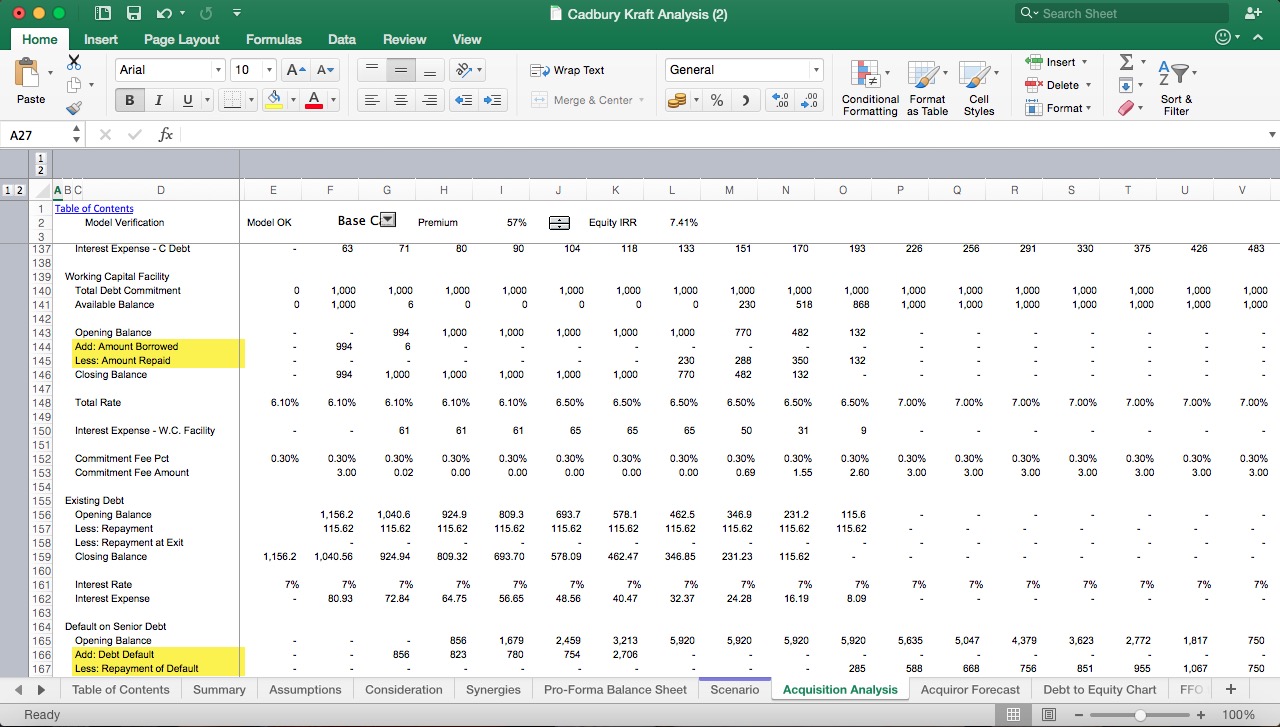
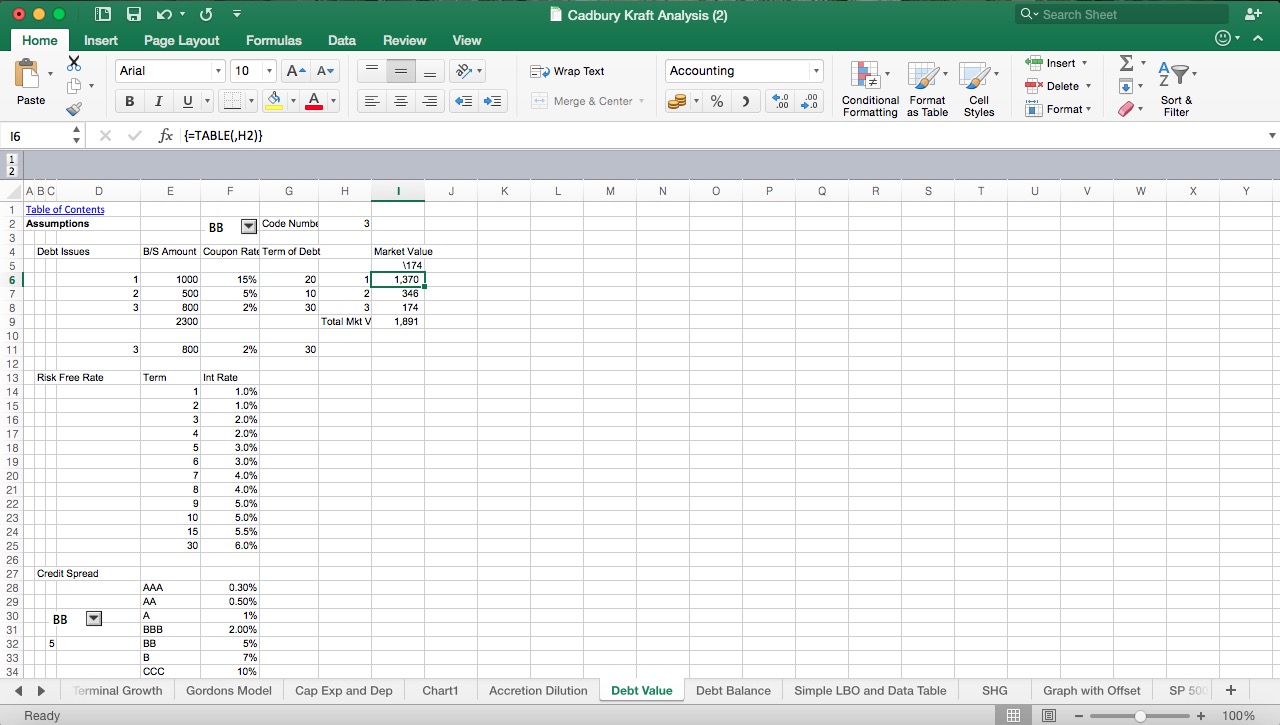
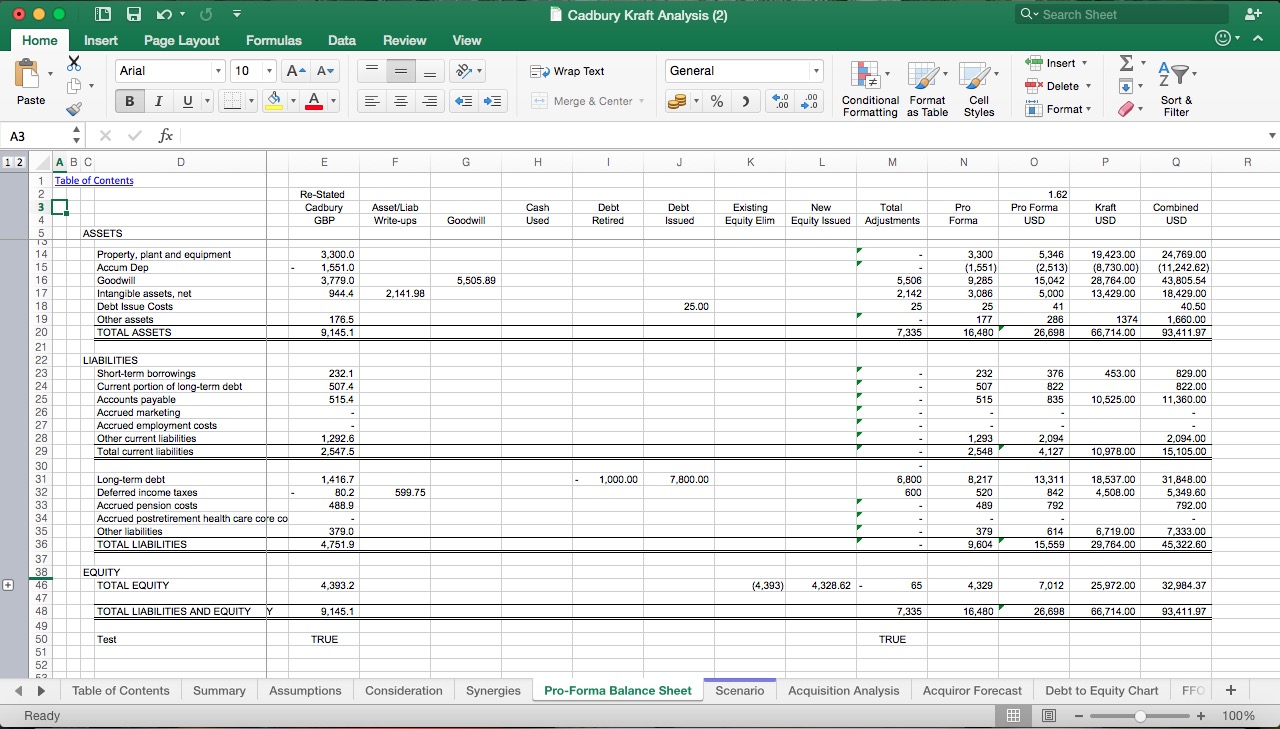
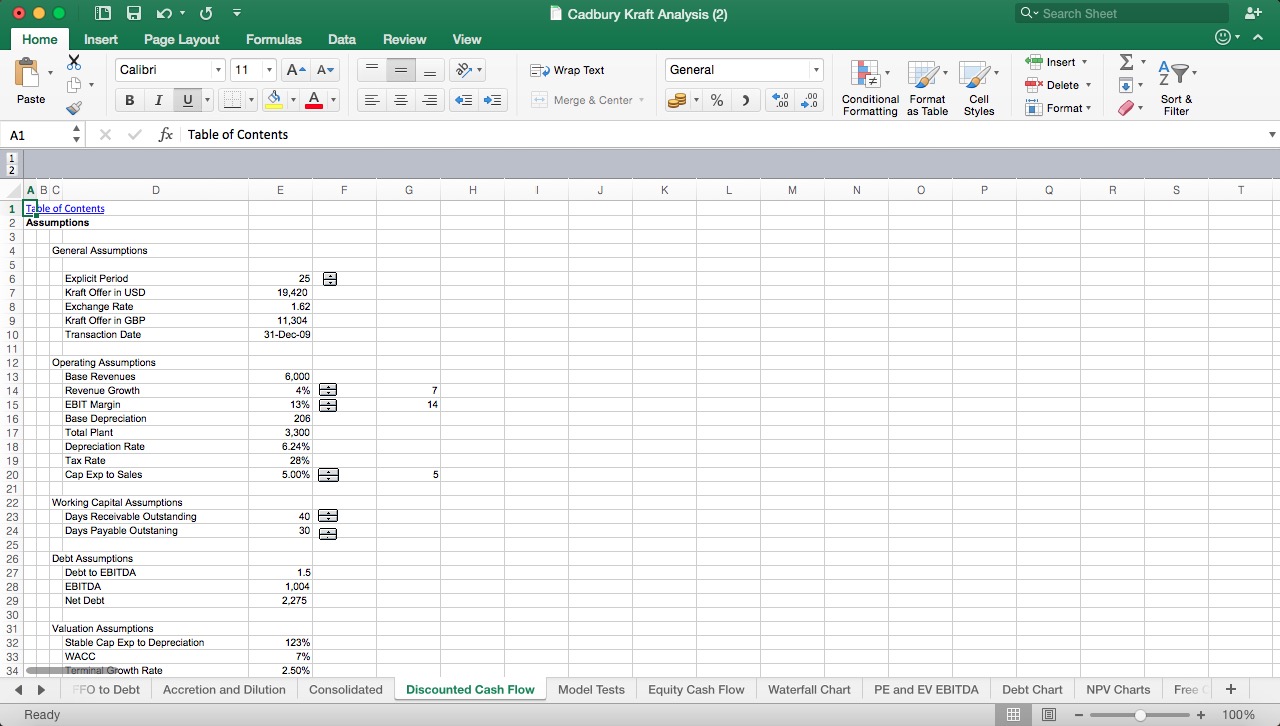
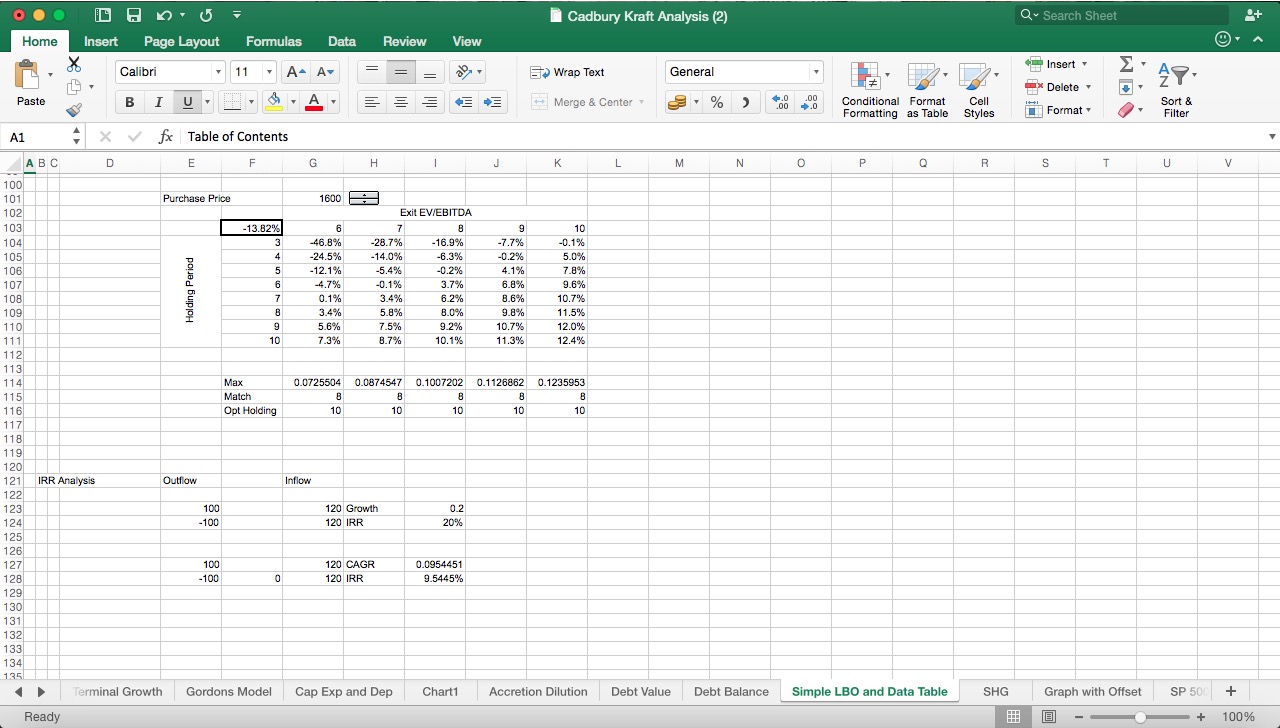
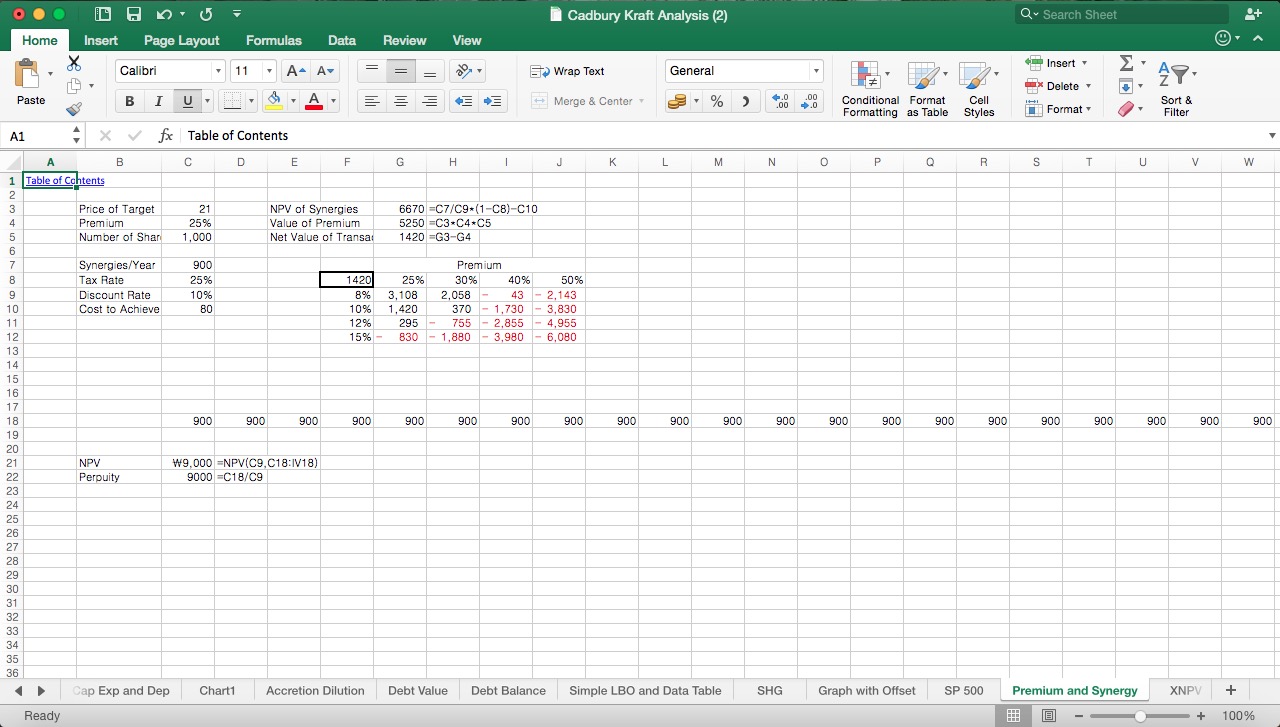
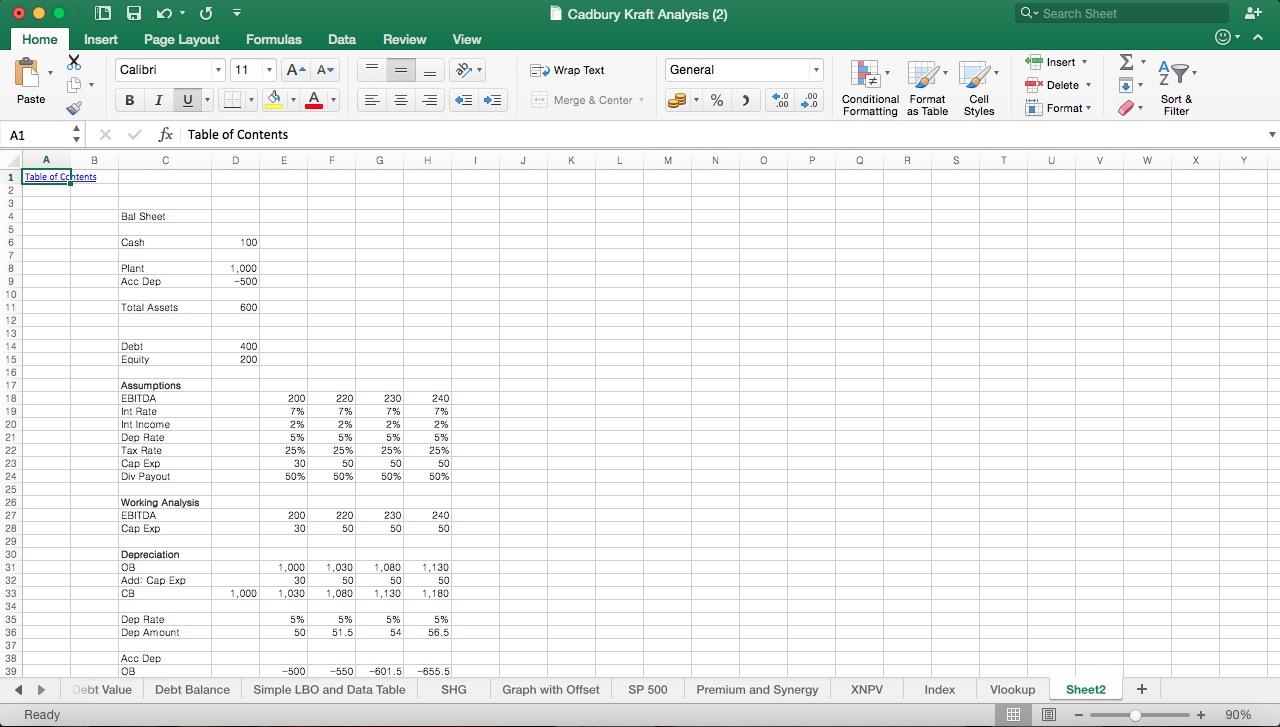
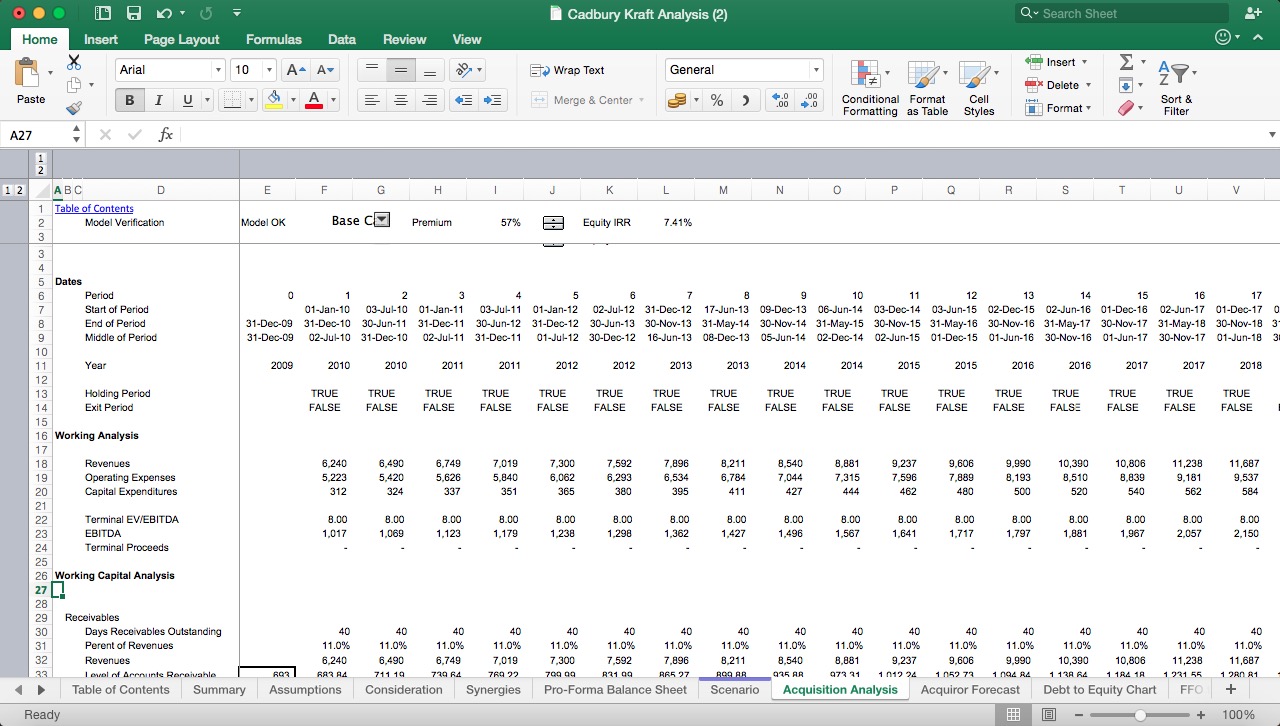
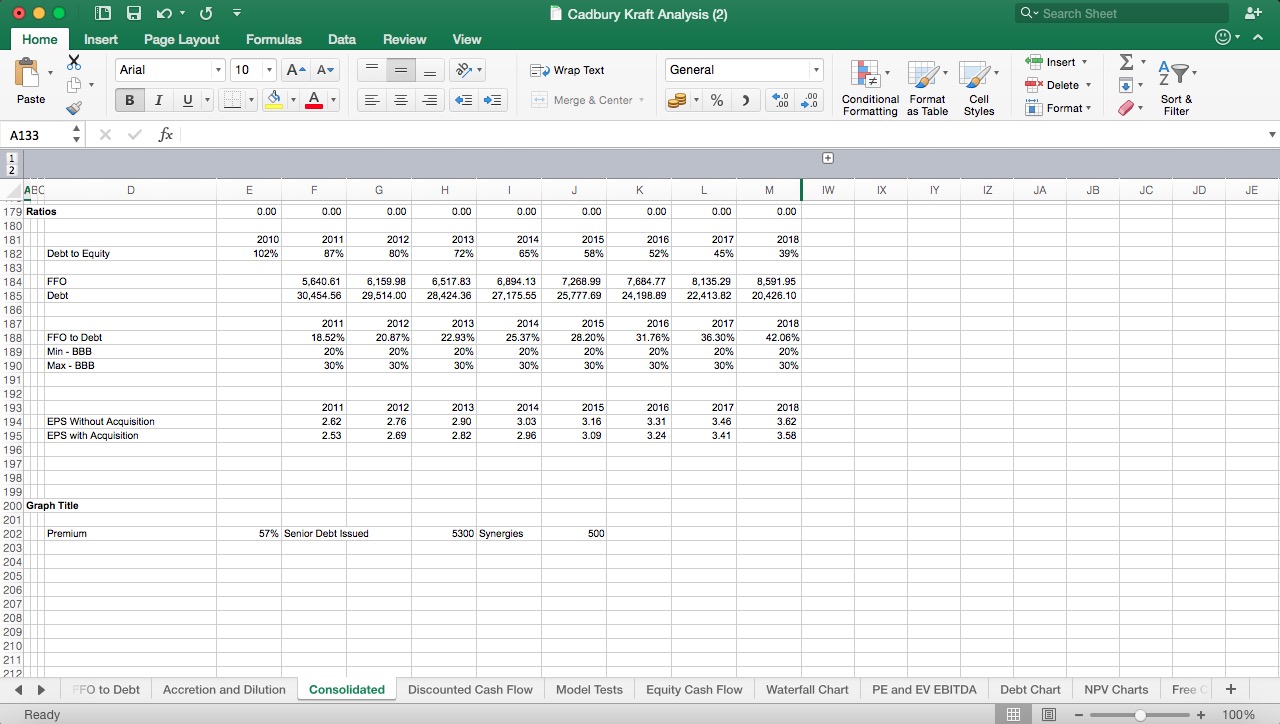
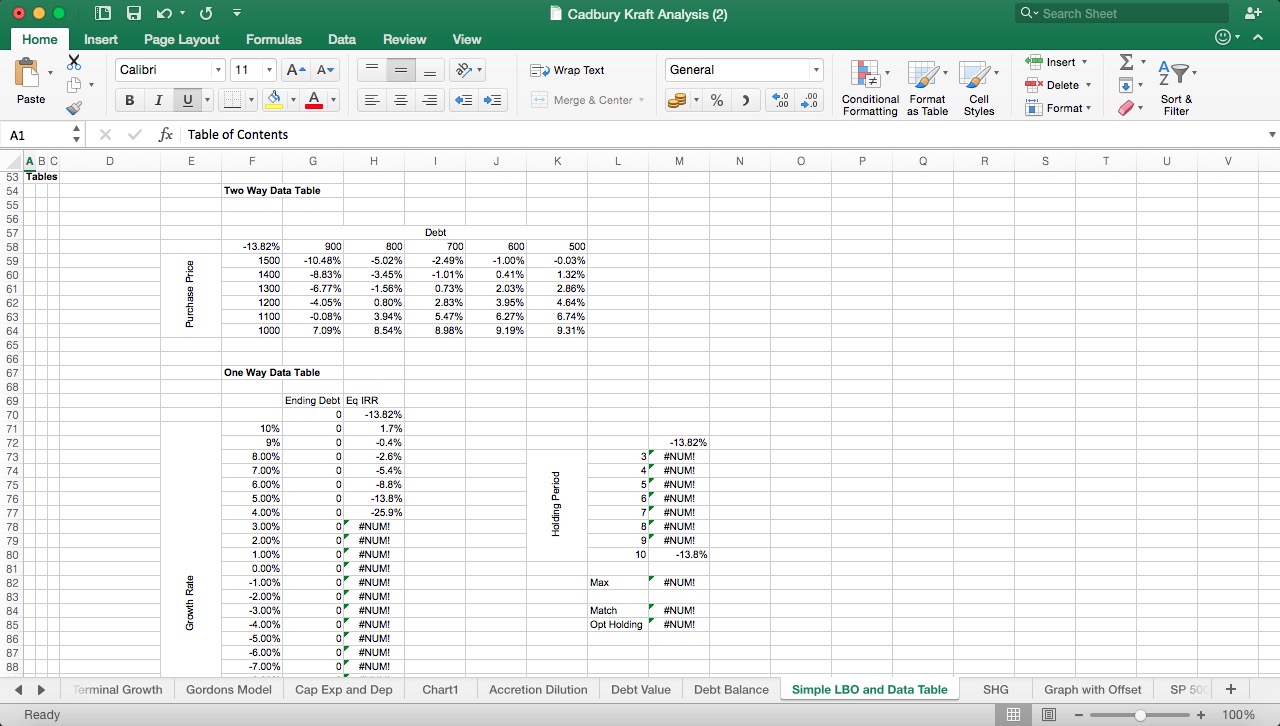
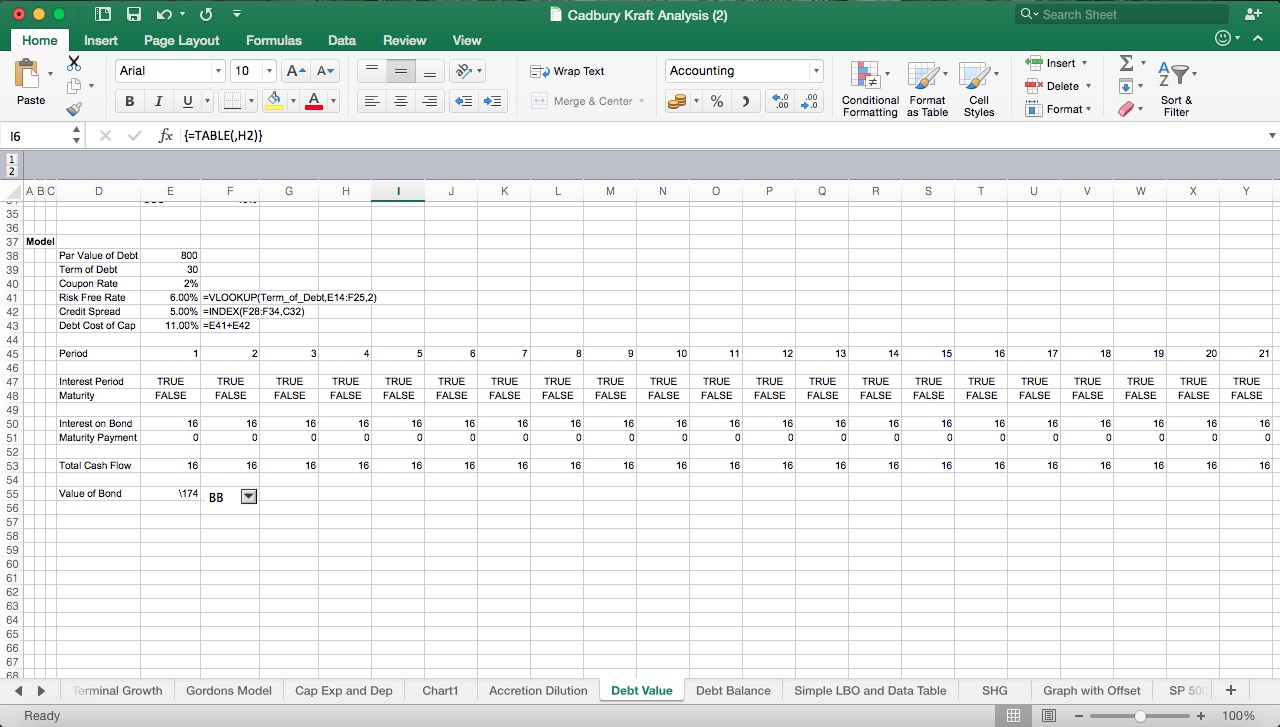
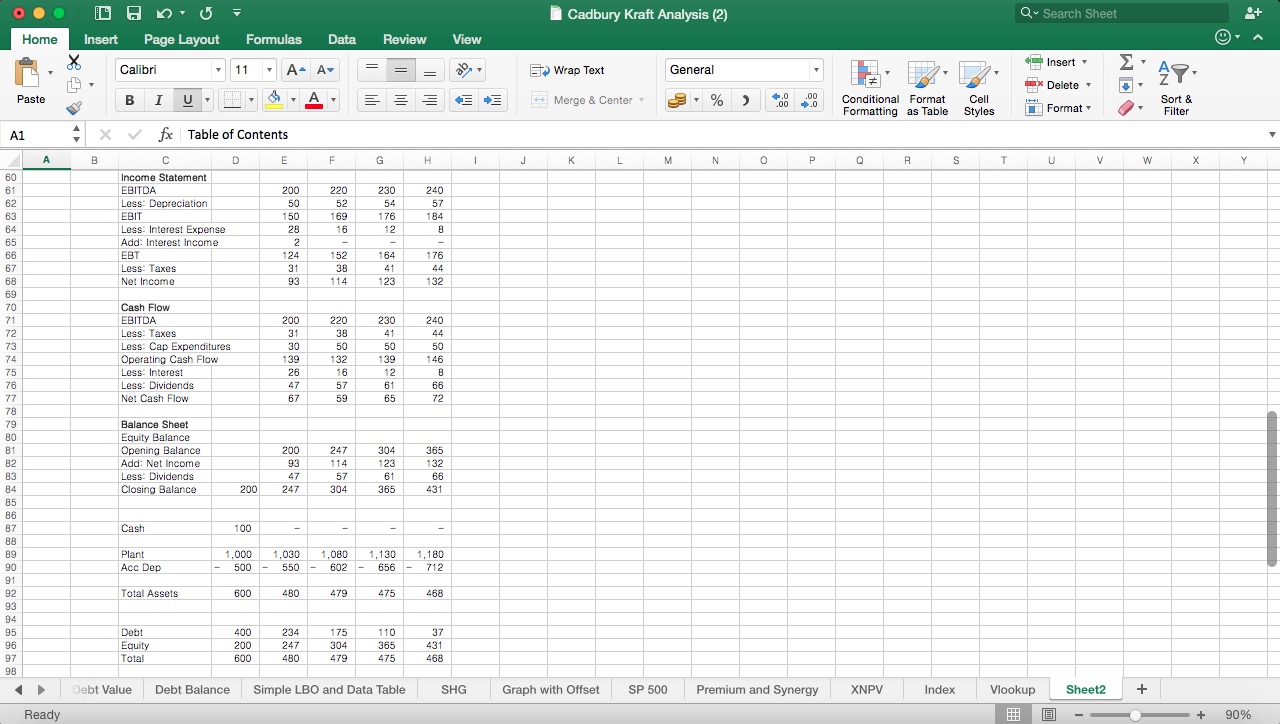
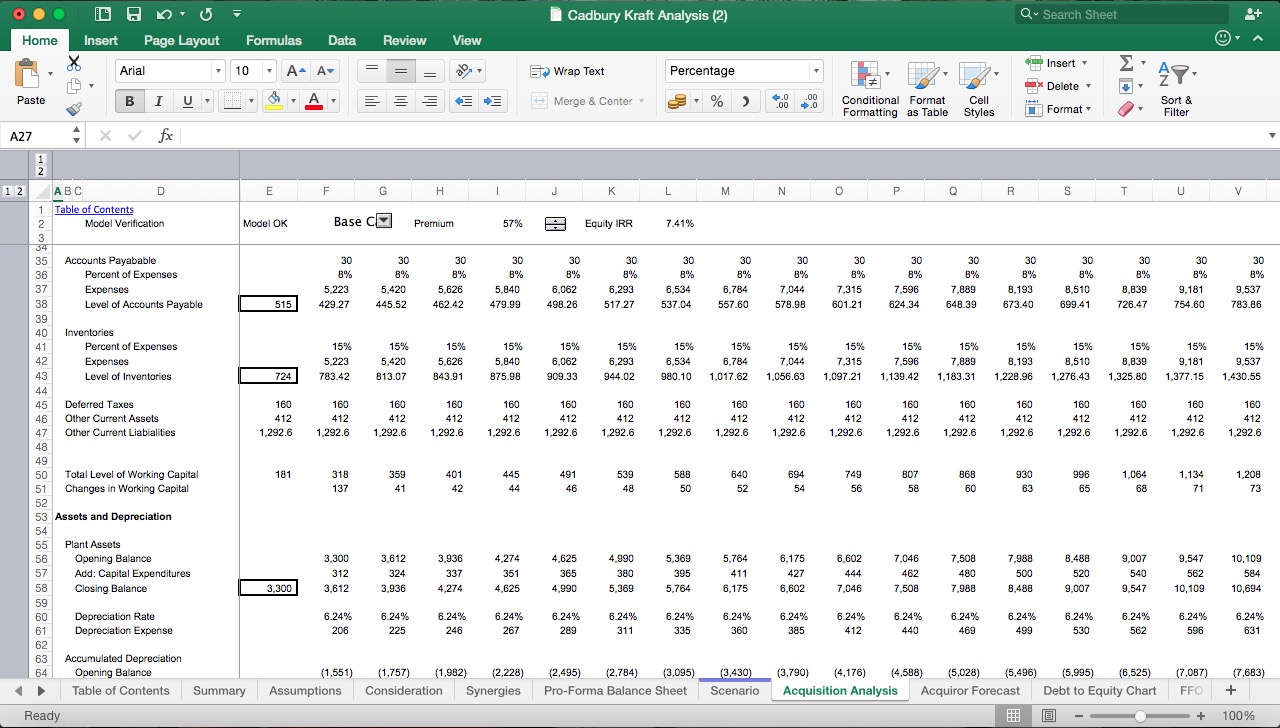
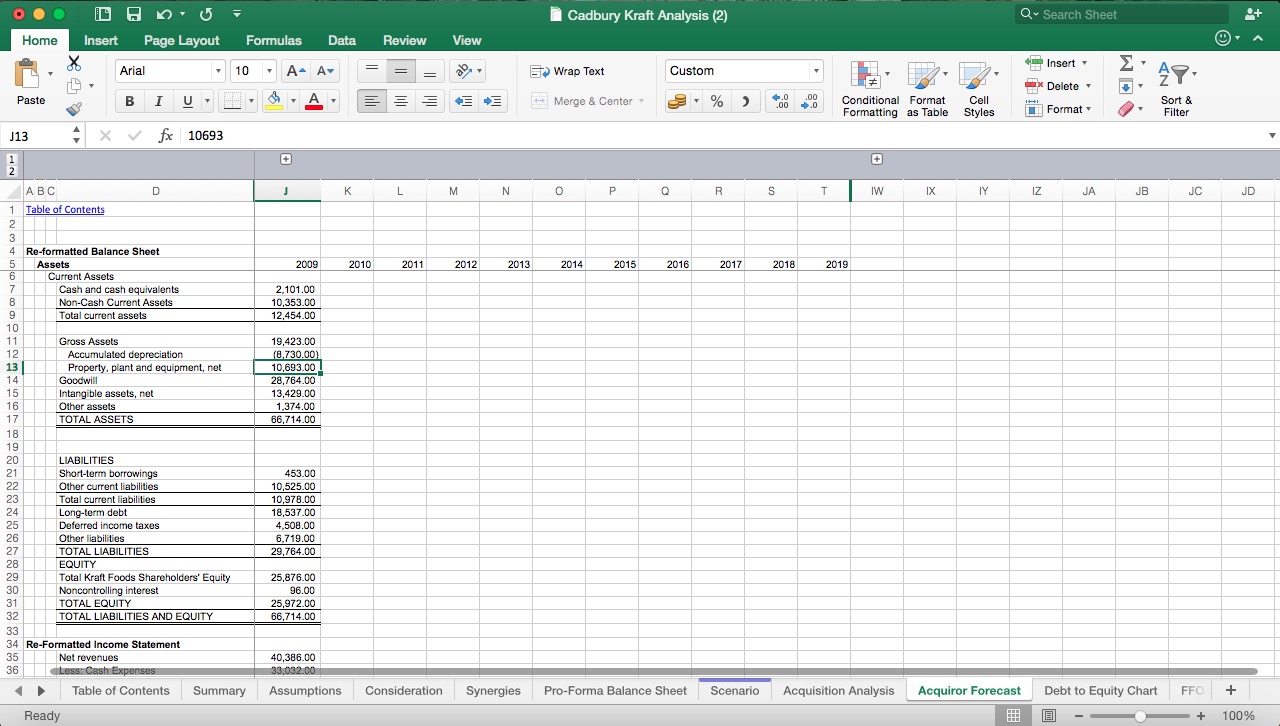
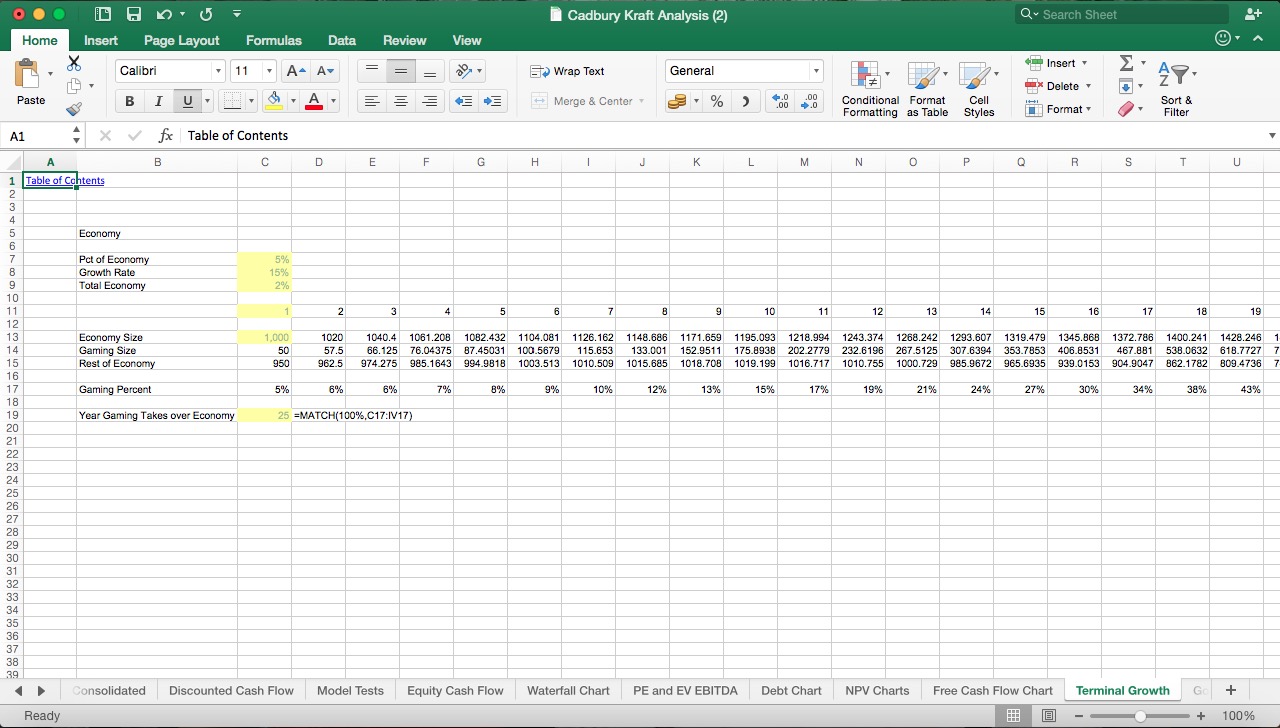
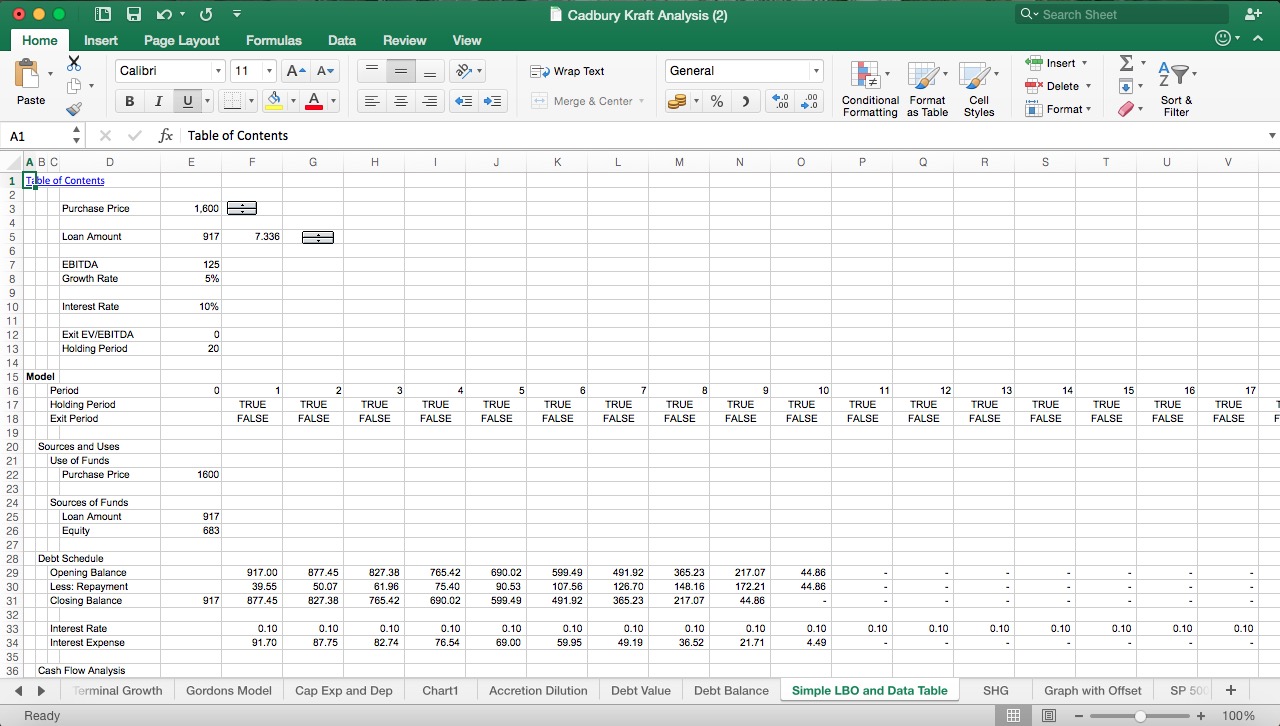
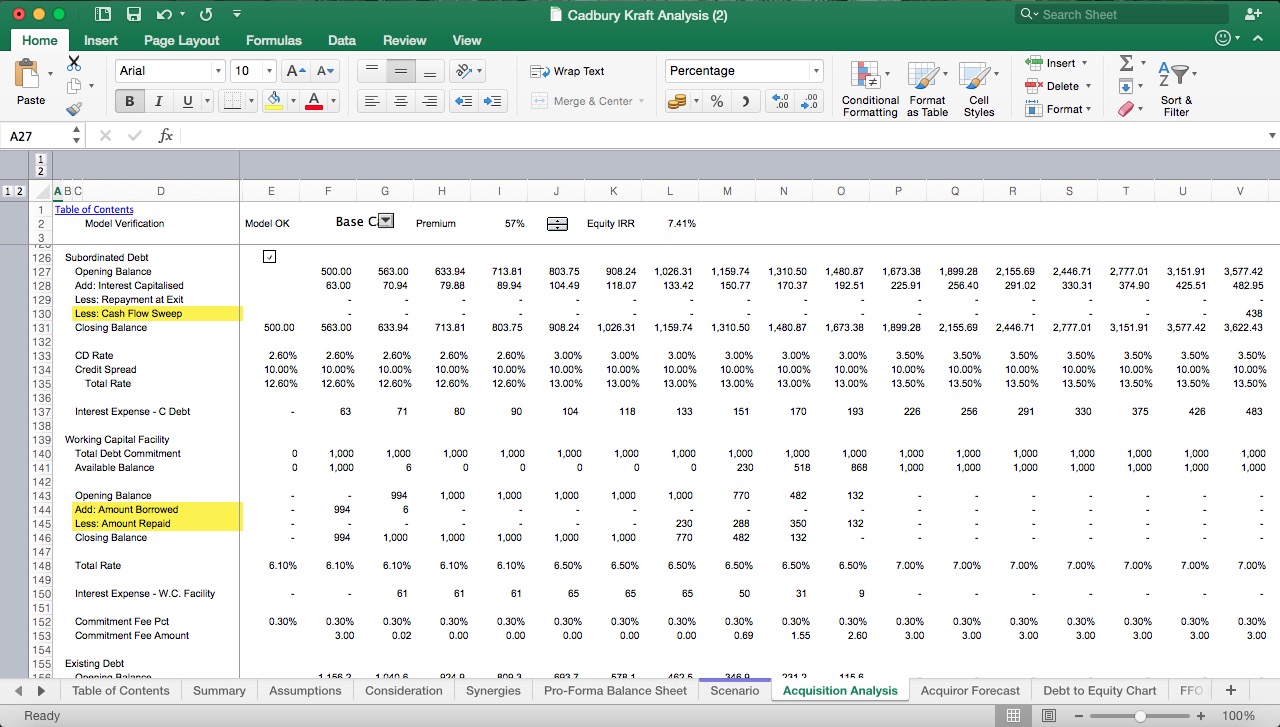
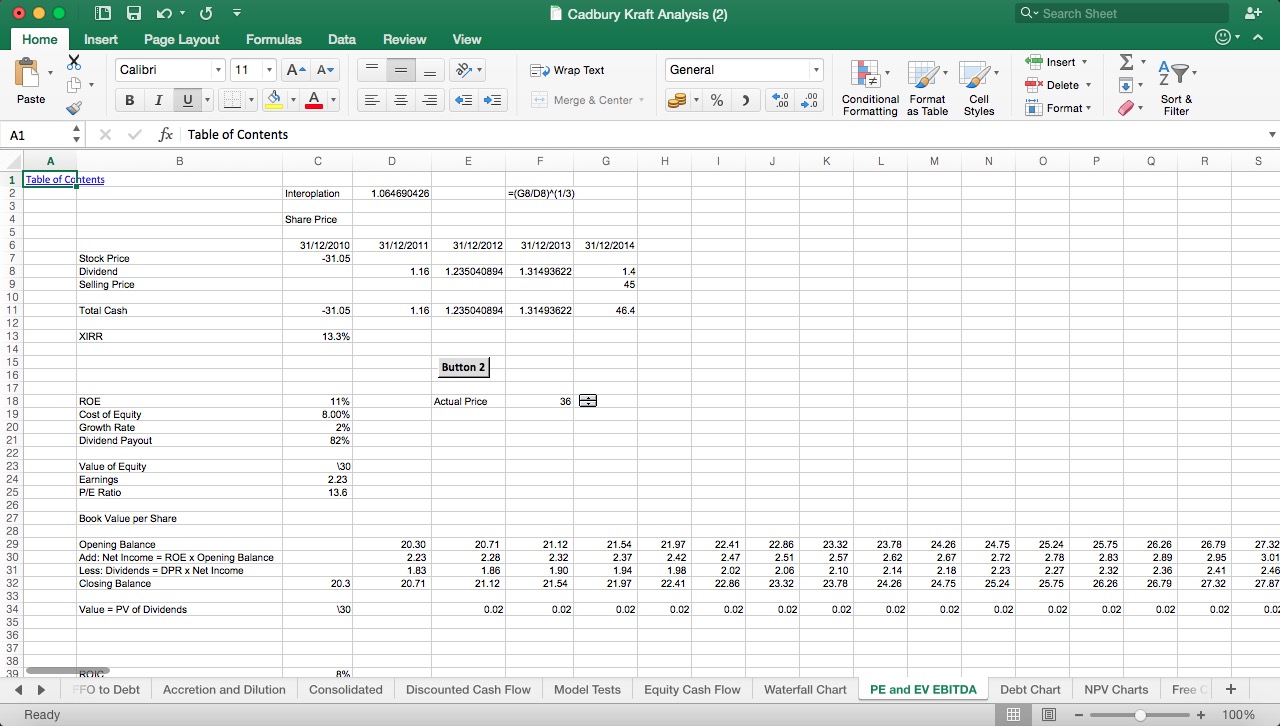
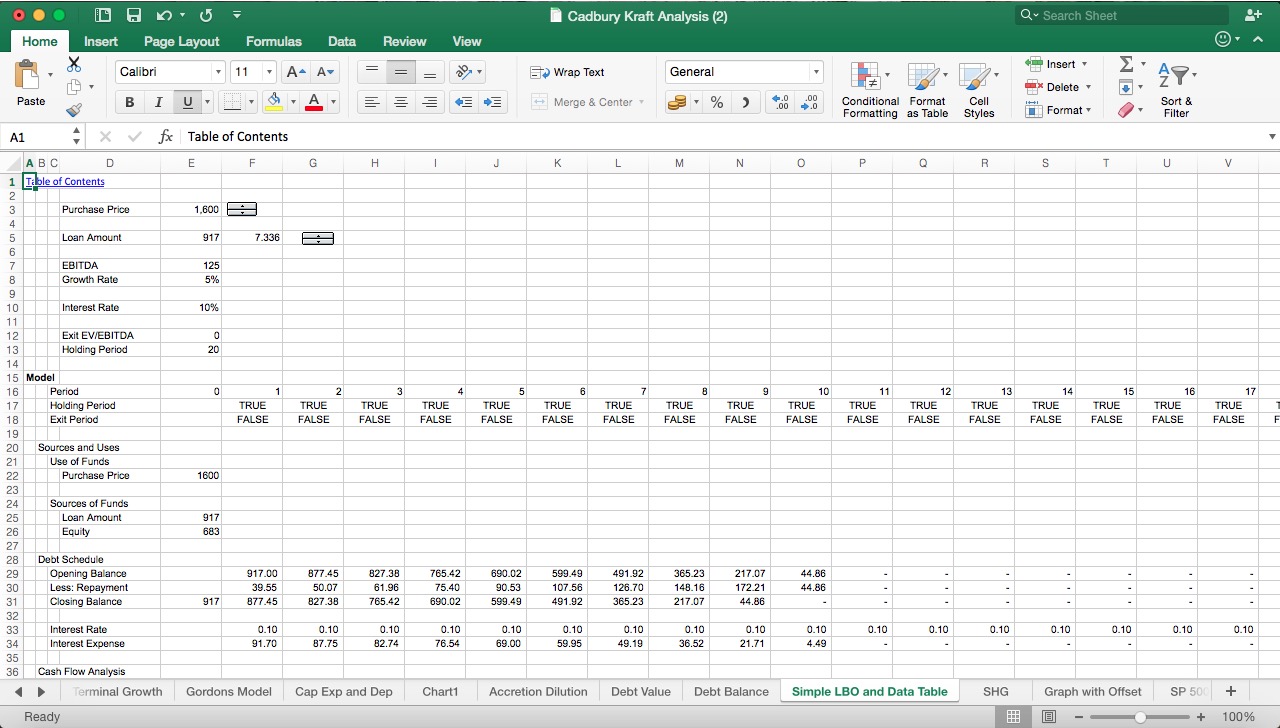
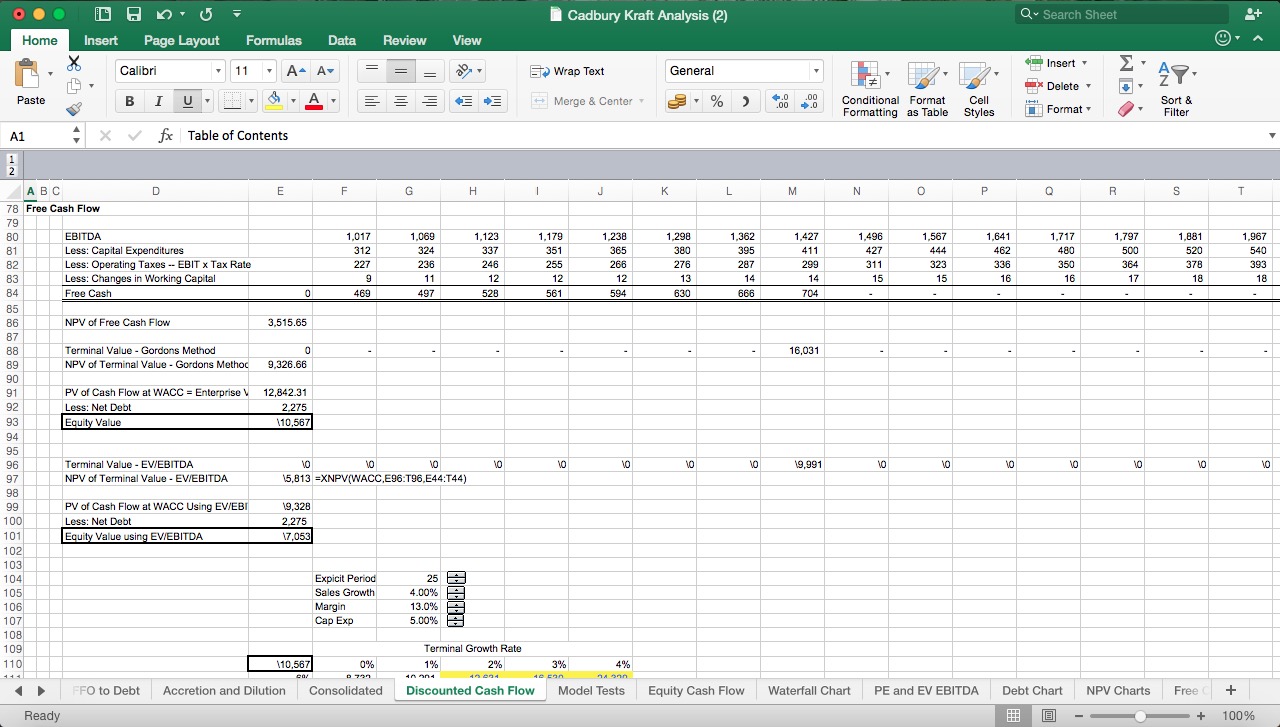
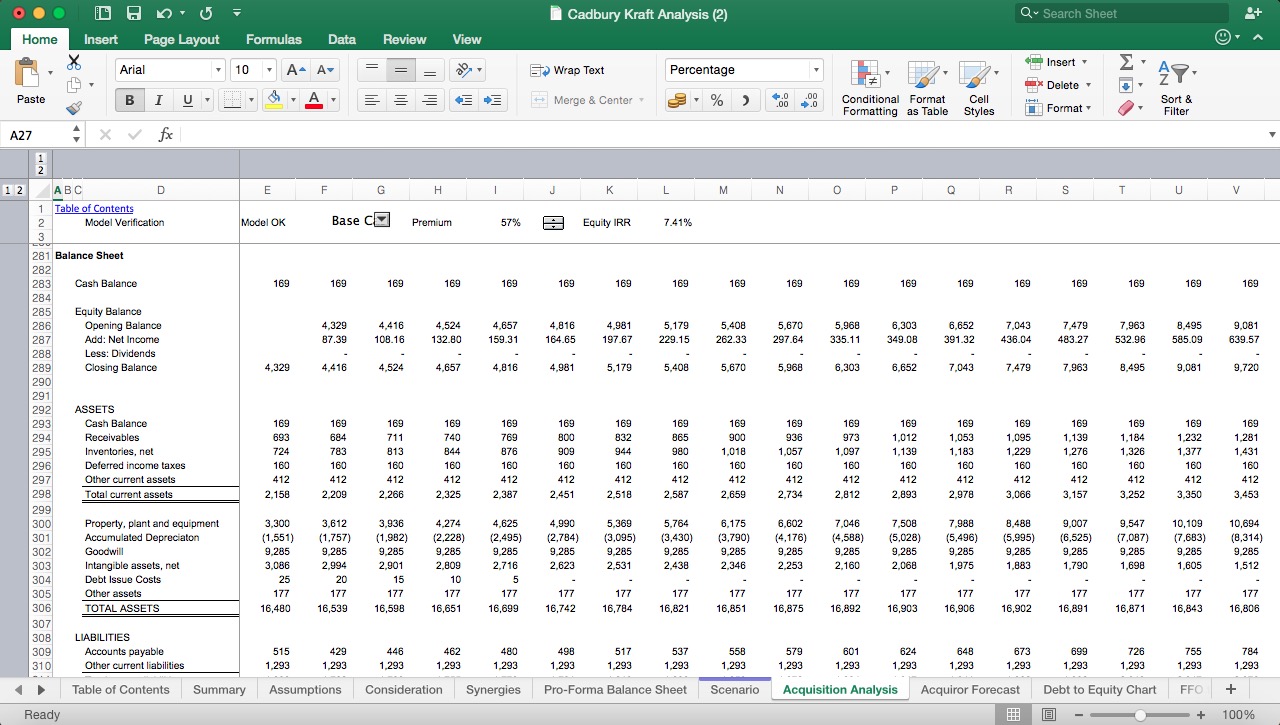
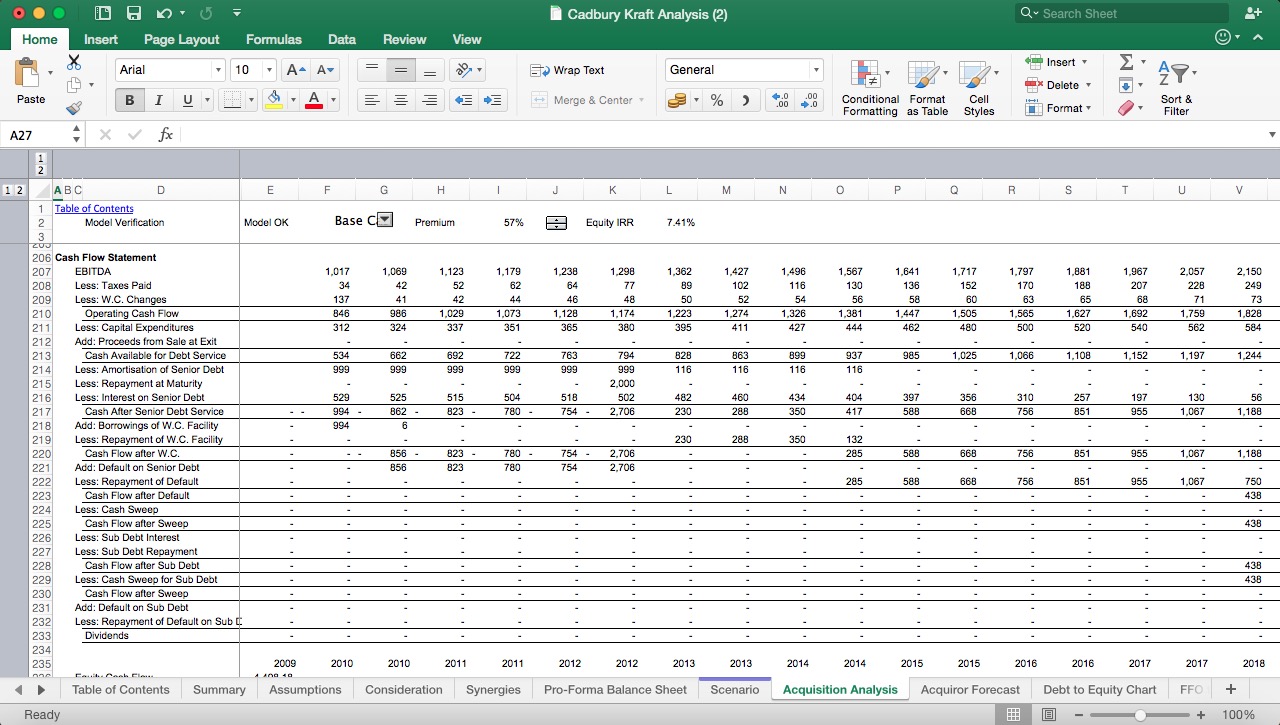
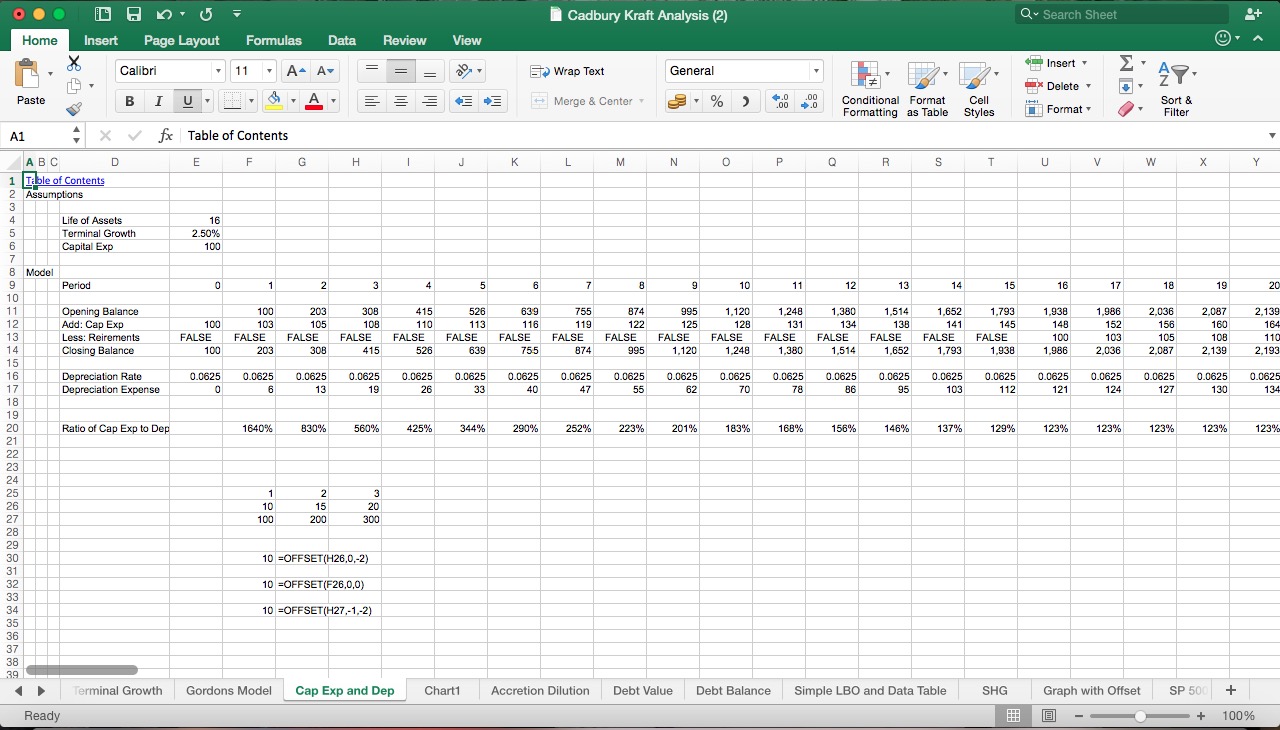
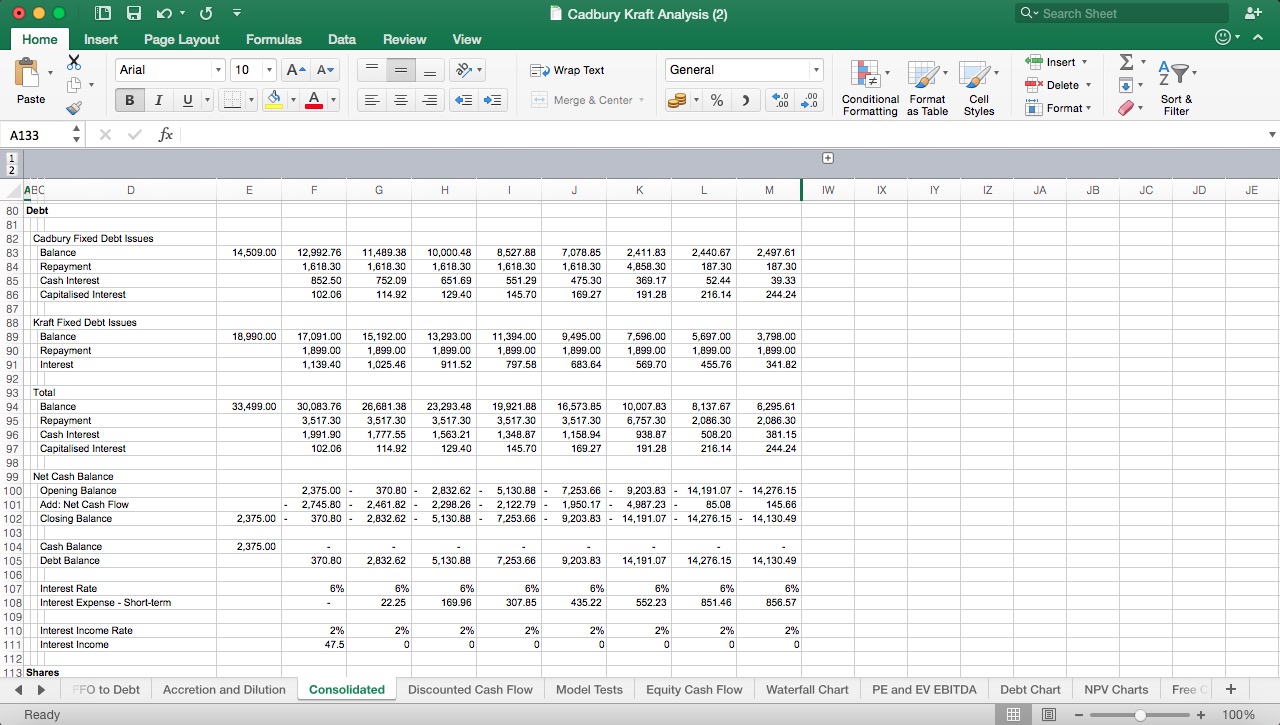
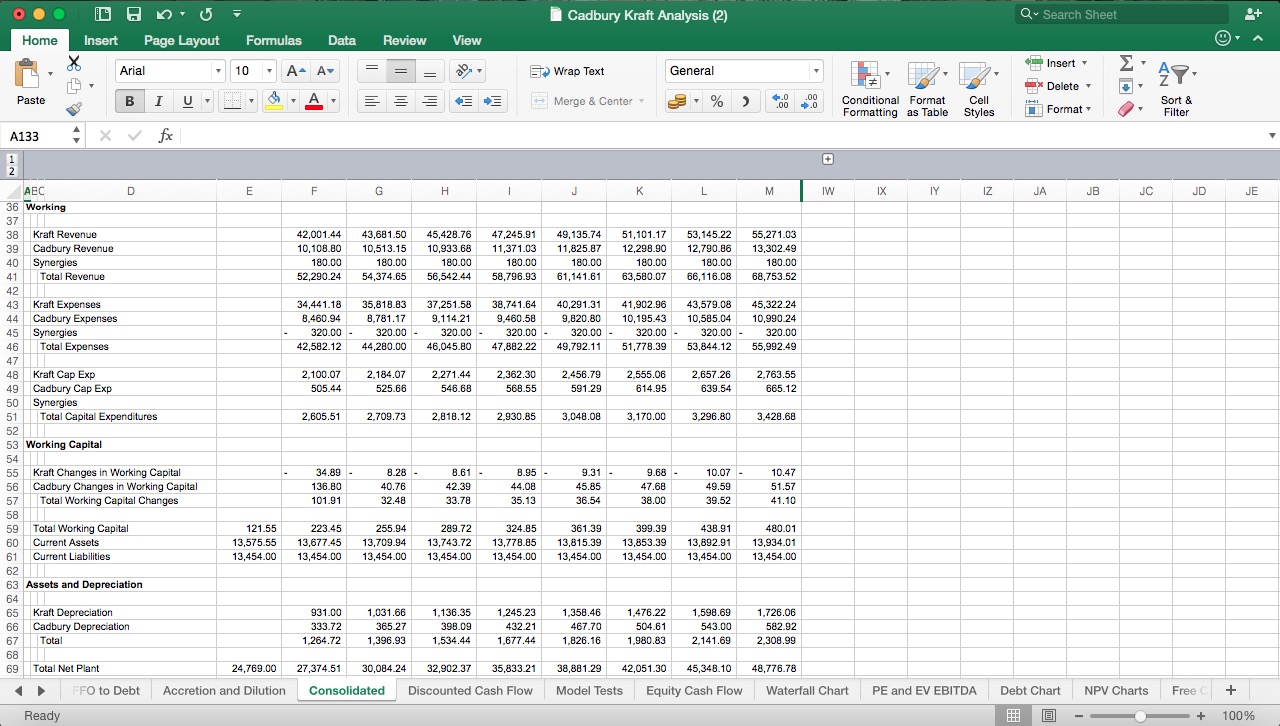
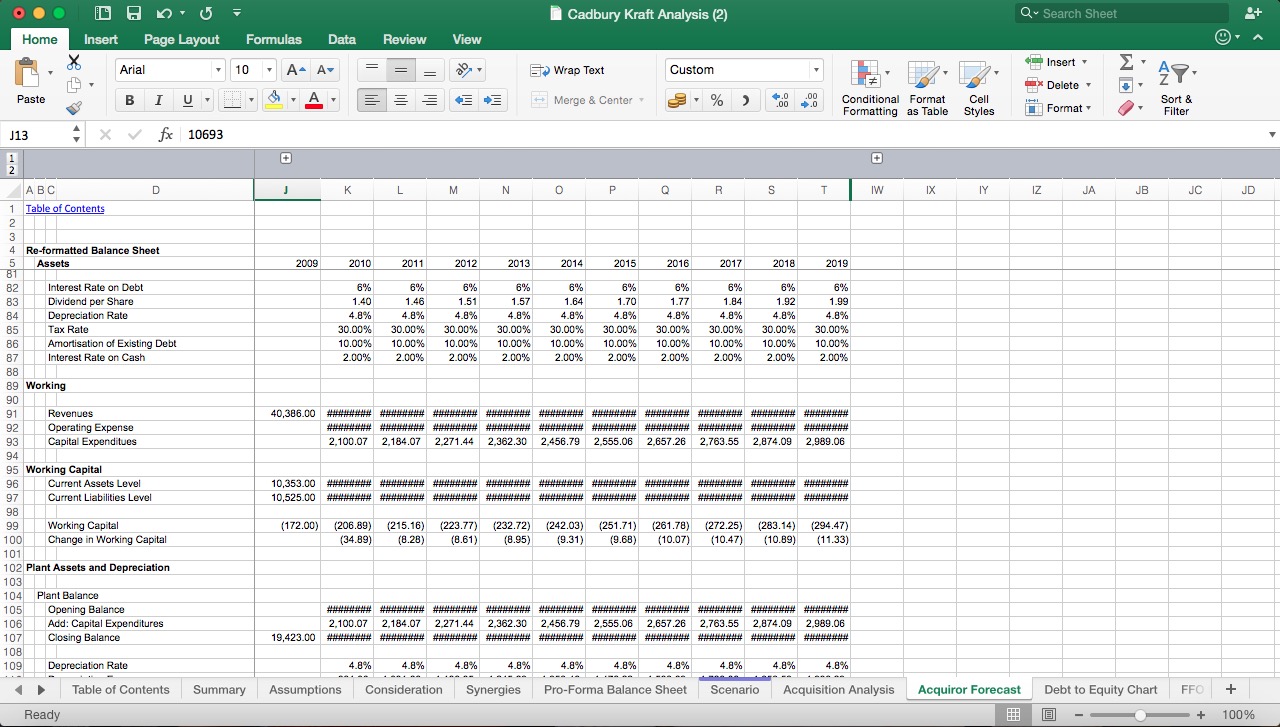
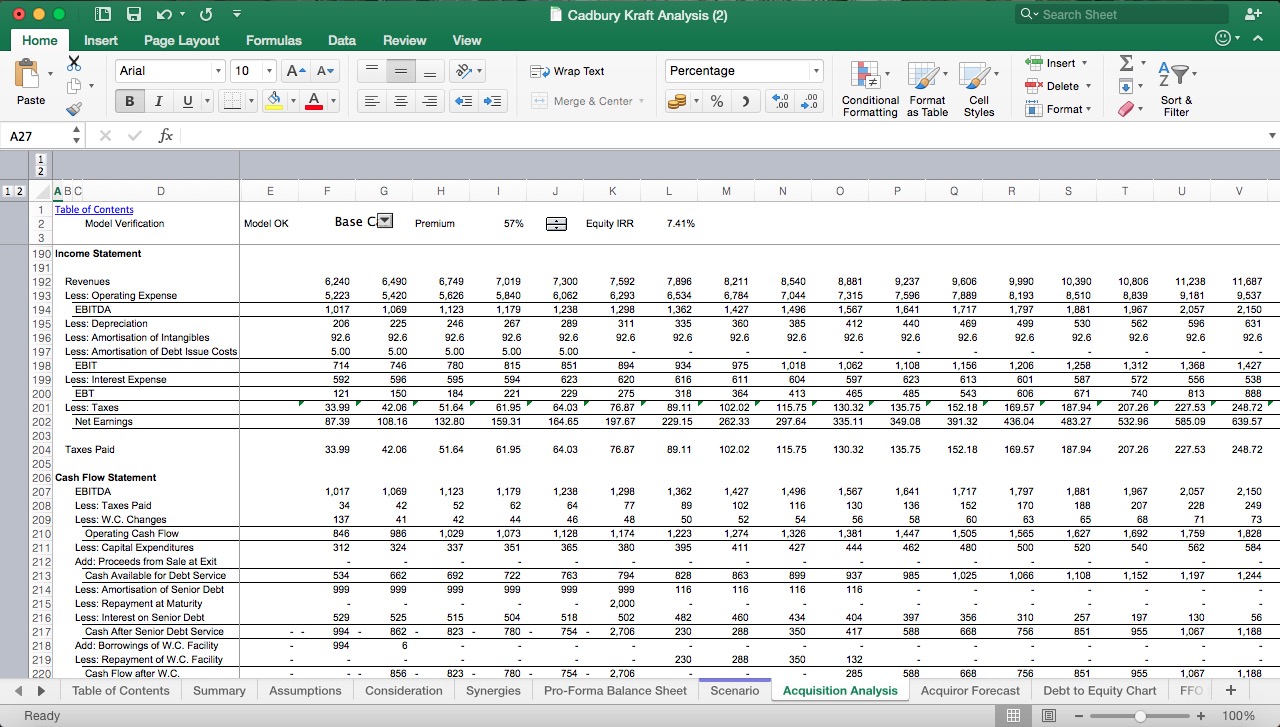
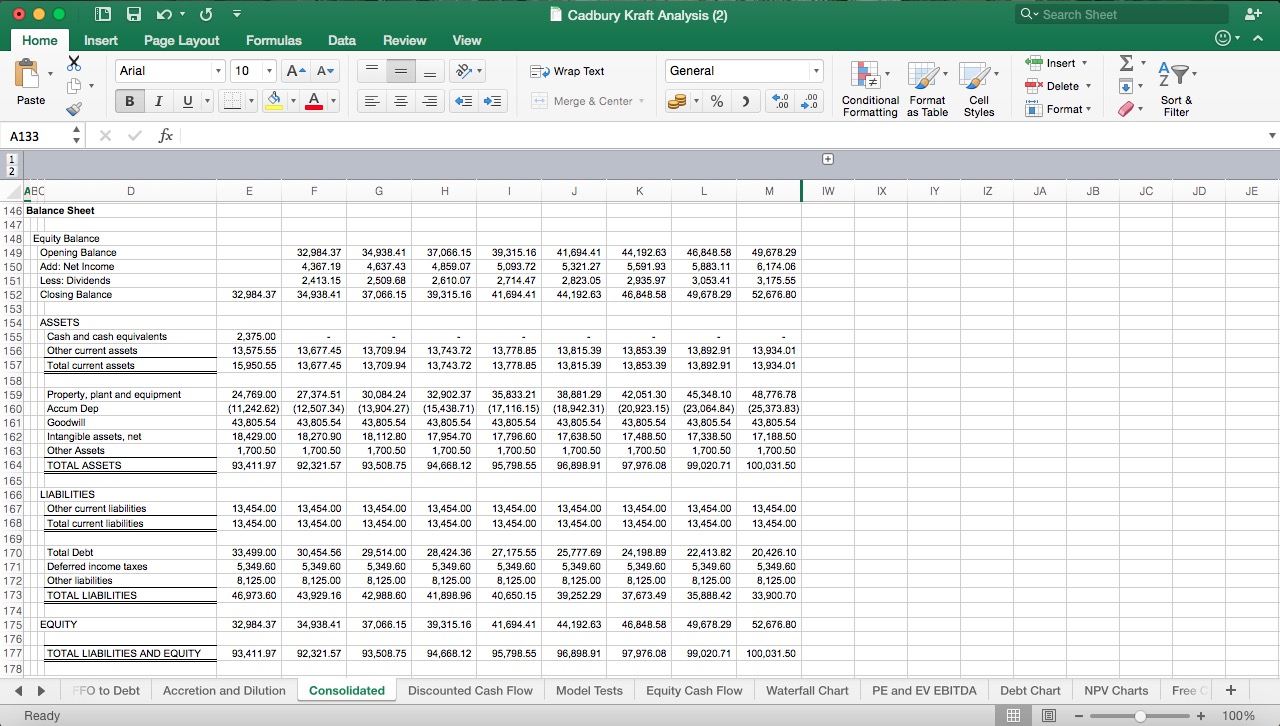
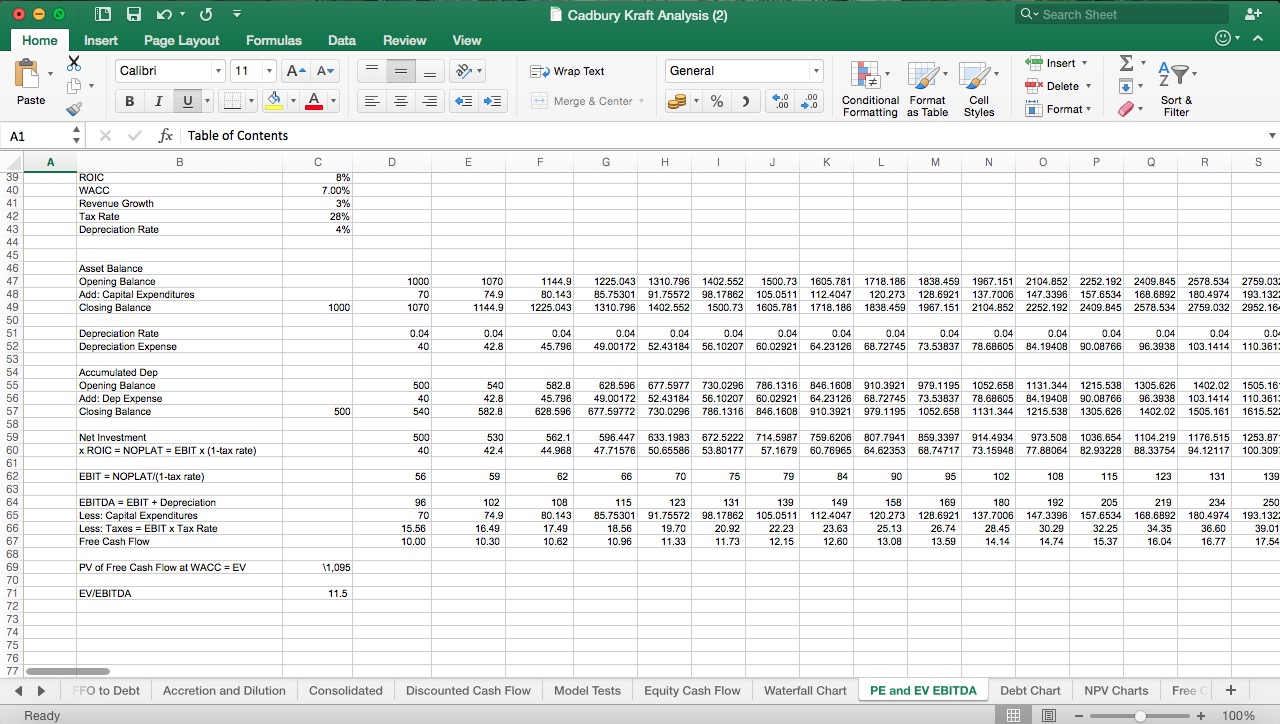
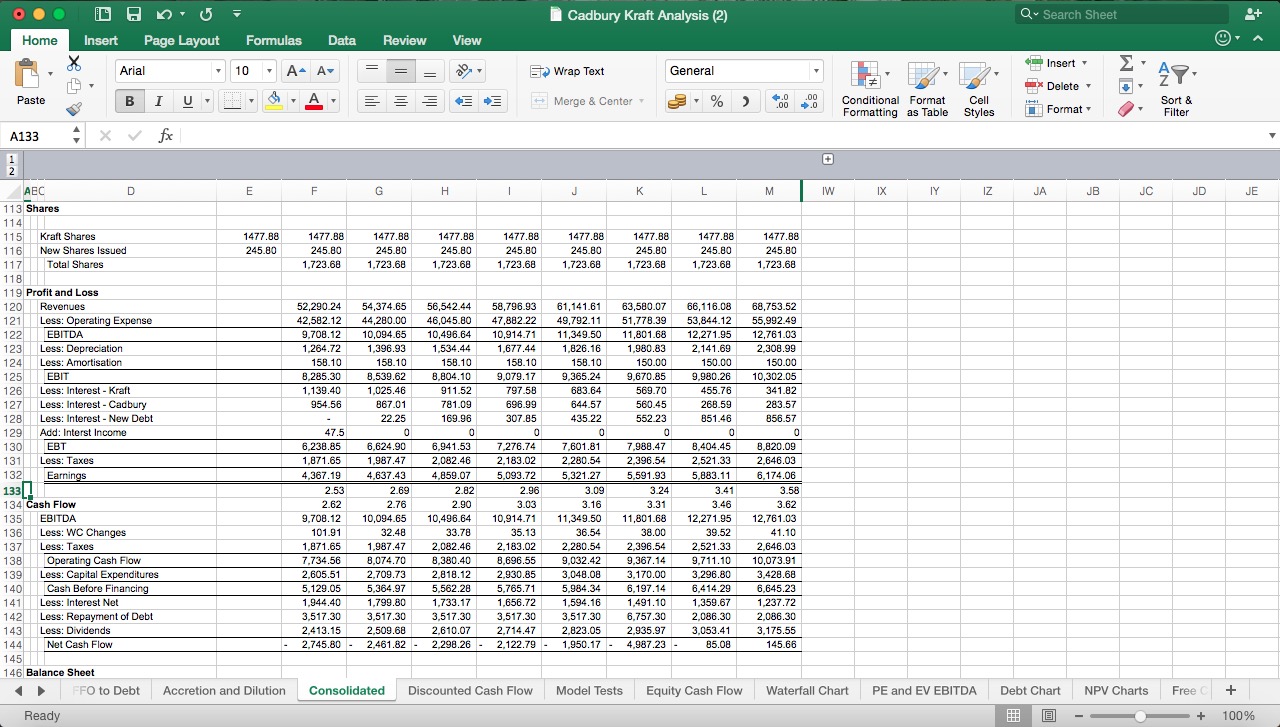
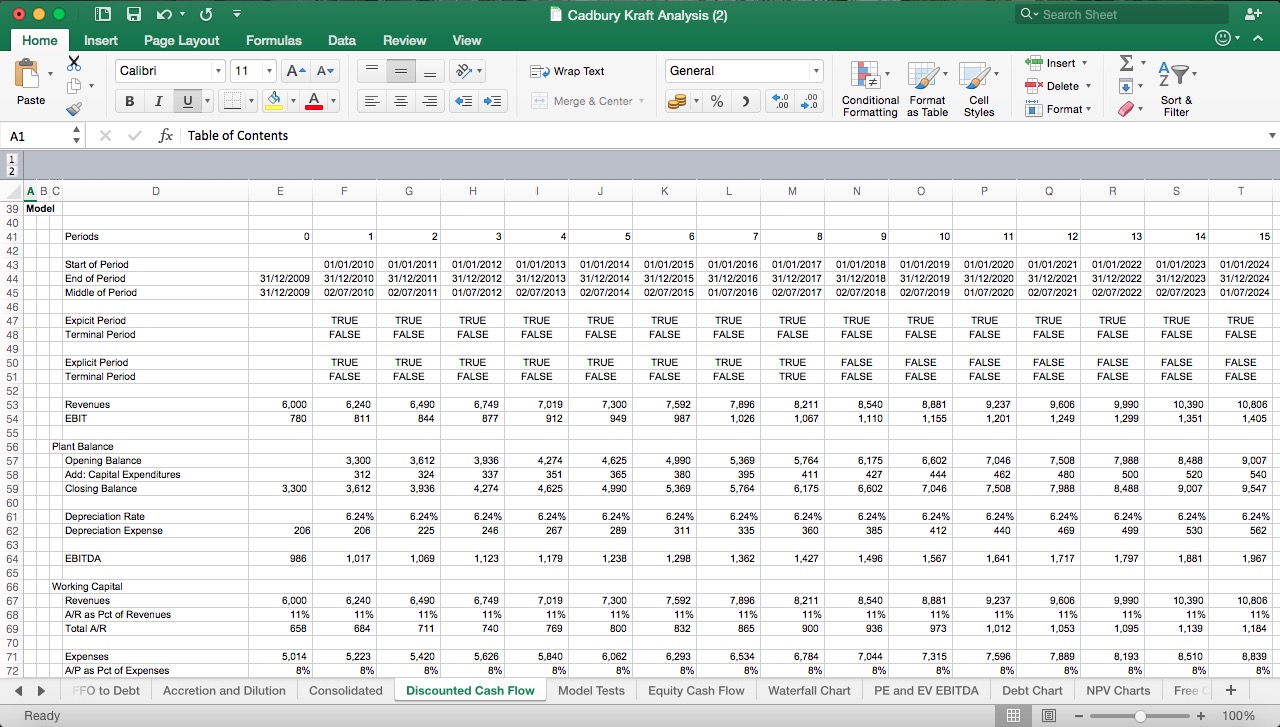
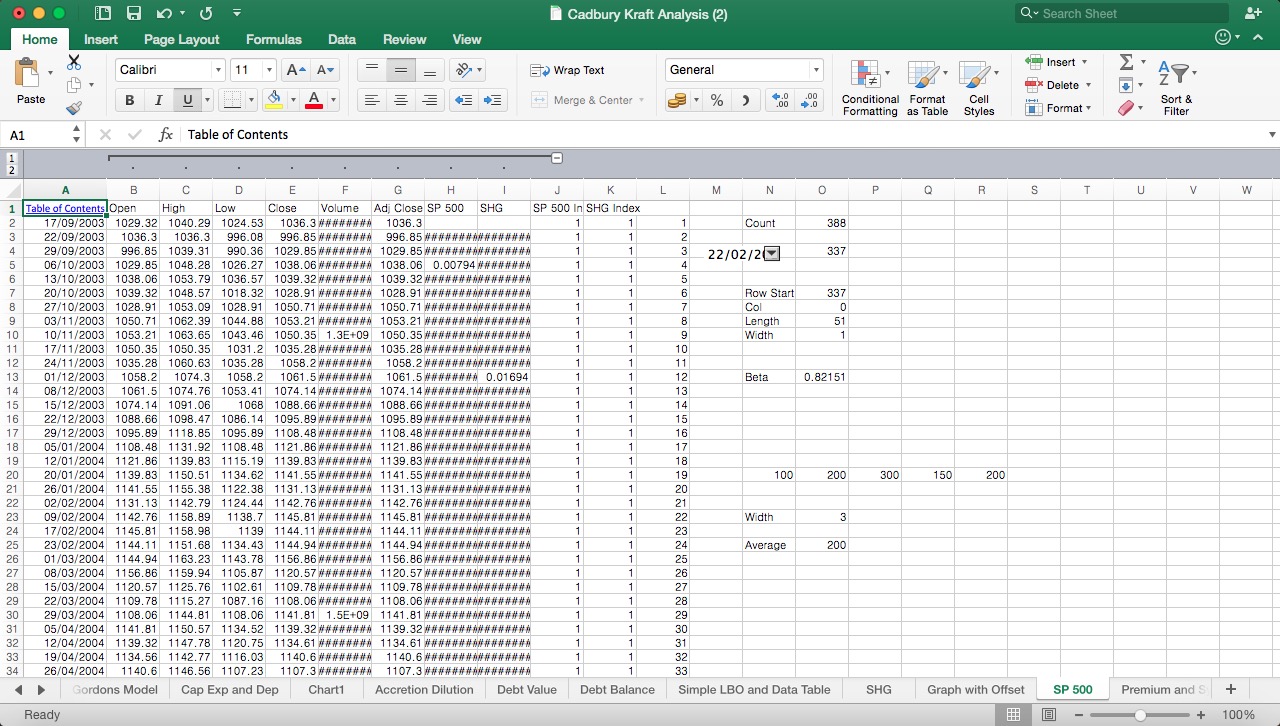
Illustration of different valuation and merger techniques
Detailed excel model analysing the details of the Cadbury/Kraft merger
