
Last version published: 29/03/2017 15:41
Publication number: ELQ-86762-5
View all versions & Certificate
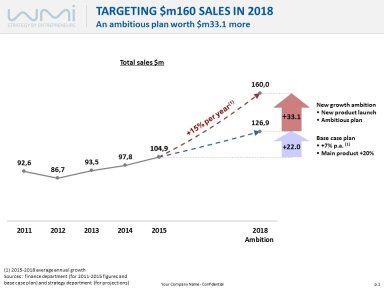
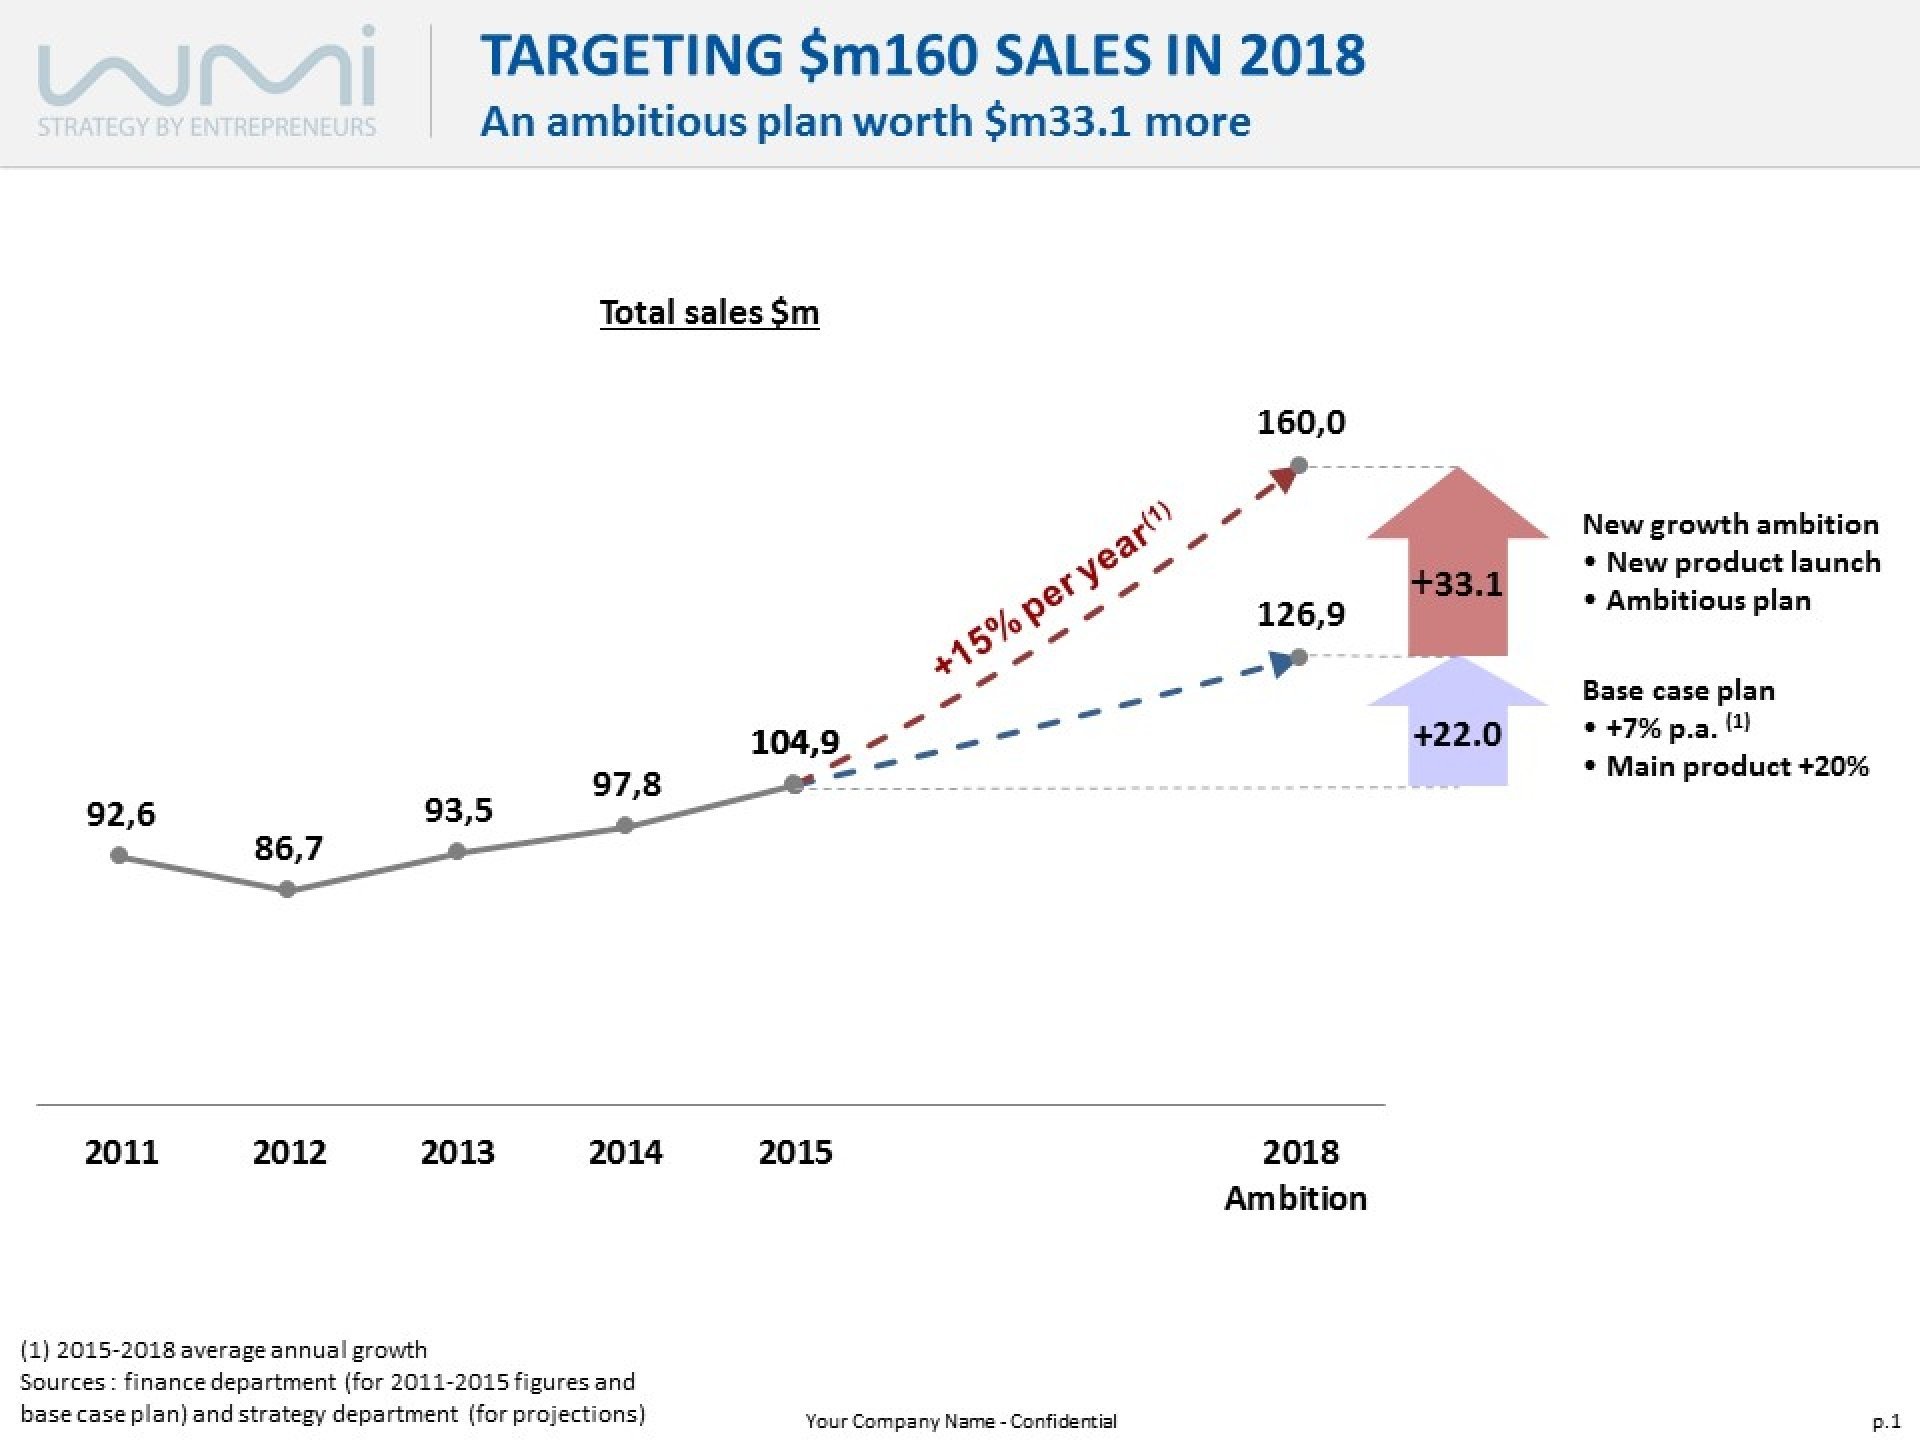
Growth boost chart
Show how your strategy will boost your company's growth with a single effective visual aid.
Further information
You have designed a new strategy for your business unit or company that is going to boost your current growth. You wish to effectively communicate the main financial effect of your new strategy to your superiors, partners, investors... Show the expected numerical impact of your growth strategy with an explanatory graph. Impress your audience with a self-sufficient graph that shows the strength of your strategy by summarizing its expected impact on your company results.
• Display the expected impact of your strategy with a "wow" factor!
• Ignite interest in your strategy by showing its potential
• Create a selling tool for your strategy with a self-explanatory graph
• Rally your audience around a more ambitious future goal
• Indicate your enthusiasm and ambition for your company
• You want to negotiate a new budget deal to implement a more ambitious business strategy
• You want to rally people around more ambitious goals
• You want to summarize your strategy's impact with a single explanatory graph
• You want to set new heights for your unit, department or company
• You want to explain at length the intricacies of your new strategy
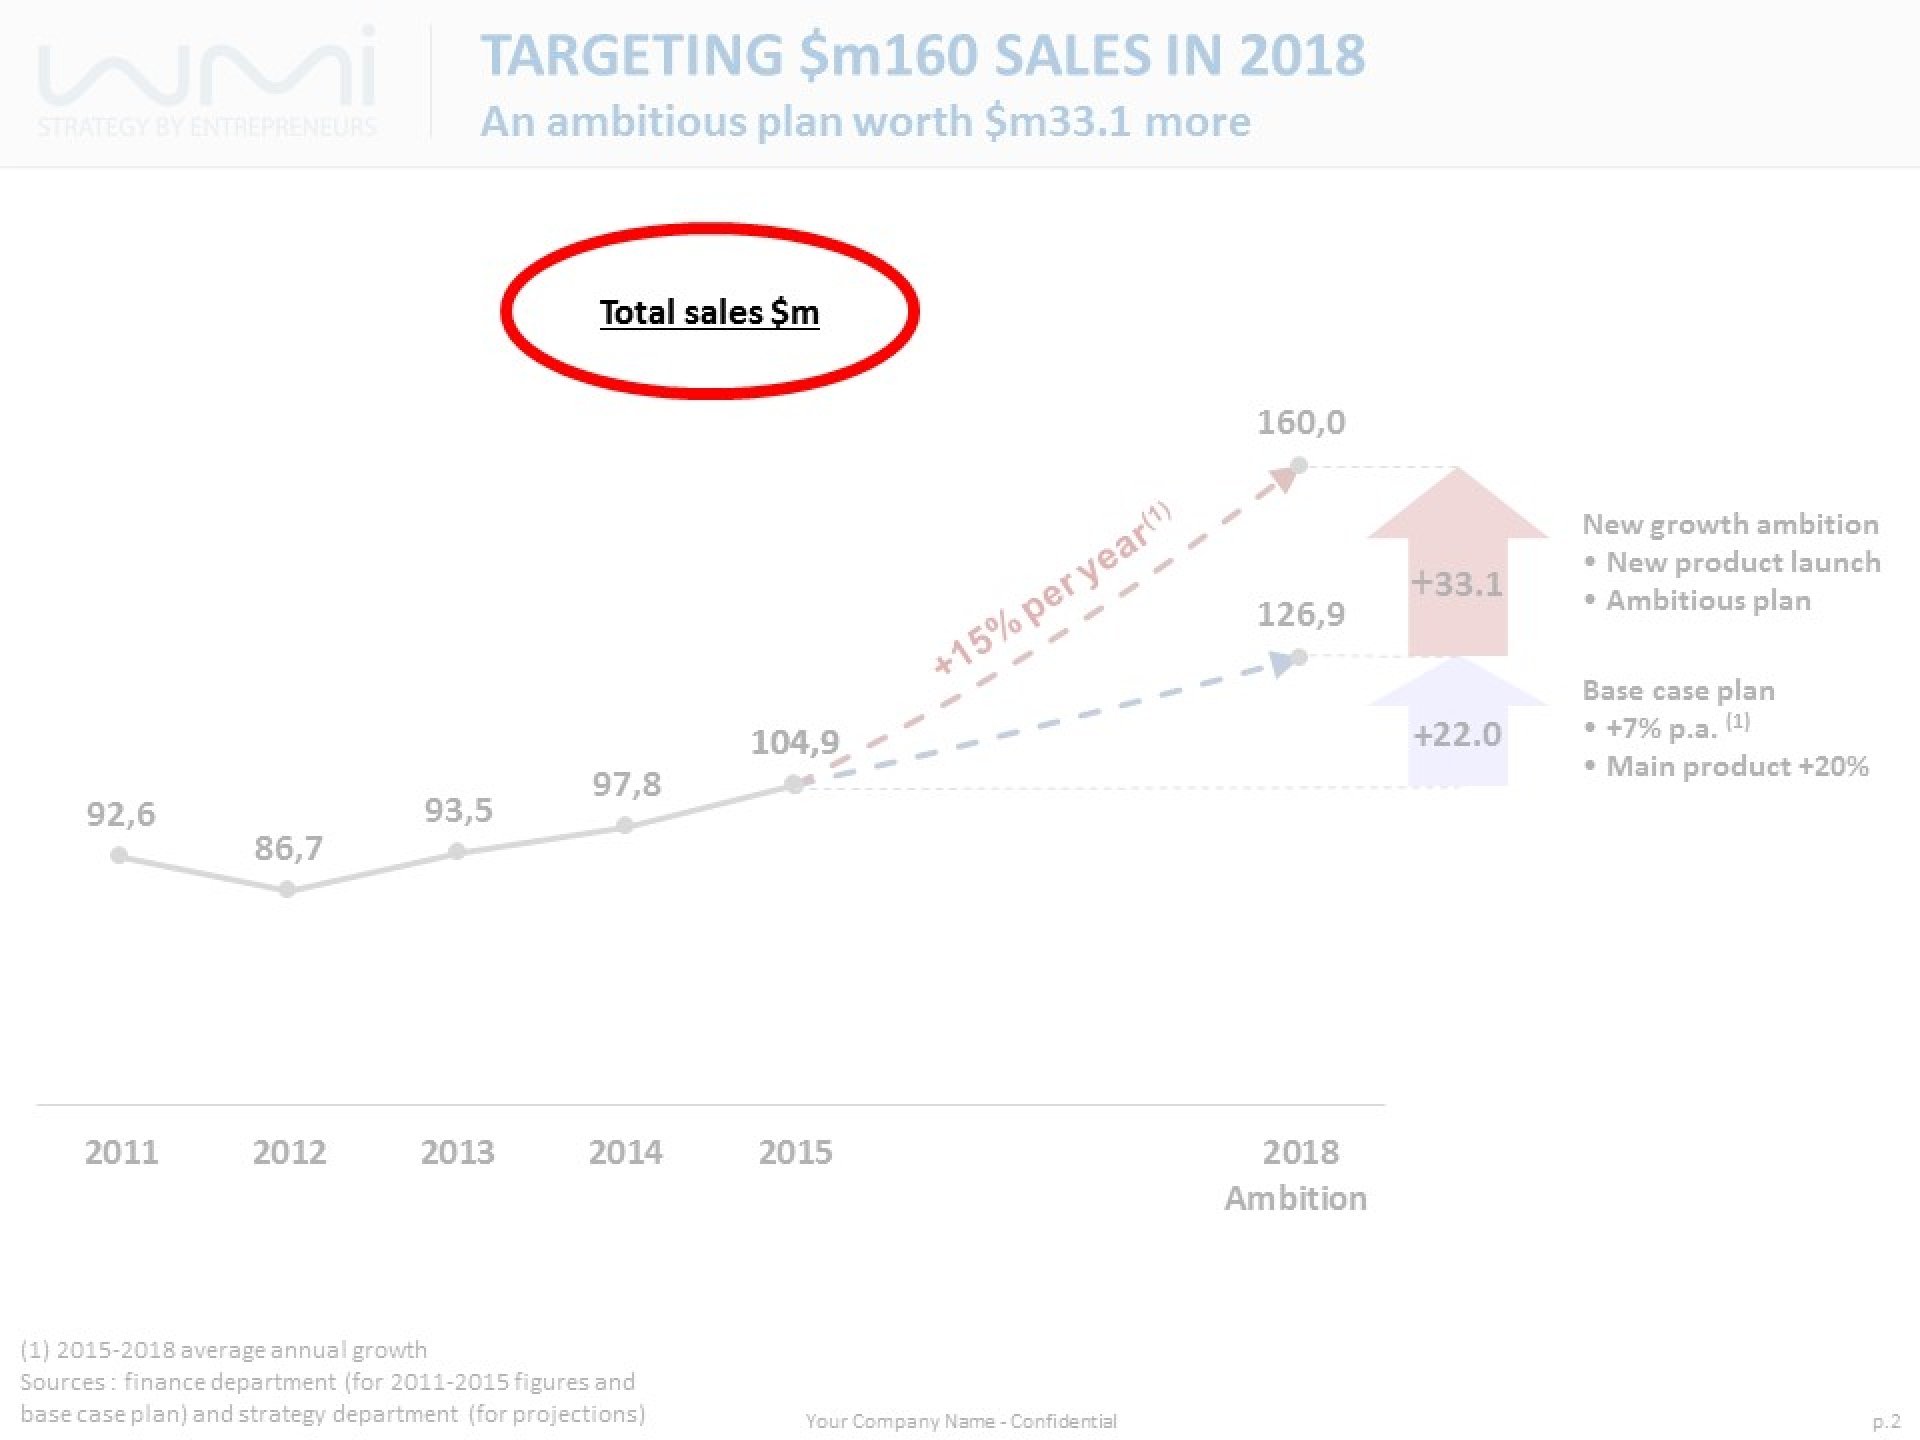
• You wish to provide extra detail on the numerical projections of your strategy
• You are cautious about raising overly high expectations of your new strategy
Reviews
Write a review
- Great VisualVery useful aid which is very practical to use.
People using this Best Practice also downloaded
More Best Practices from WMI Consulting
Compared features of competition
Show a clear comparison of your competitors' key features4,398Discussadd_shopping_cart$6.00by WMI Consulting
Actors Mapping
Map actors or market segments on a single page to qualify your market and spot business opportunities.1,222Discussadd_shopping_cart$6.00by WMI Consulting
Competitor Key Figures
An overview of your competitor's main figures evolution through several graphs.1,566Discussadd_shopping_cart$10.00by WMI Consulting
Acquisition Synergies
Communicate the main synergies between your group and a company you are considering for a potential acquisition1,965Discussadd_shopping_cart$6.00by WMI Consulting
History of a company
A graph to illustrate the history and growth of your company322Discussadd_shopping_cart$10.00by WMI Consulting
4-year streamlined revenue statement
A simplified format of 3 business units' revenue statements over 4 years.459Discussadd_shopping_cart$6.00by WMI Consulting
Long-list and criteria
A table that shows your evaluation and ranking of potential partners or acquisition targets458Discussadd_shopping_cart$6.00by WMI Consulting
Sales growth contribution
Produce a bridge graph that shows your individual brands' contribution to overall sales growth.5854add_shopping_cart$10.00by WMI Consulting
Financial risks evaluation
Highlight and explain the financial risks of a revenue statement scenario.414Discussadd_shopping_cart$10.00by WMI Consulting
Critical Analysis of a Venture P&L
Create an annotated short-term outlook of a company's financial projections. For M&A/Investment/Negotiation contexts.651Discussadd_shopping_cart$10.00by WMI Consulting
Creation of Skills Management Program - Methodology
The key milestones in building your skills management program.2043add_shopping_cart$6.00by WMI Consulting
Country Evaluation
Give a clear benchmark of your potential national markets.526Discussadd_shopping_cart$4.00by WMI Consulting
Any questions on Growth Boost Chart?
The user community and author are here to help. Go ahead!