
Originally published: 11/07/2020 05:27
Last version published: 17/05/2021 07:32
Publication number: ELQ-67817-2
View all versions & Certificate
Last version published: 17/05/2021 07:32
Publication number: ELQ-67817-2
View all versions & Certificate

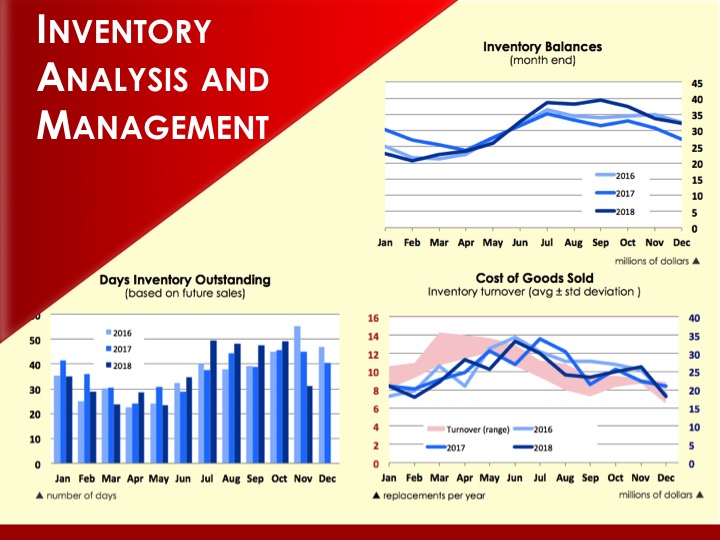
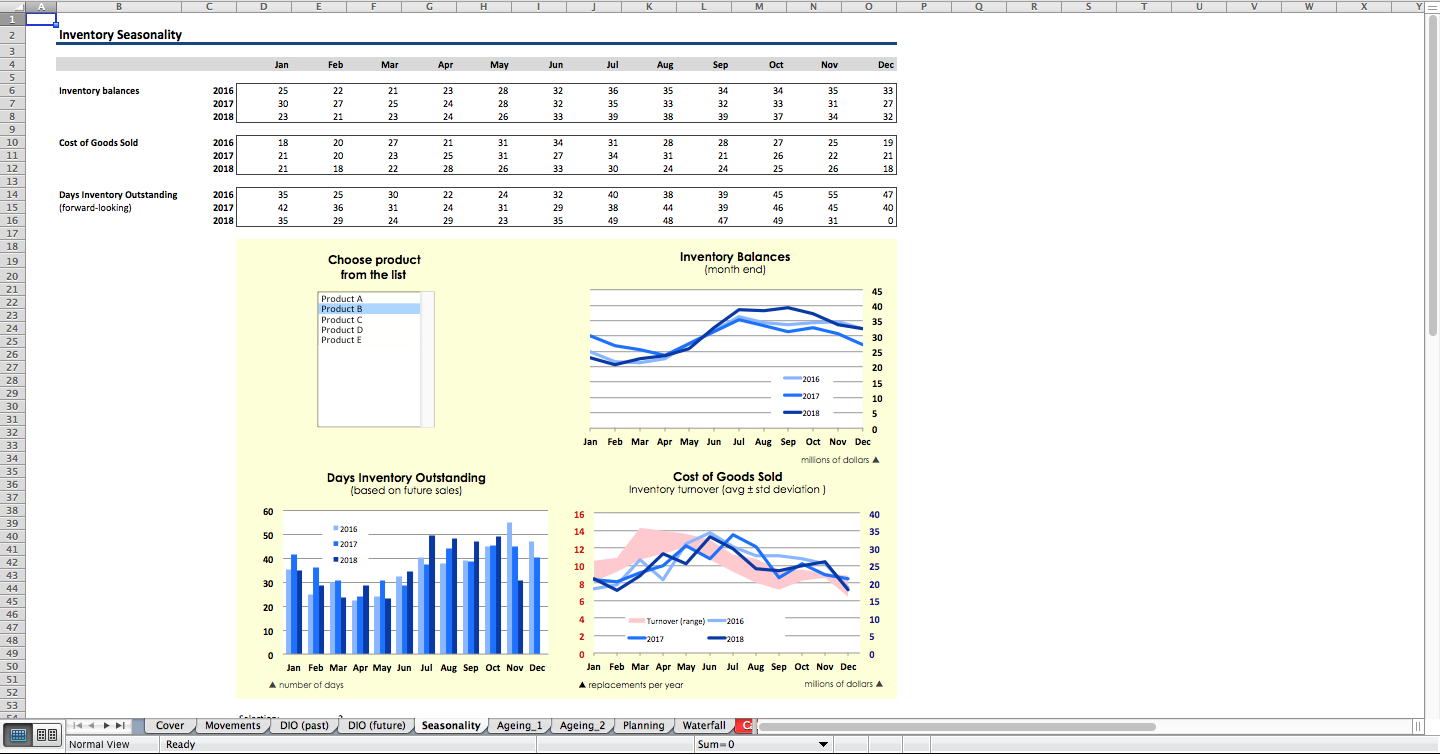
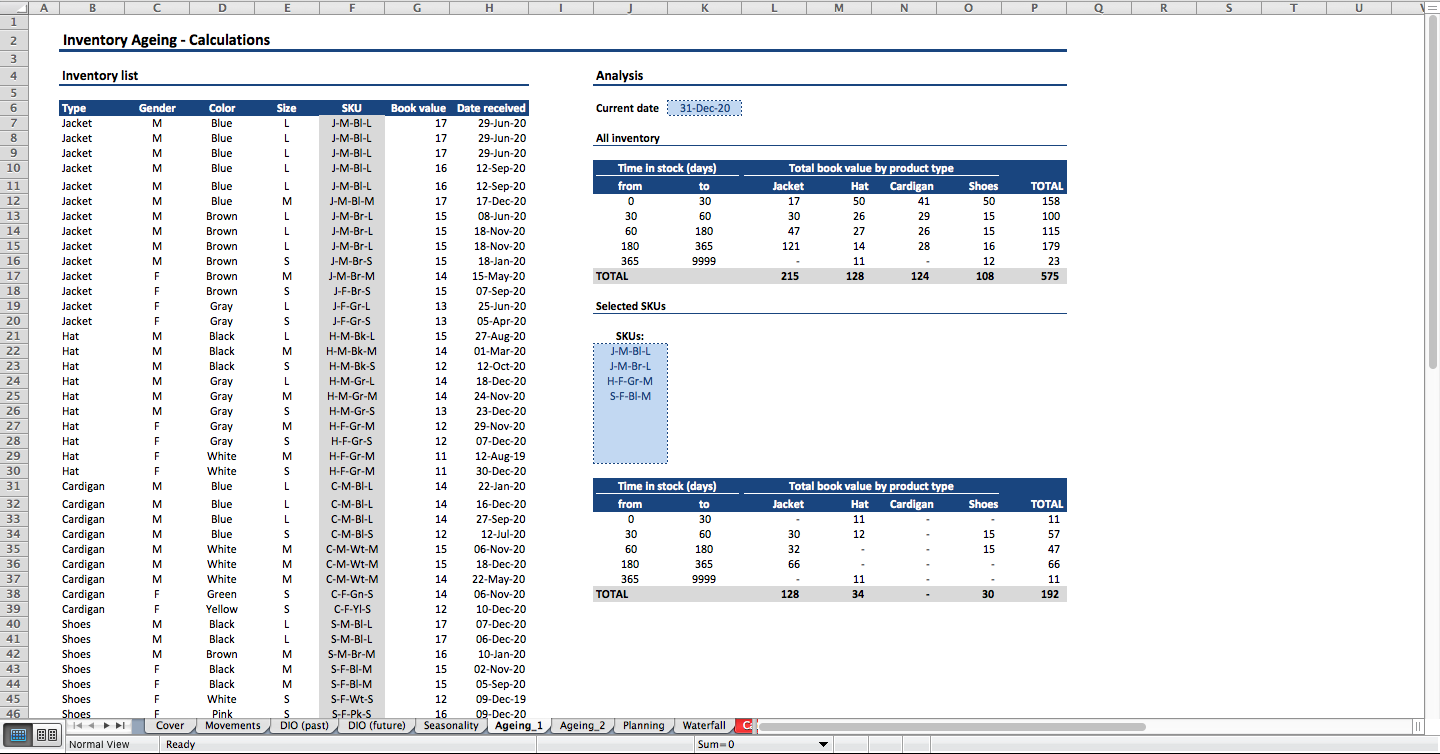
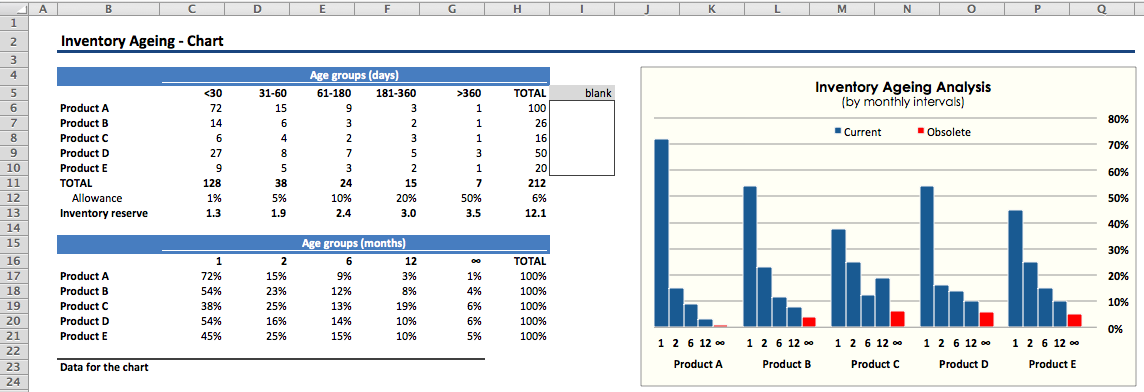
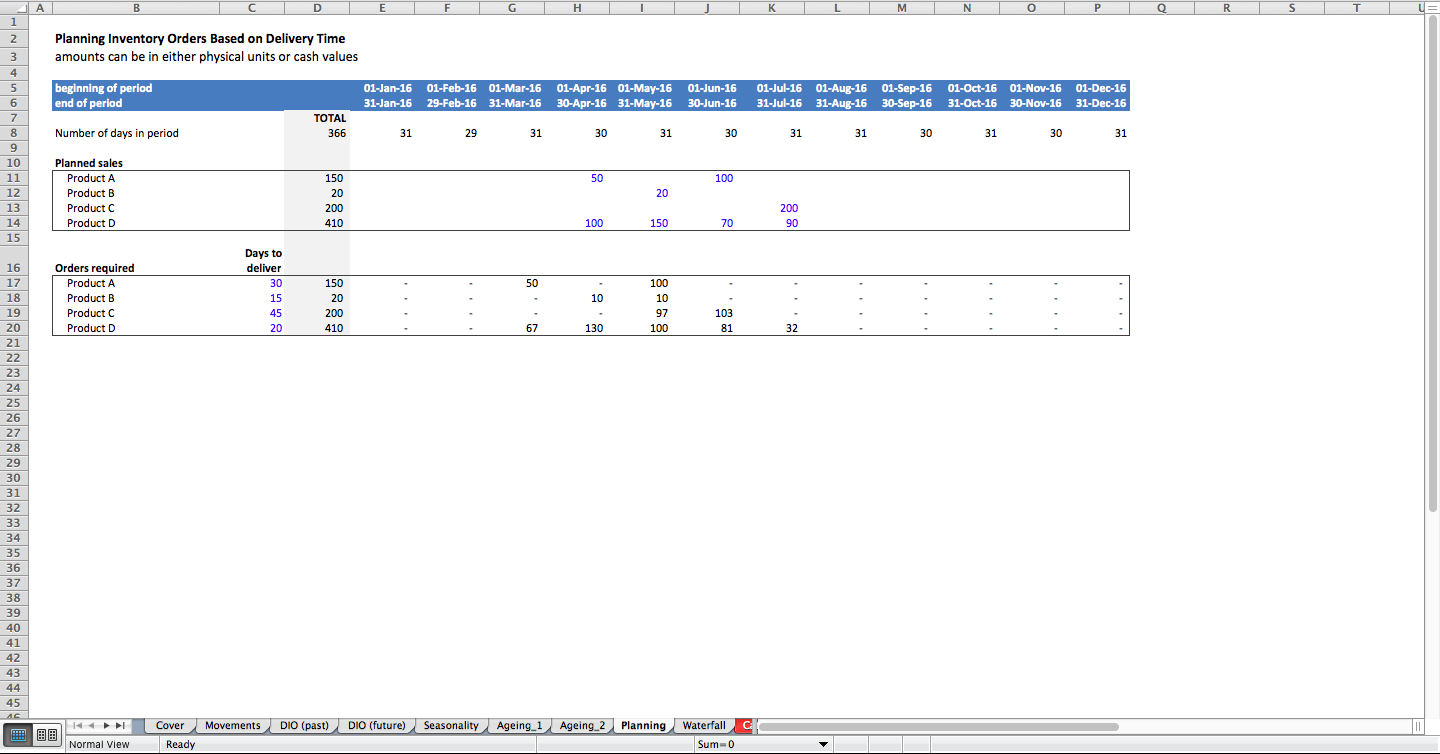
Inventory Analysis and Management
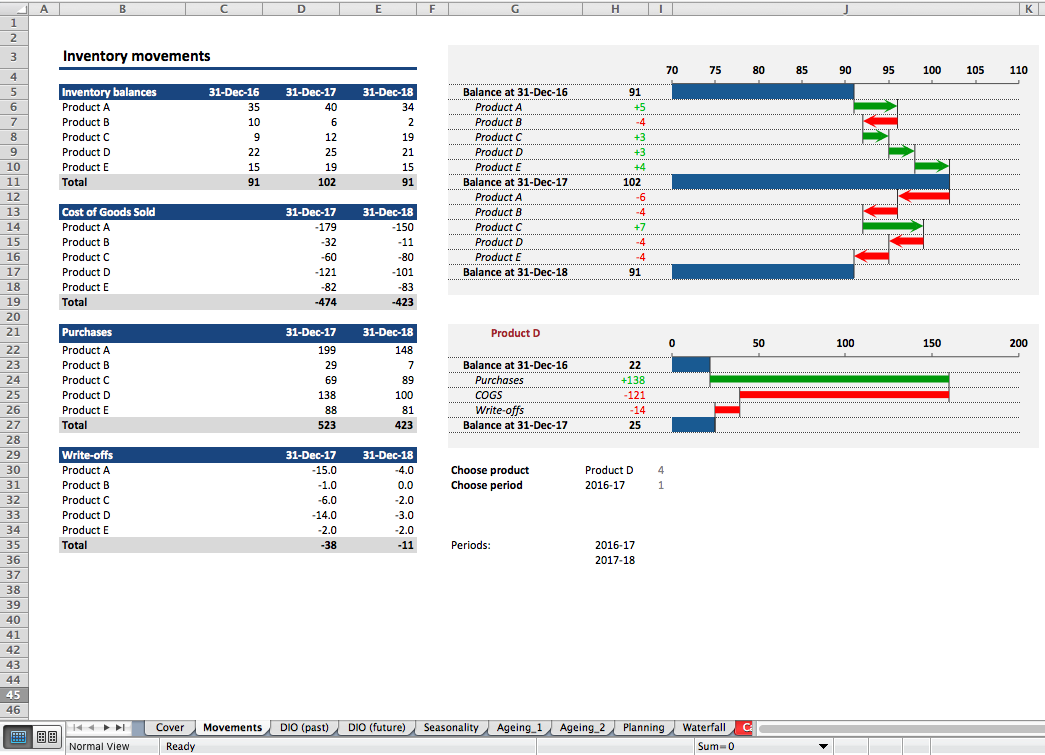
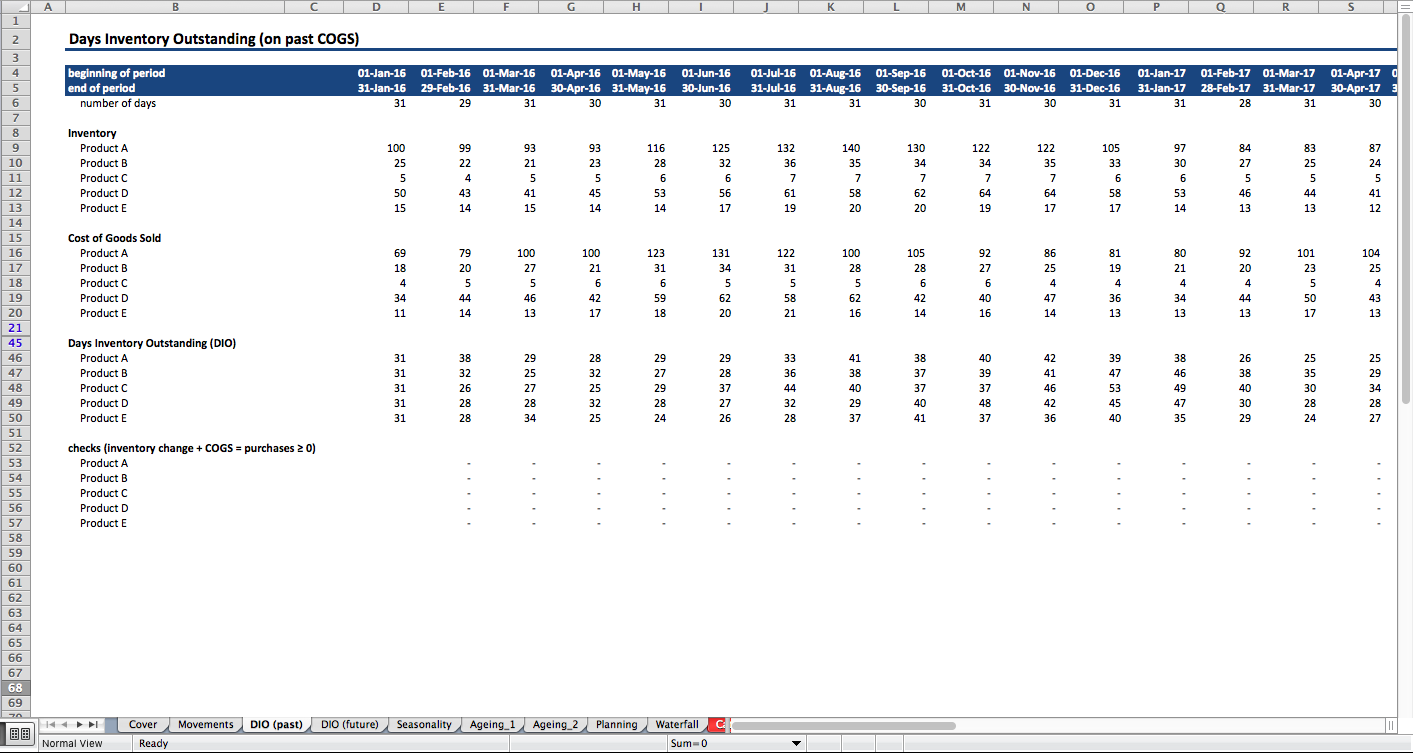
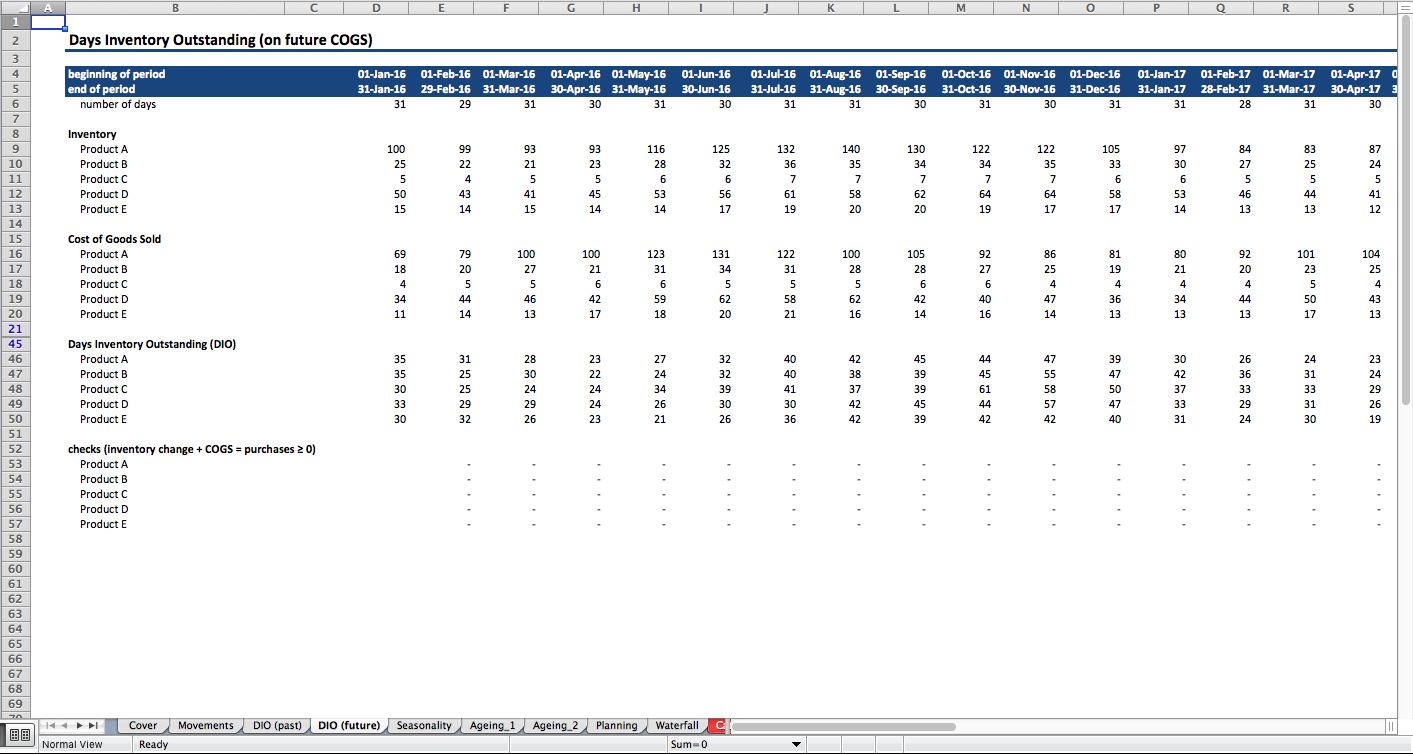
Inventory balance movements, days inventory outstanding (DIO), turnover, seasonality, aging analysis, planning orders
Further information
Comprehensive analysis of inventory
Applicable to any production or selling business holding an inventory stock
n/a
