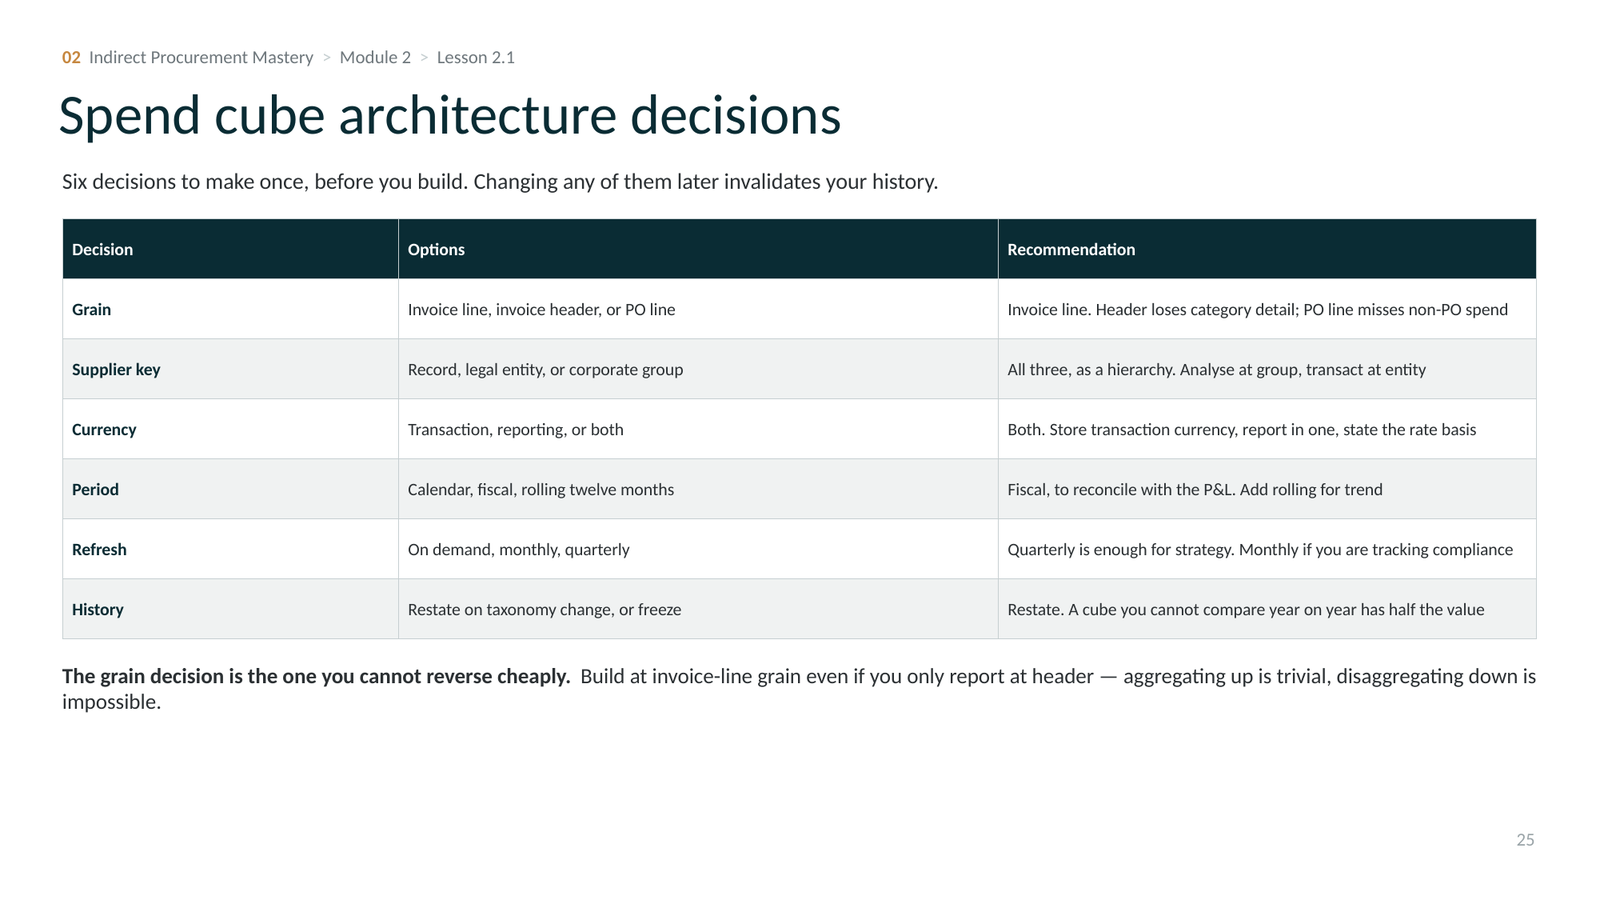
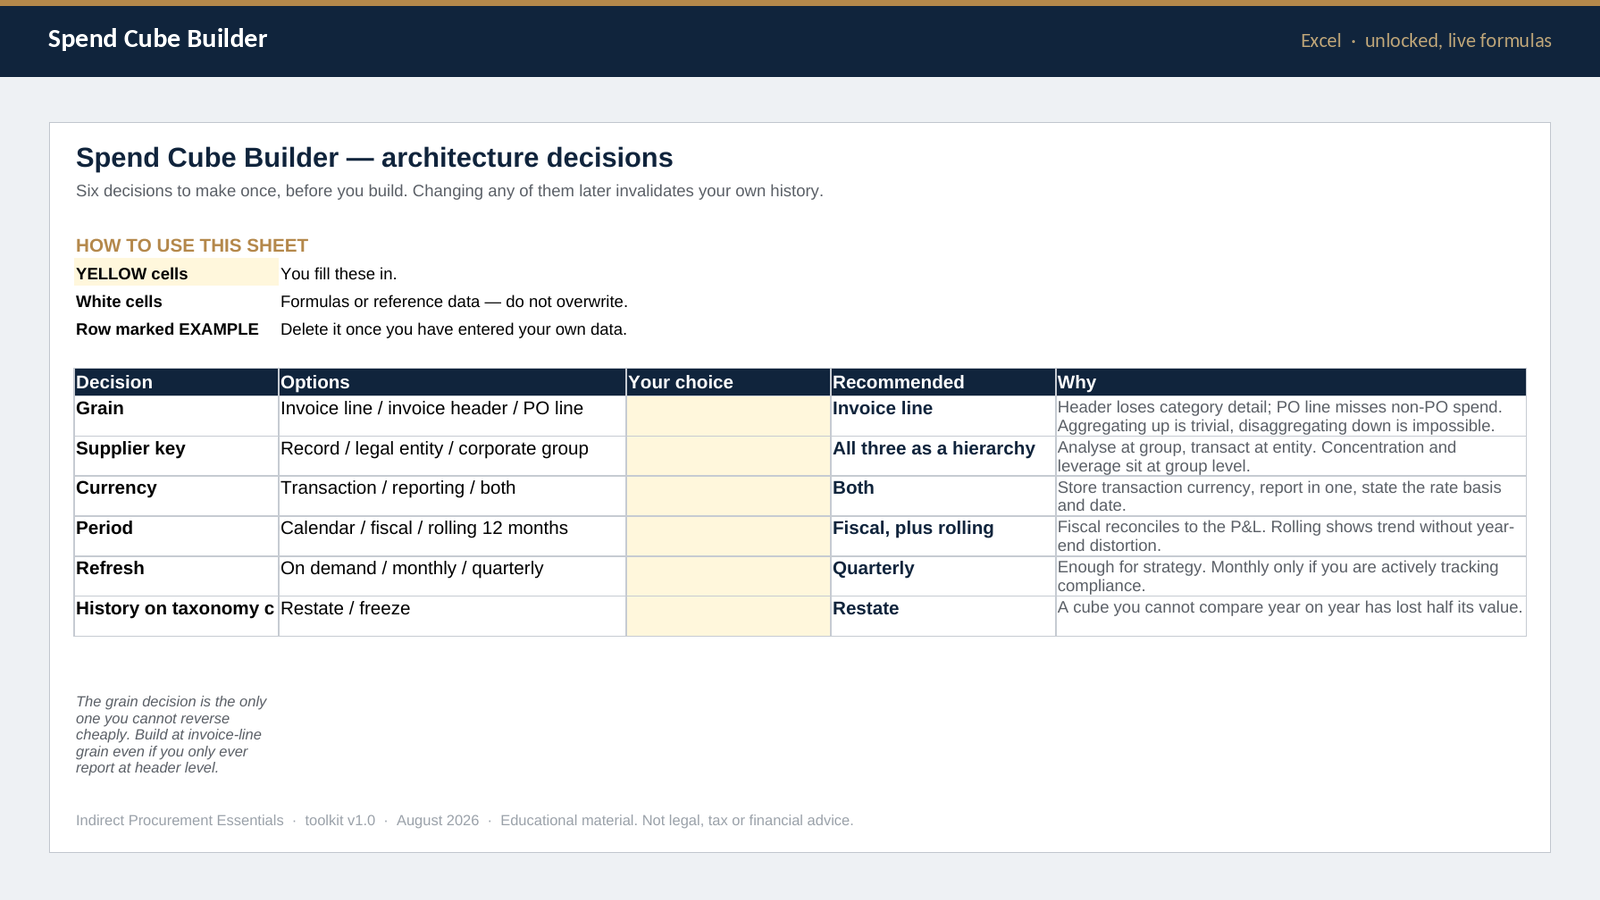
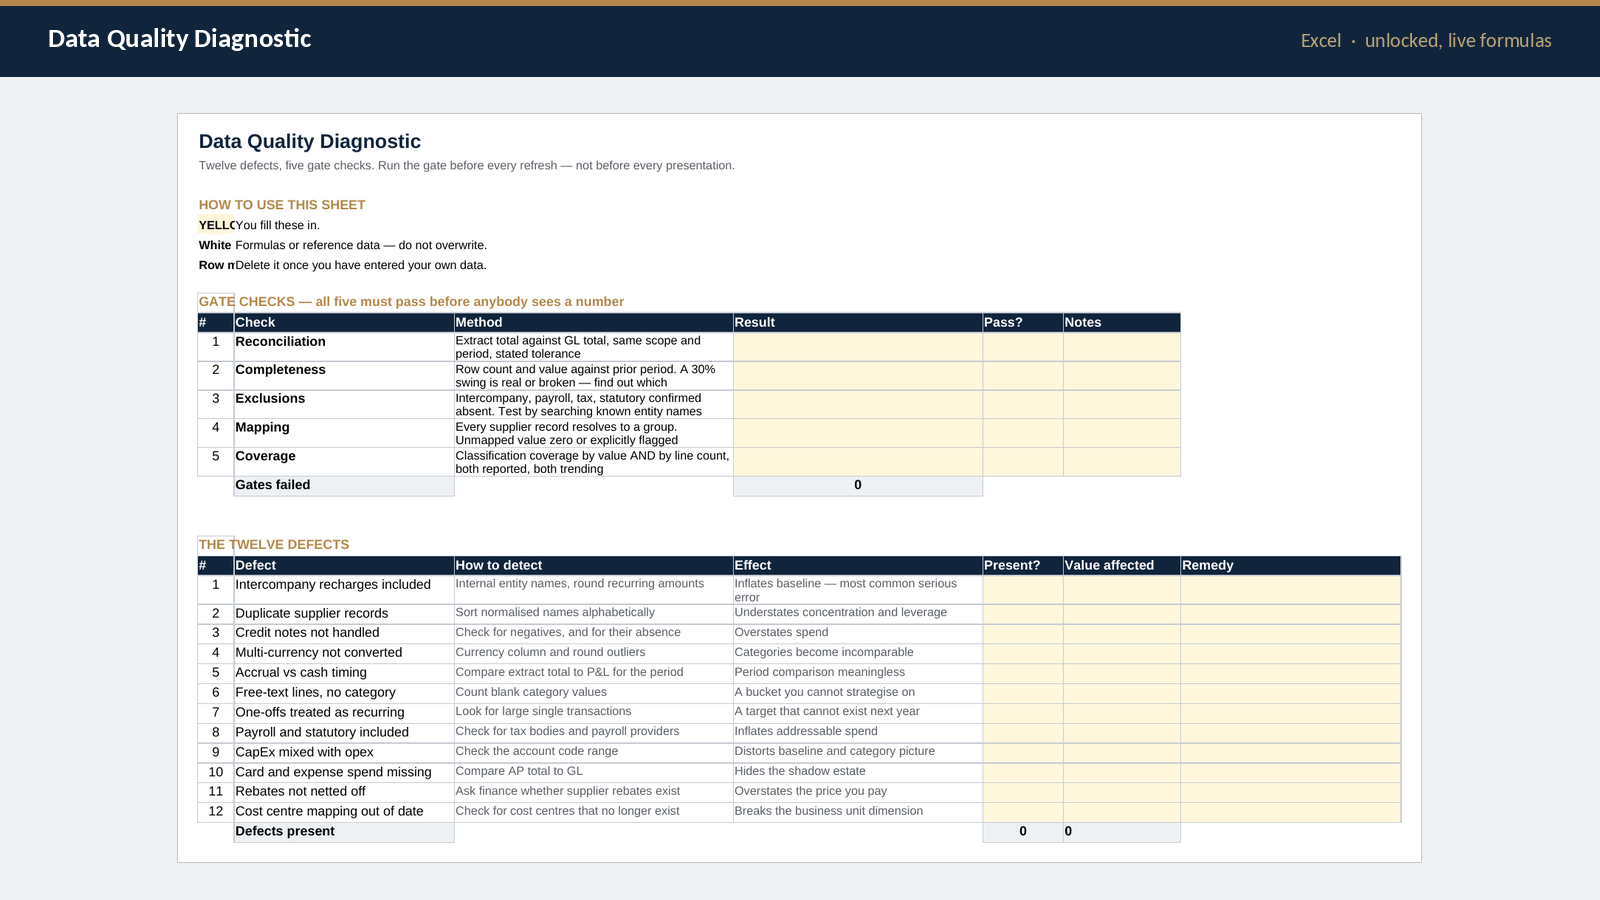
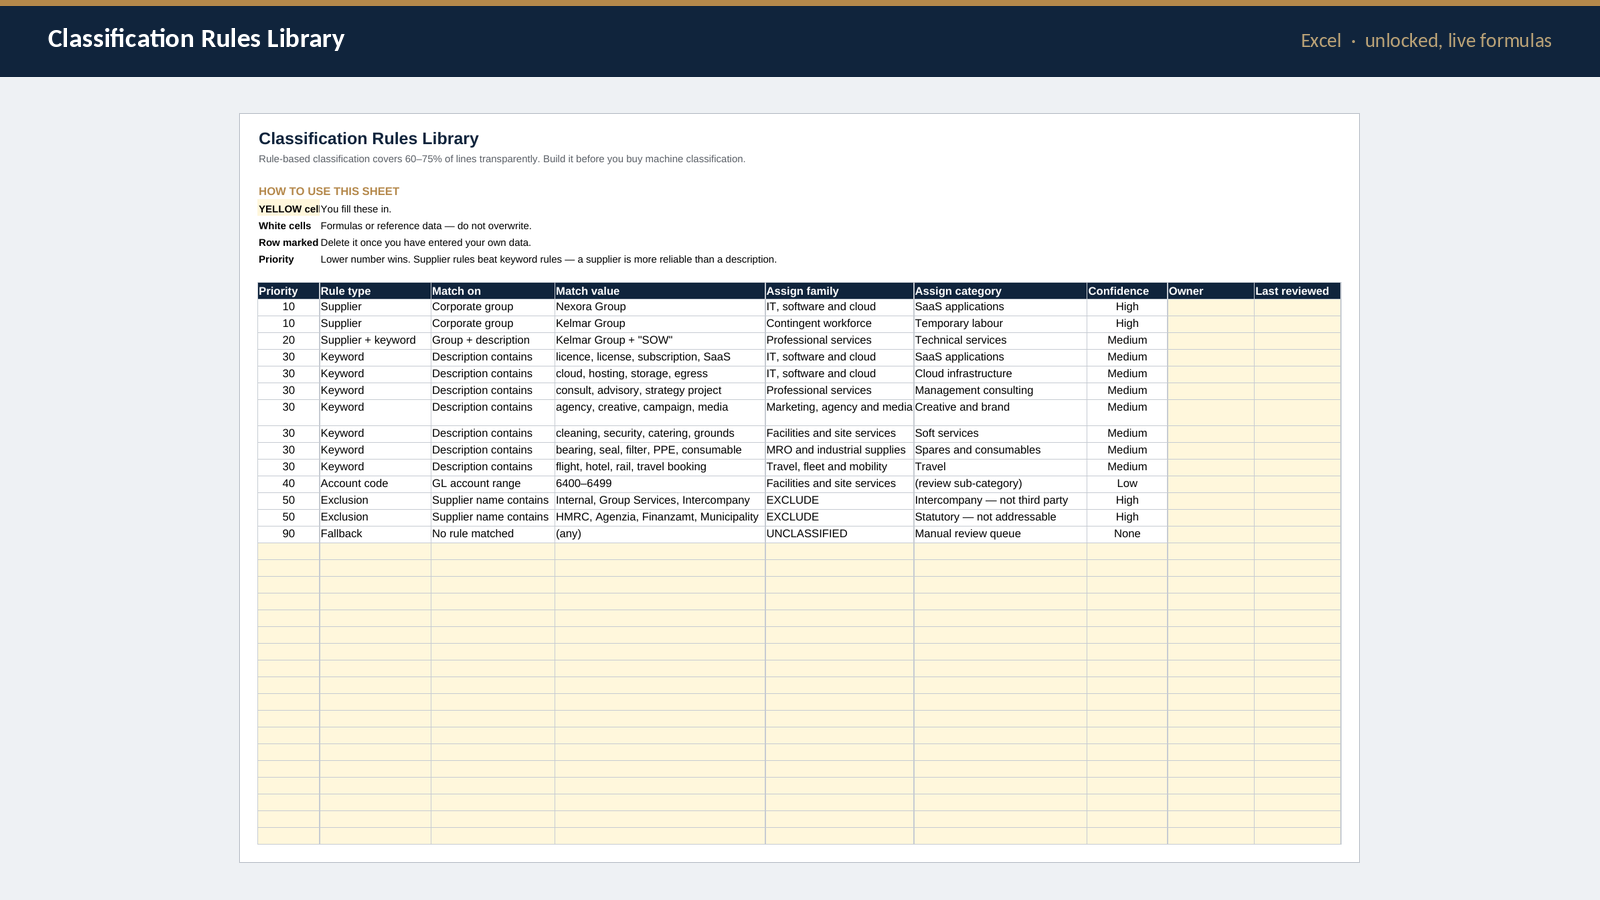
Spend Analysis and Spend Cube Toolkit — Cube Builder, Taxonomy Design, 12 Data Defects, Opportunity Pipeline
Originally published: 31/08/2026 09:29
Publication number: ELQ-13496-1
View all versions & Certificate
certified

Spend Analysis and Spend Cube Toolkit — Cube Builder, Taxonomy Design, 12 Data Defects, Opportunity Pipeline

Turn a raw ERP extract into a spend cube you can defend in front of a CFO.

Description
Everything required to turn a raw ERP extract into a spend cube that survives scrutiny, and then into a ranked, sized opportunity pipeline.

The part most spend analysis templates skip is data quality. This toolkit does not. The diagnostic tests for the twelve defects a real extract contains — duplicate supplier records, hidden parent-child relationships, uncoded free-text lines, intercompany recharges, one-off settlements that are not addressable — before any analysis begins. Analysis run on unnormalised data systematically understates concentration, risk and negotiating leverage, and it does so invisibly.

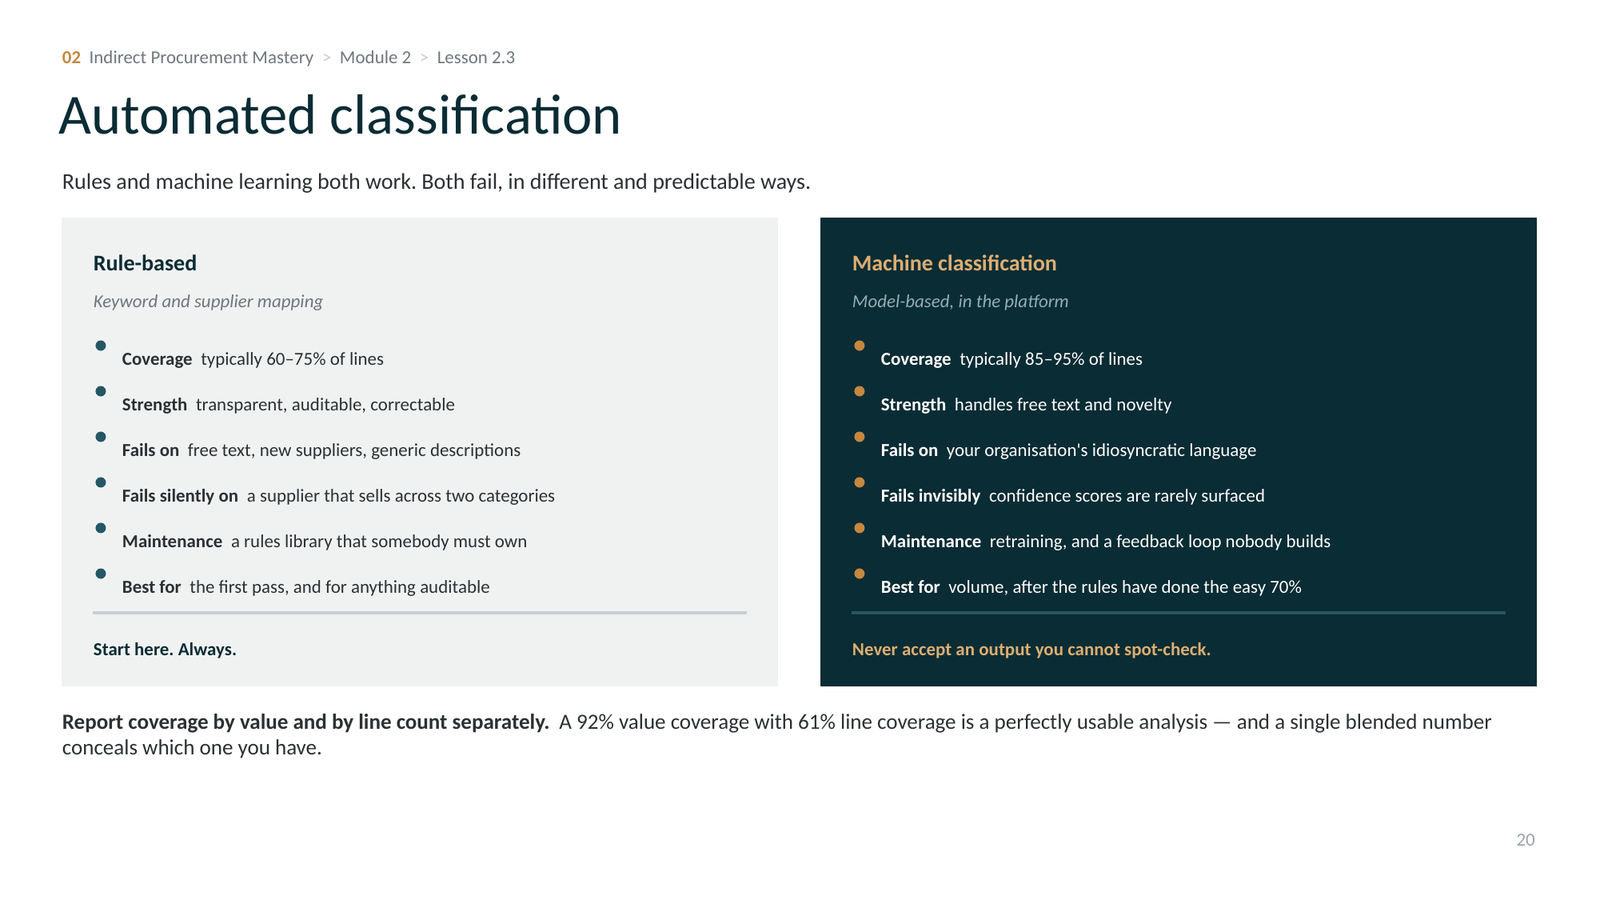
The taxonomy guide covers the choice between UNSPSC, a custom structure and a hybrid, and how to pick one you will still be able to live with in three years. The classification rules library gives you rule-based coding and an honest account of where automated classification fails.

All four workbooks are unlocked with live formulas, a worked example row and a blank working area. The consistent colour convention tells you at a glance what you may type over.

Who it is for: analysts and category managers building spend visibility for the first time, and procurement leads who inherited a cube nobody trusts. You need an ERP or accounts payable extract carrying supplier, amount, date and some description field. You do not need a data warehouse, a specialist analytics tool or a consultant — everything here runs in Excel.

What it is not: this is not a classification service and it does not ship a finished taxonomy for your business. It gives you the design decision, the rules library and the data quality diagnostic, and you shape the taxonomy around the organisation you actually have rather than the one a generic template assumes.

This Best Practice includes
1 PowerPoint guide (12 slides), 4 Excel workbooks incl. spend cube builder, 2 Word guides. Unlocked.

Acquire business license for $69.00

Add to cart

Add to bookmarks

Discuss

Further information

• Produce a spend cube across supplier, category and business unit that reconciles to the source extract.
• Test for the twelve data defects before drawing any conclusion.
• Normalise suppliers to corporate group so that concentration and leverage are measured where they exist.
• Convert the analysis into a sized, ranked opportunity pipeline rather than a list of observations.

• You have or can obtain a transaction-level spend extract for the last 12 to 24 months.
• You are starting or rebuilding spend analysis and need a defensible method.
• You need to show a CFO where the addressable spend is and what it is worth.

• You already have a mature spend analytics platform with clean, classified data.
• You need real-time dashboards connected to source systems; these are workbook models.
• Your question is about direct material cost breakdown rather than indirect spend visibility.


0.0 / 5 (0 votes)

please wait...