

Originally published: 13/09/2021 07:51
Last version published: 27/12/2023 09:24
Publication number: ELQ-33625-4
View all versions & Certificate
Last version published: 27/12/2023 09:24
Publication number: ELQ-33625-4
View all versions & Certificate

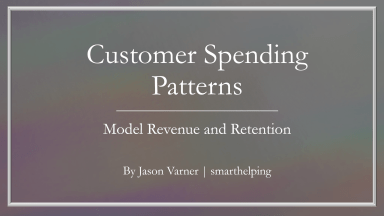
Customer Spending and Retention Pattern Modeling
This is a great calculator with clever logic to model revenues based on dynamic spending and retention patterns of your customers over a 60 month period.
Further information
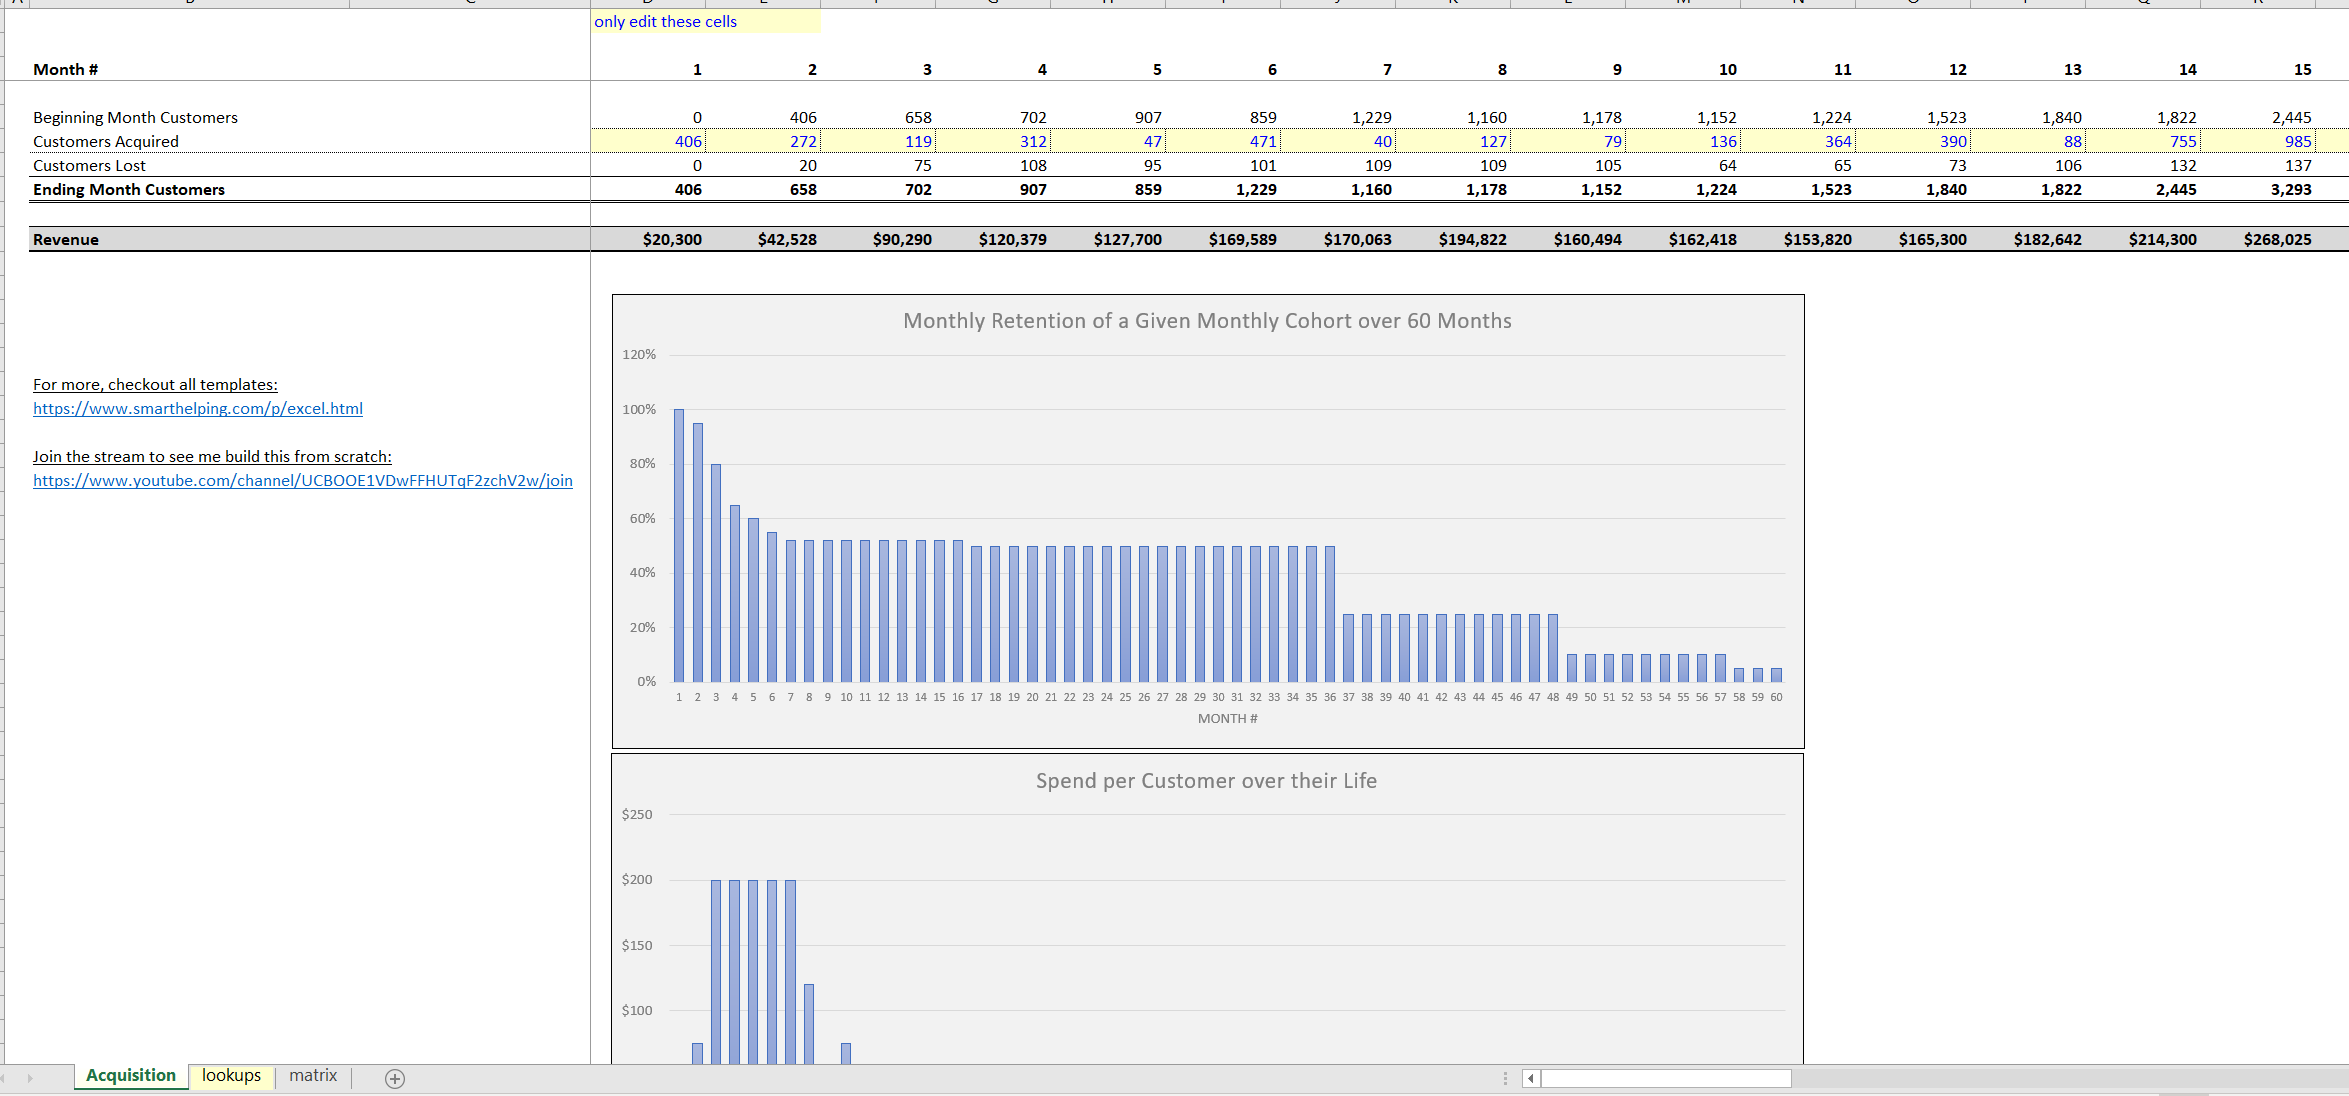
Provide a customer count and revenue forecast for up to 60 months.
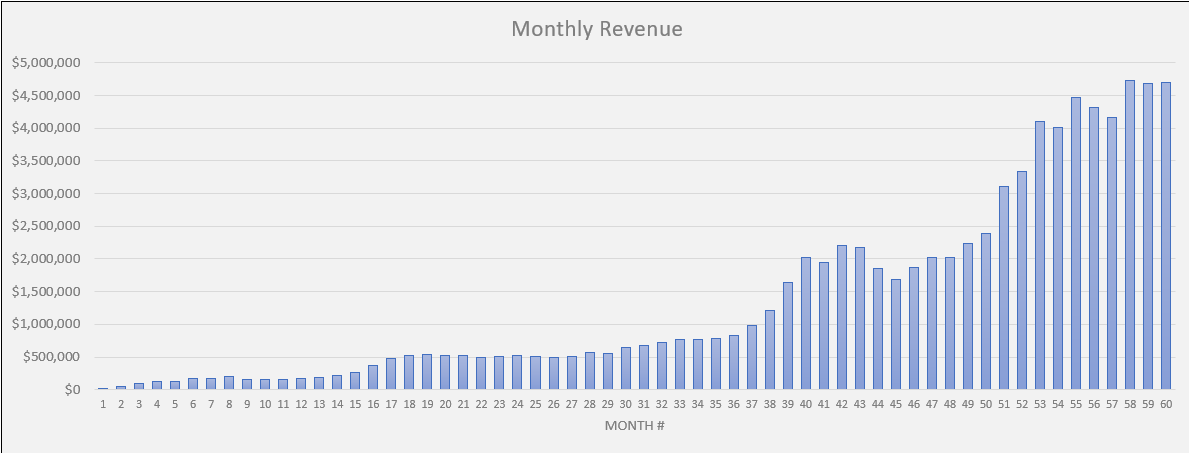
When customer retention and spend follow a dynamic pattern instead of a fixed average value.
If spend and retention are constant.
