
Originally published: 01/02/2021 17:07
Last version published: 30/06/2025 07:57
Publication number: ELQ-86360-6
View all versions & Certificate
Last version published: 30/06/2025 07:57
Publication number: ELQ-86360-6
View all versions & Certificate

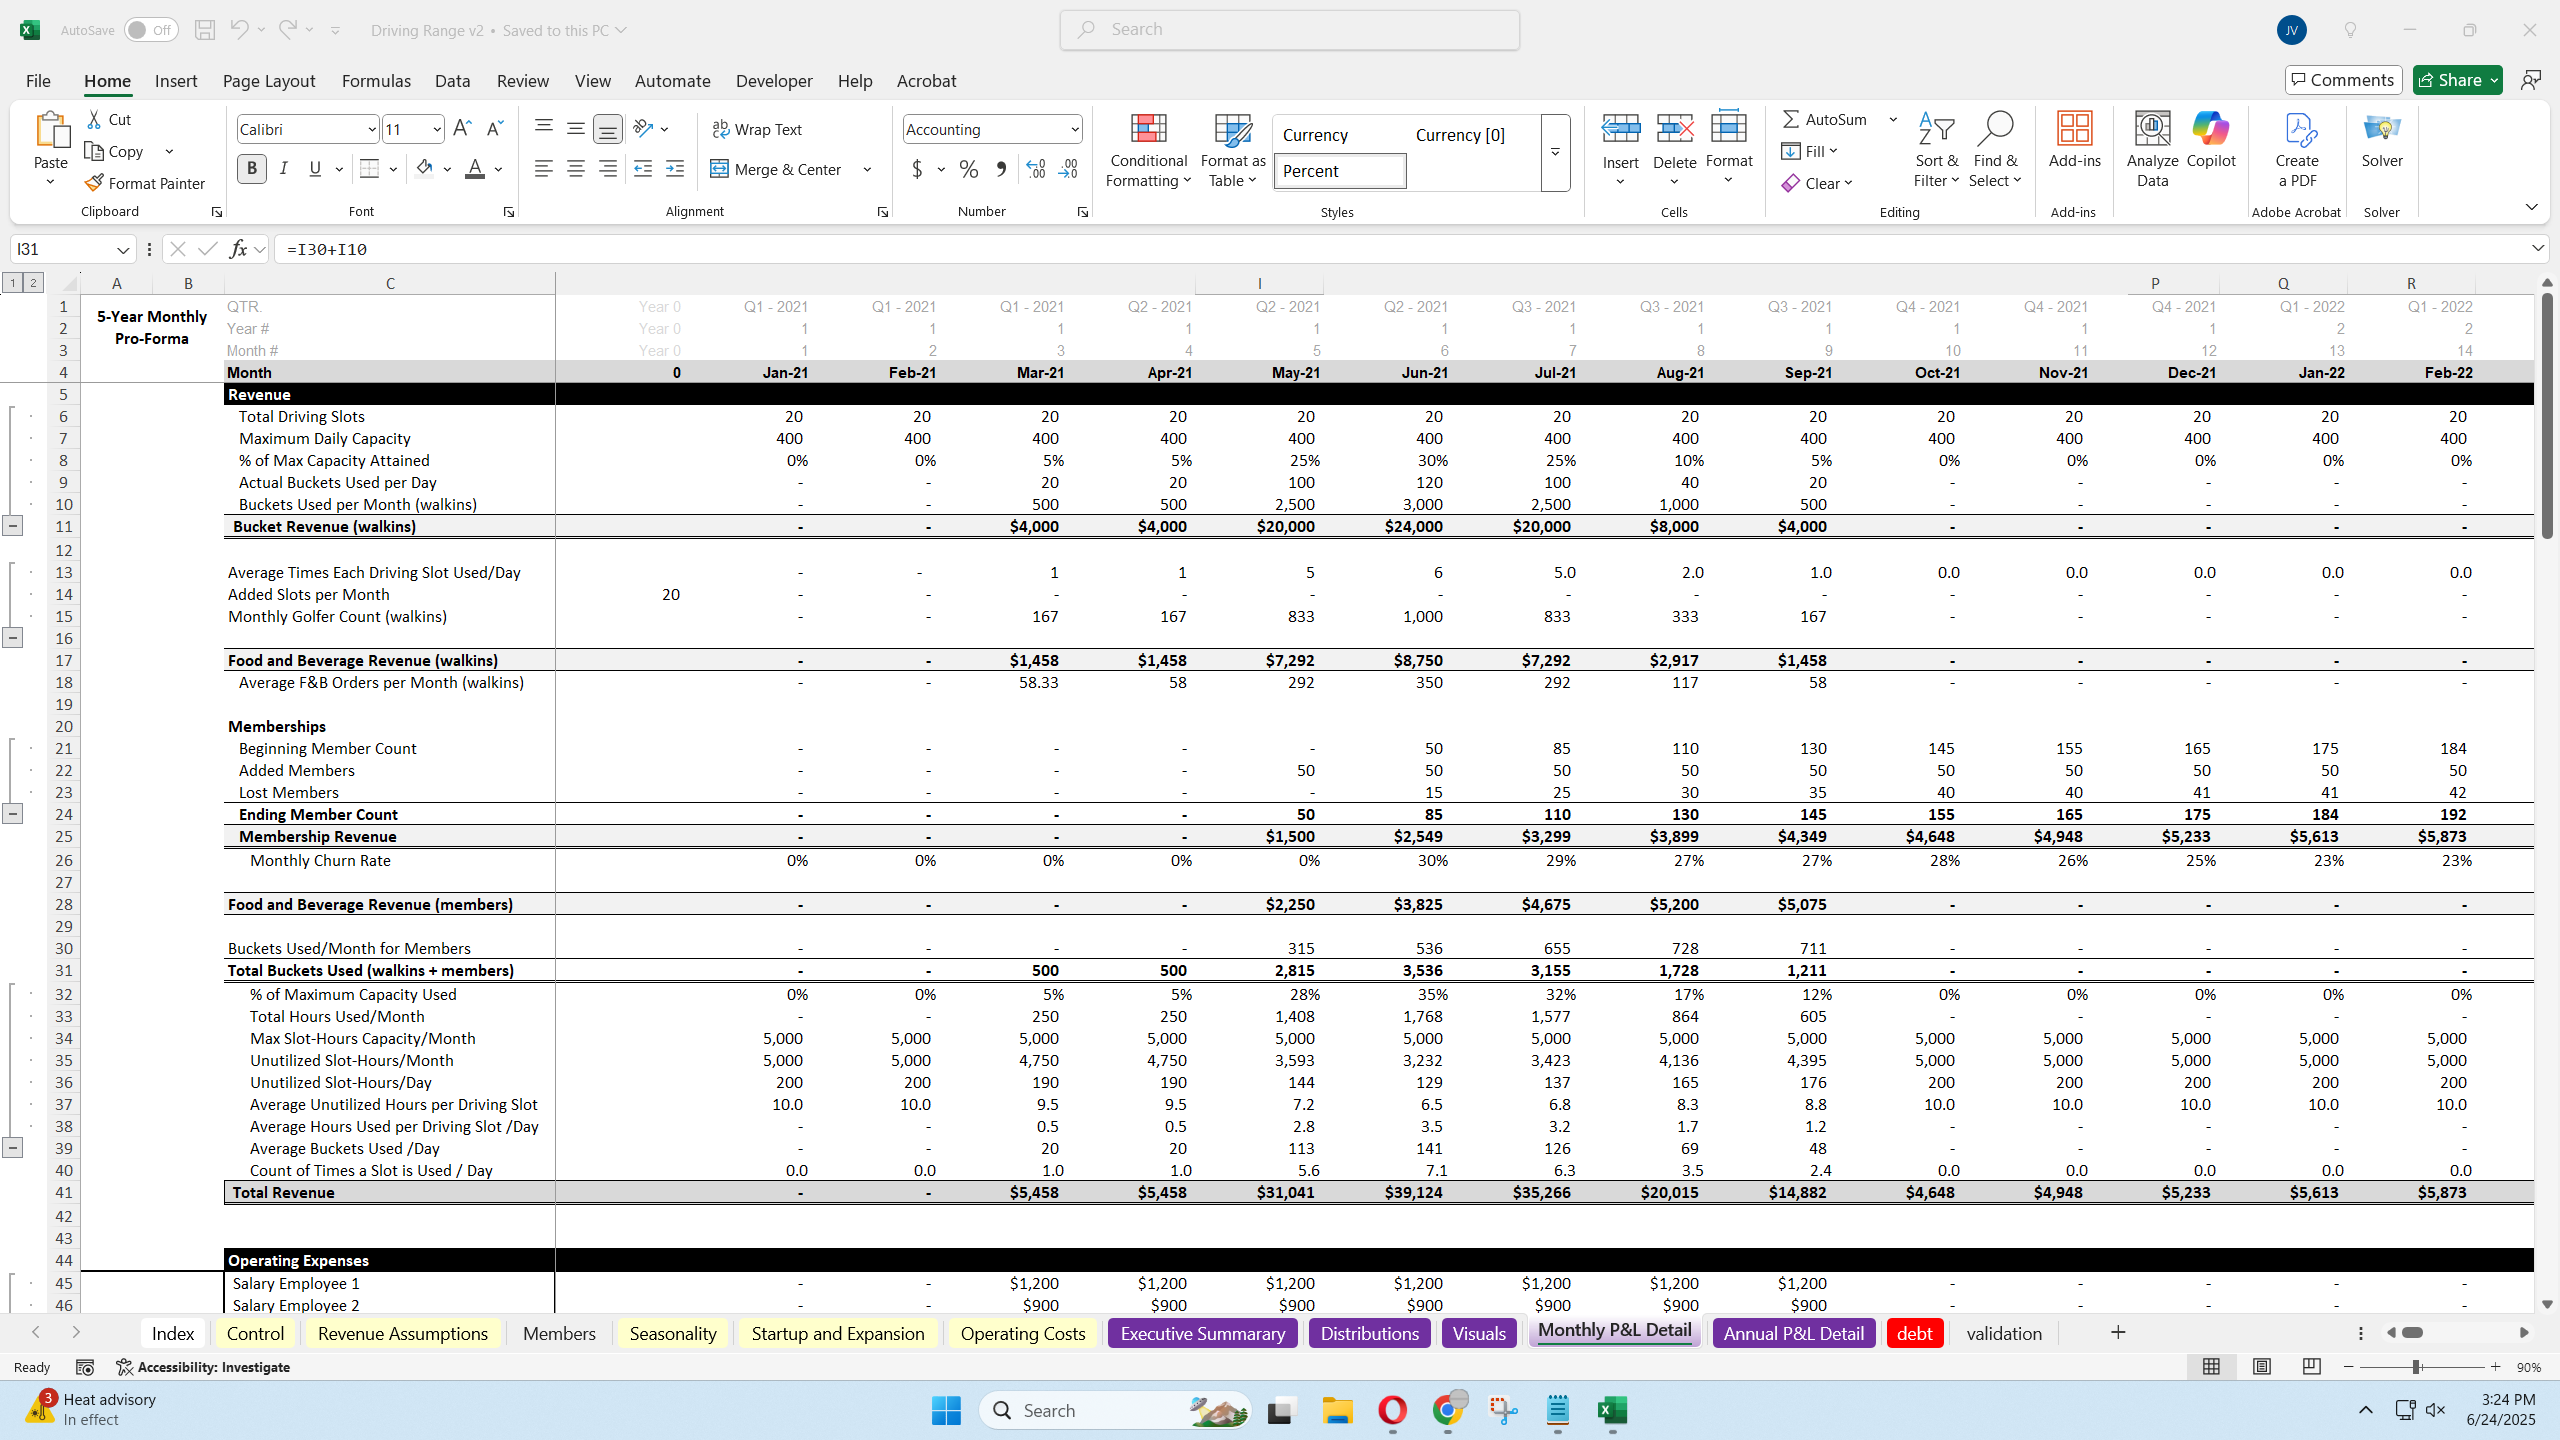
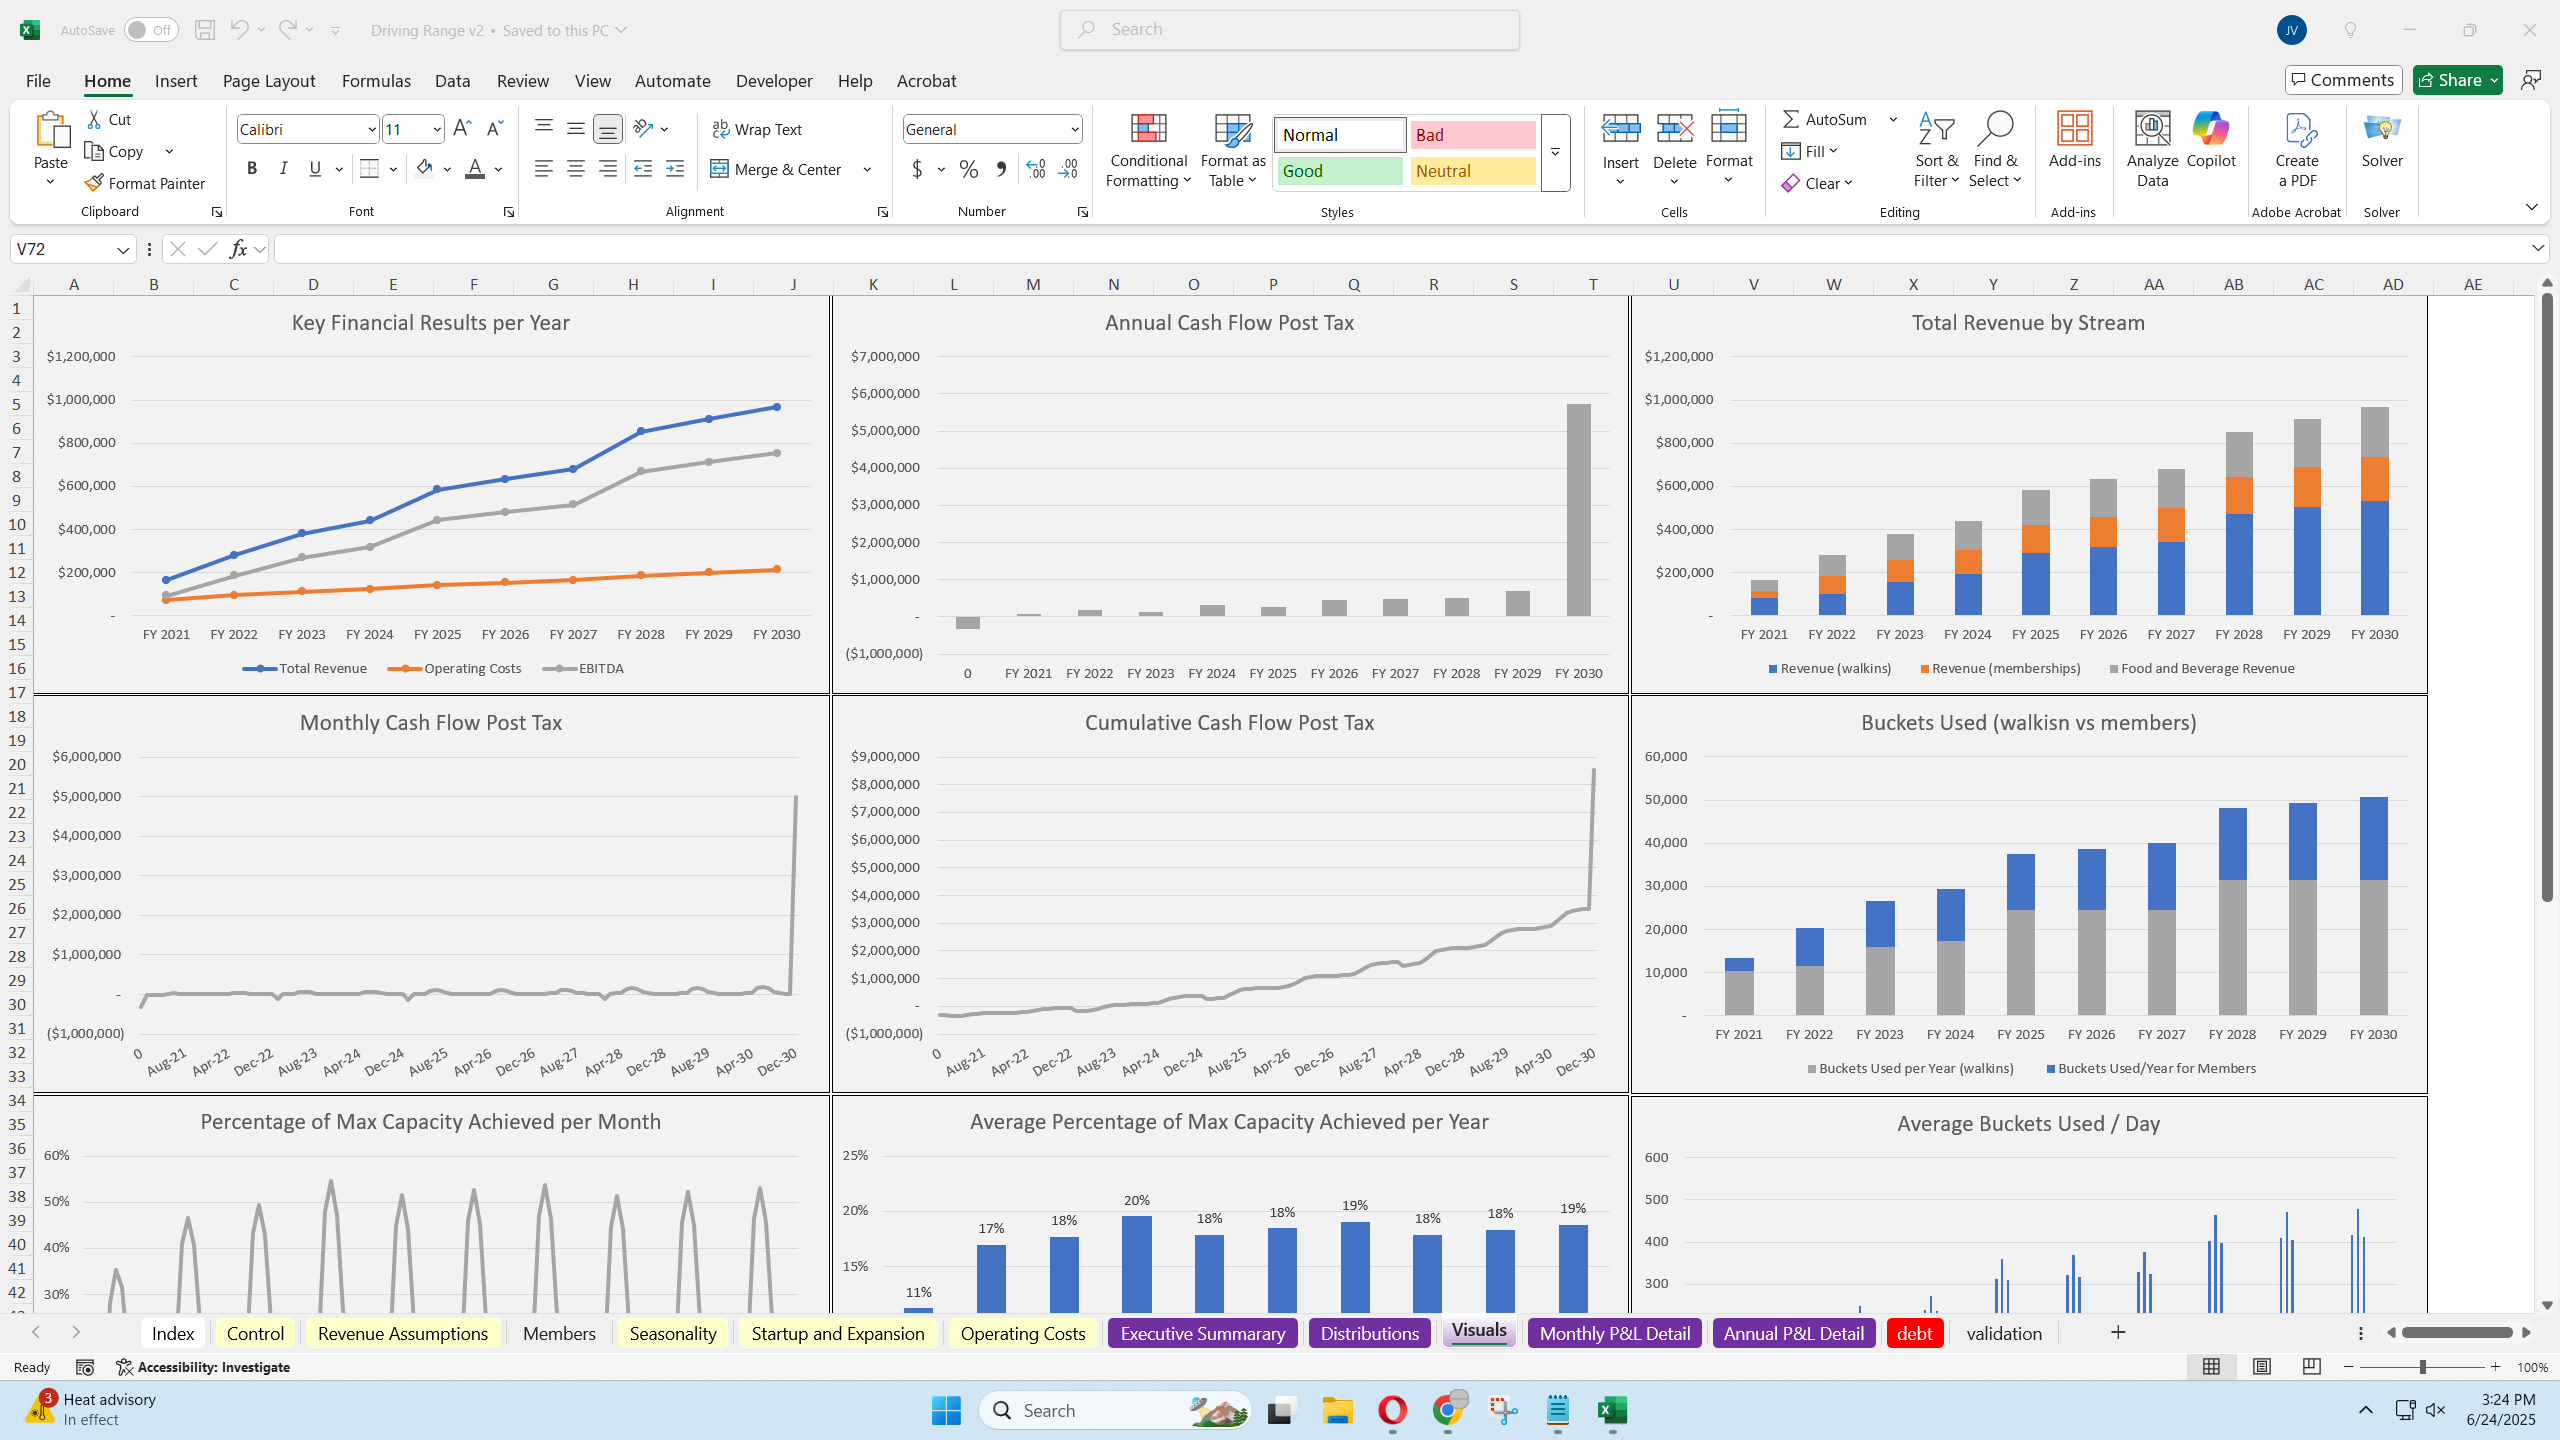
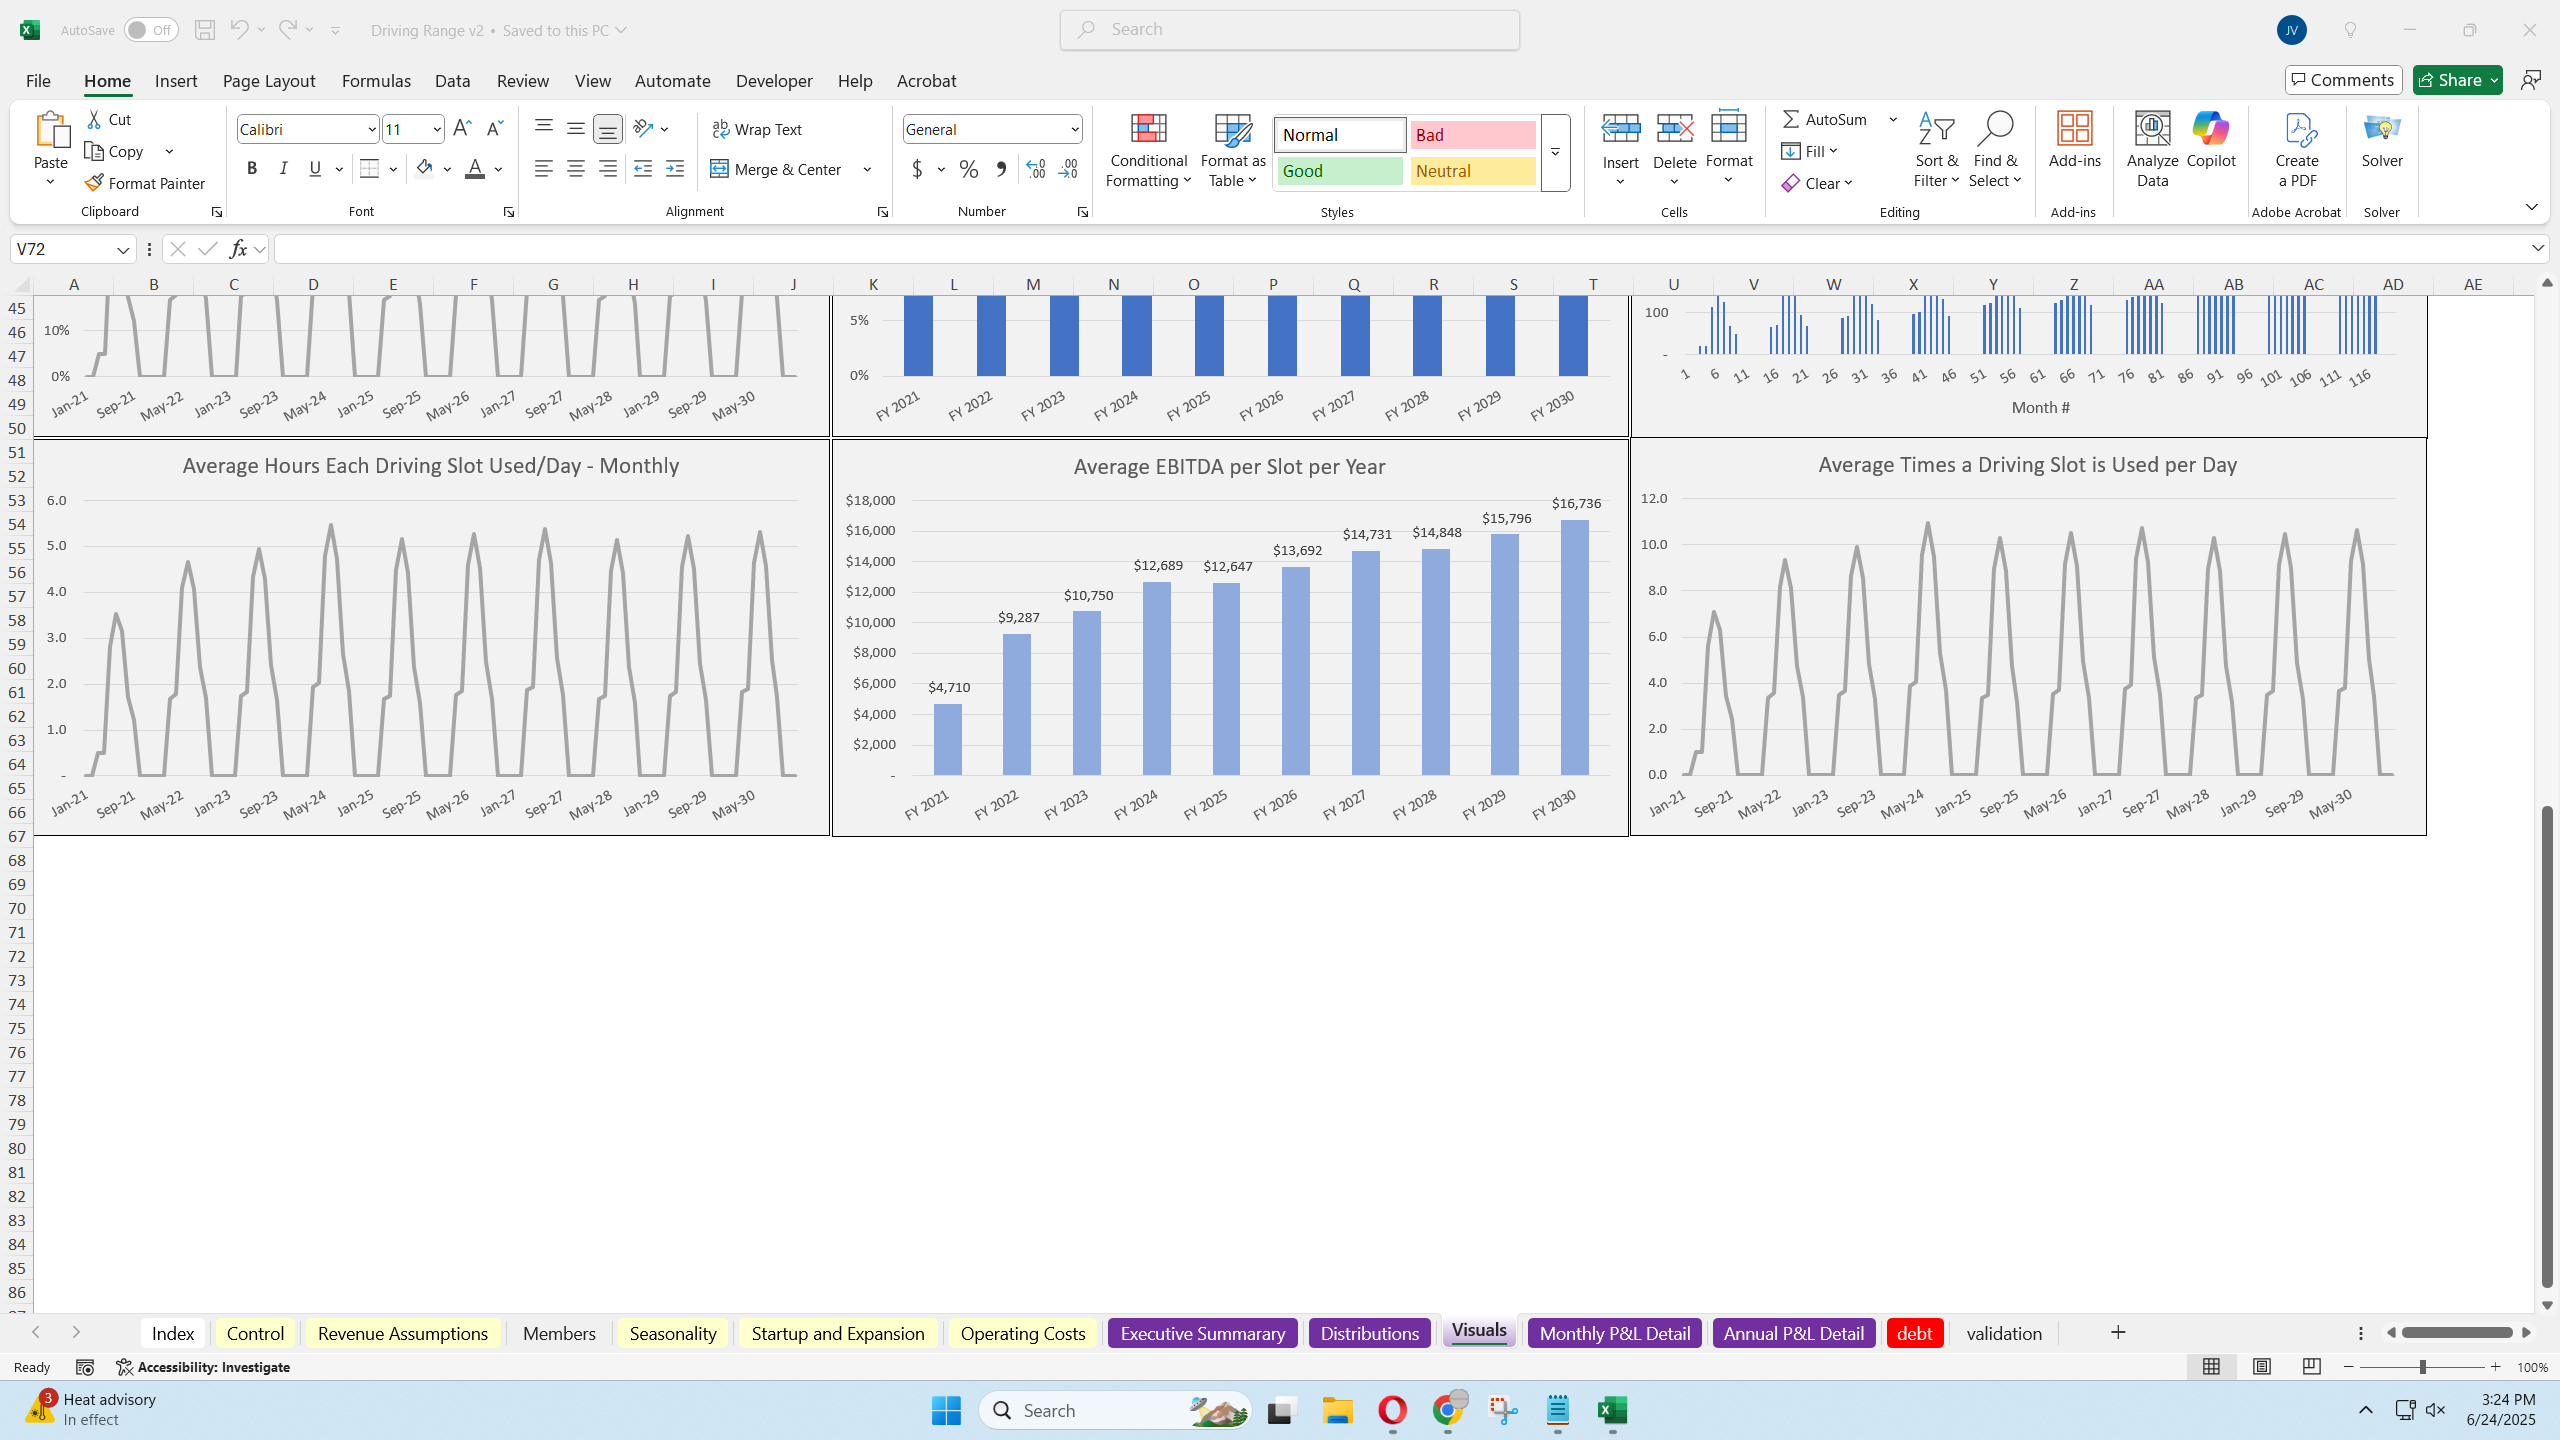
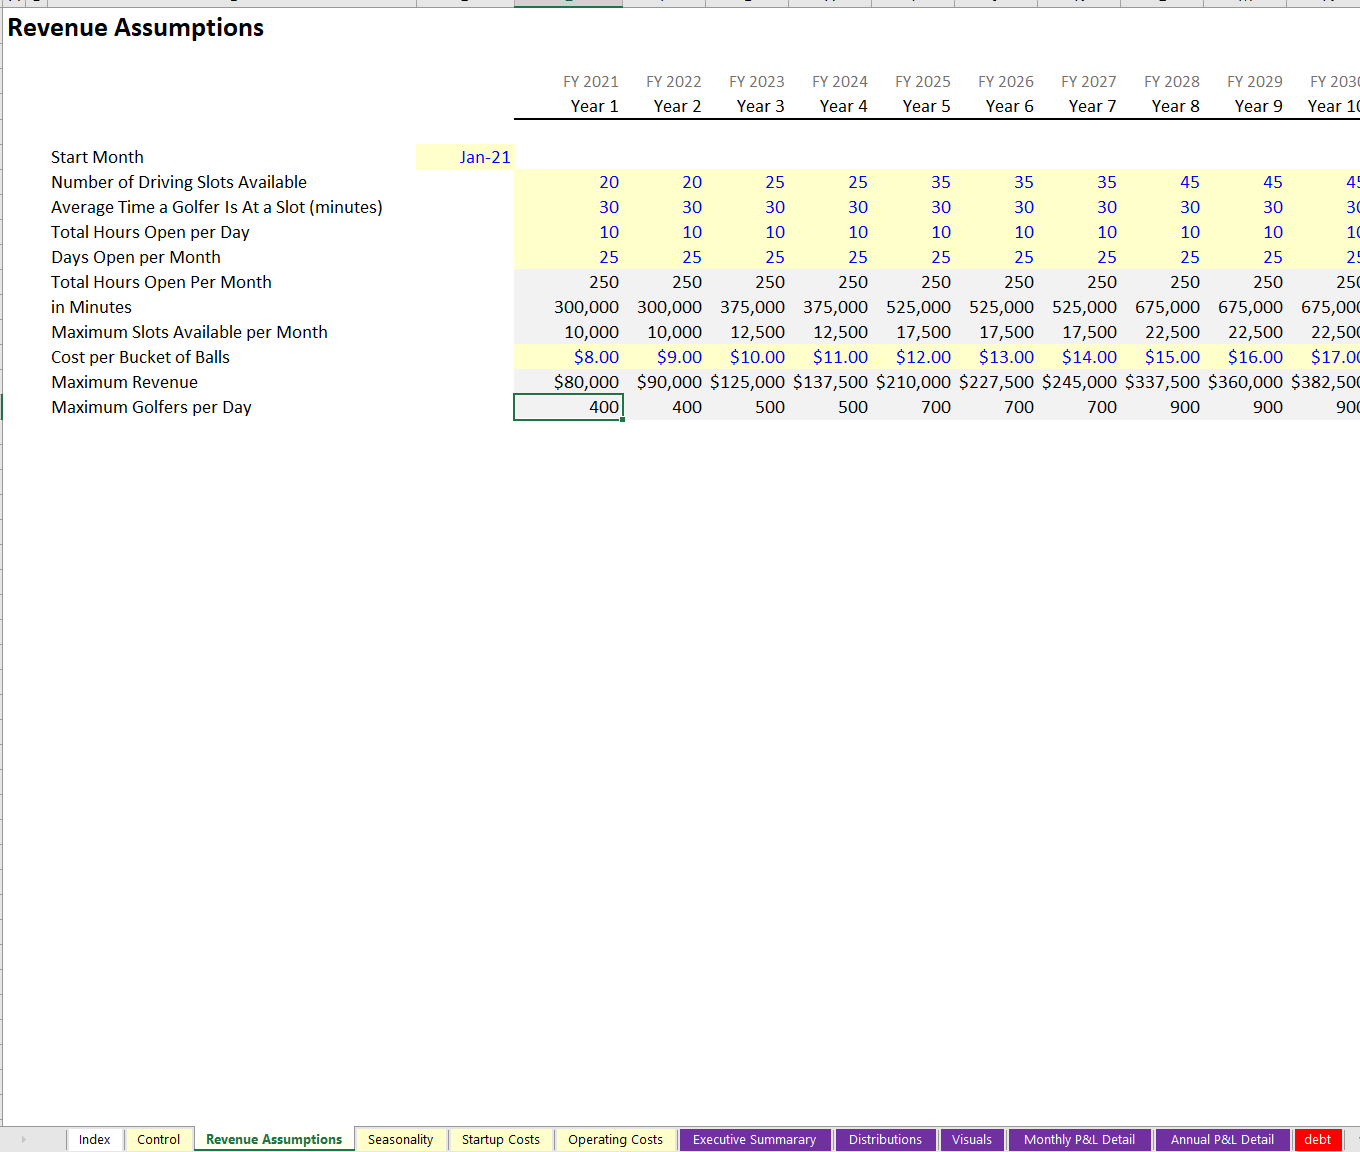
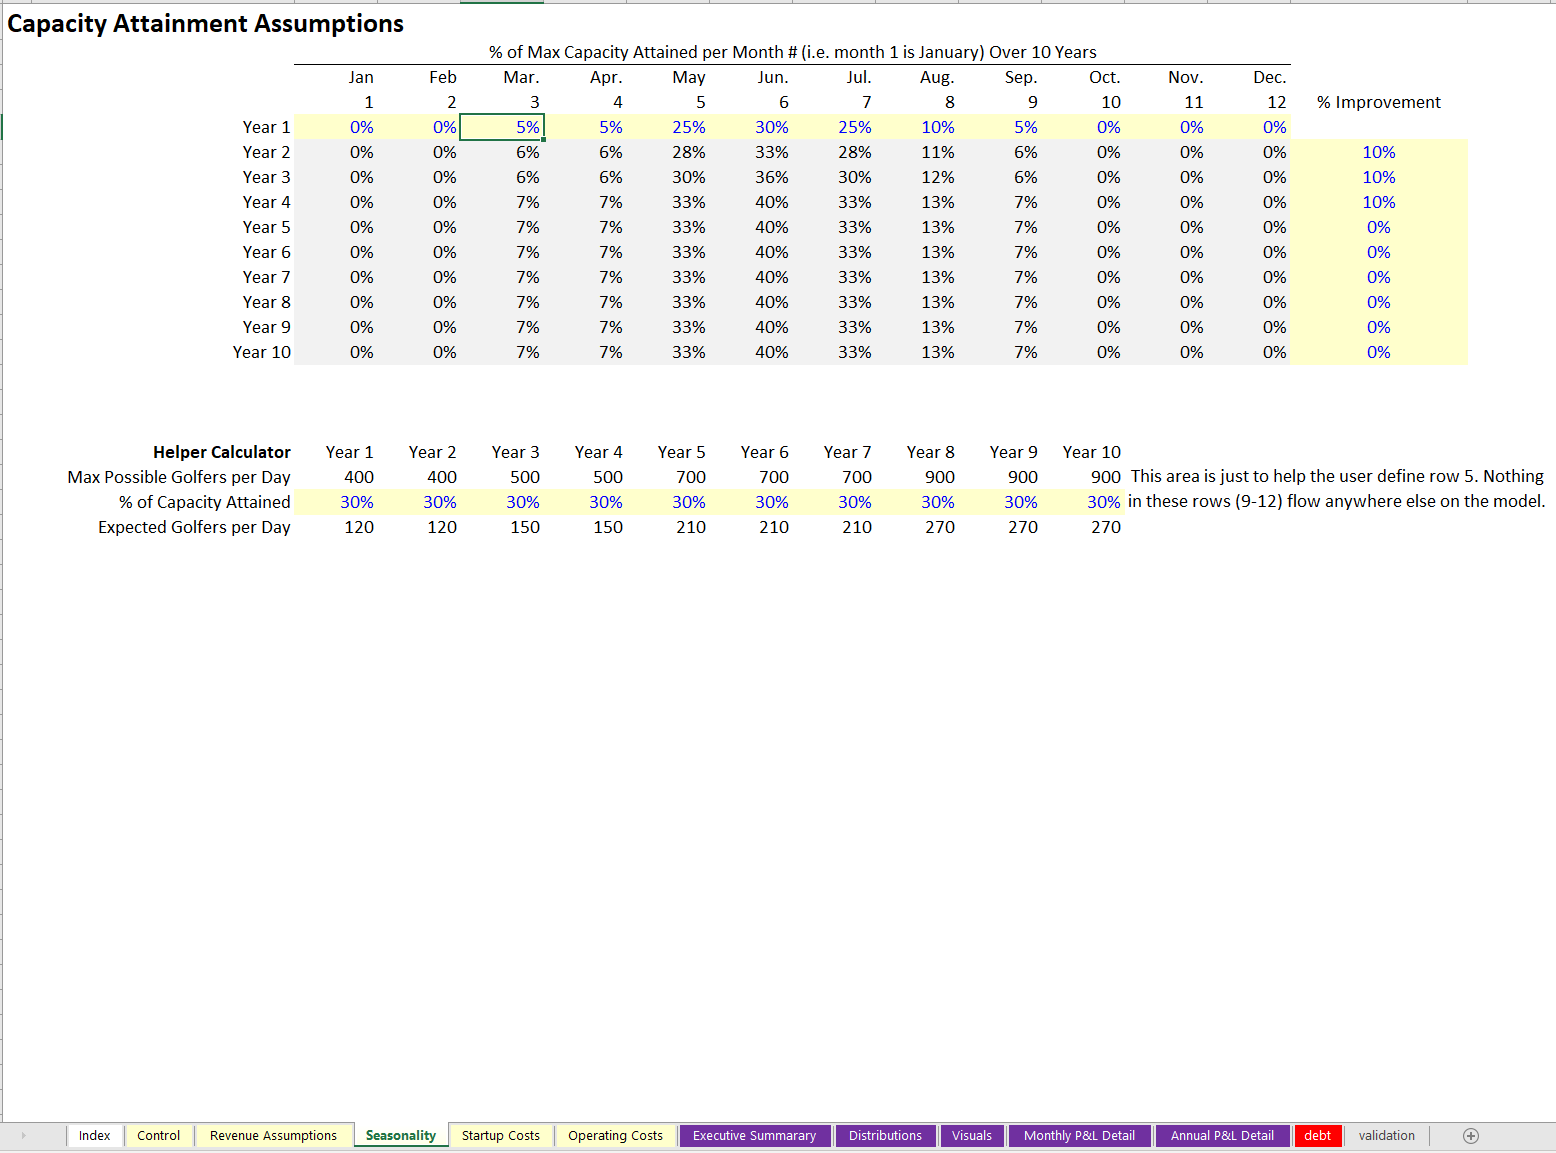
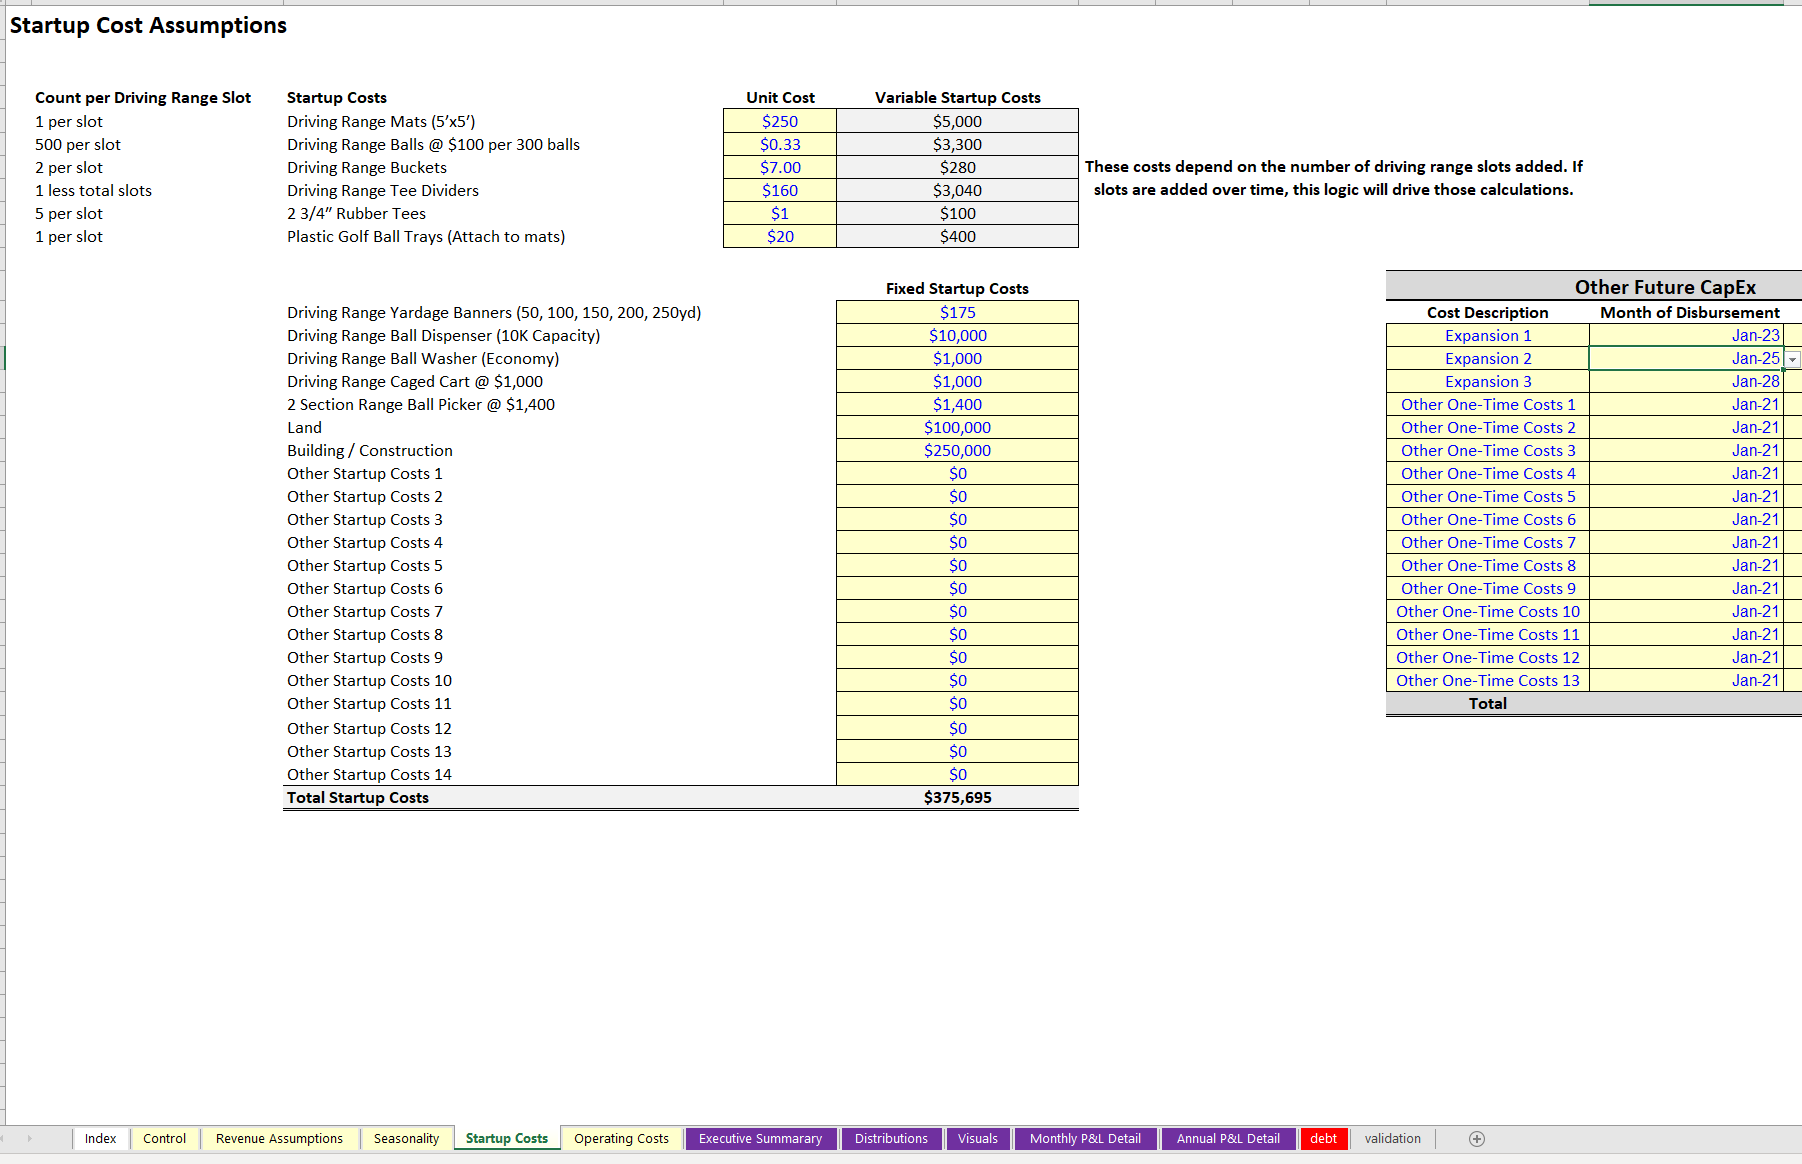
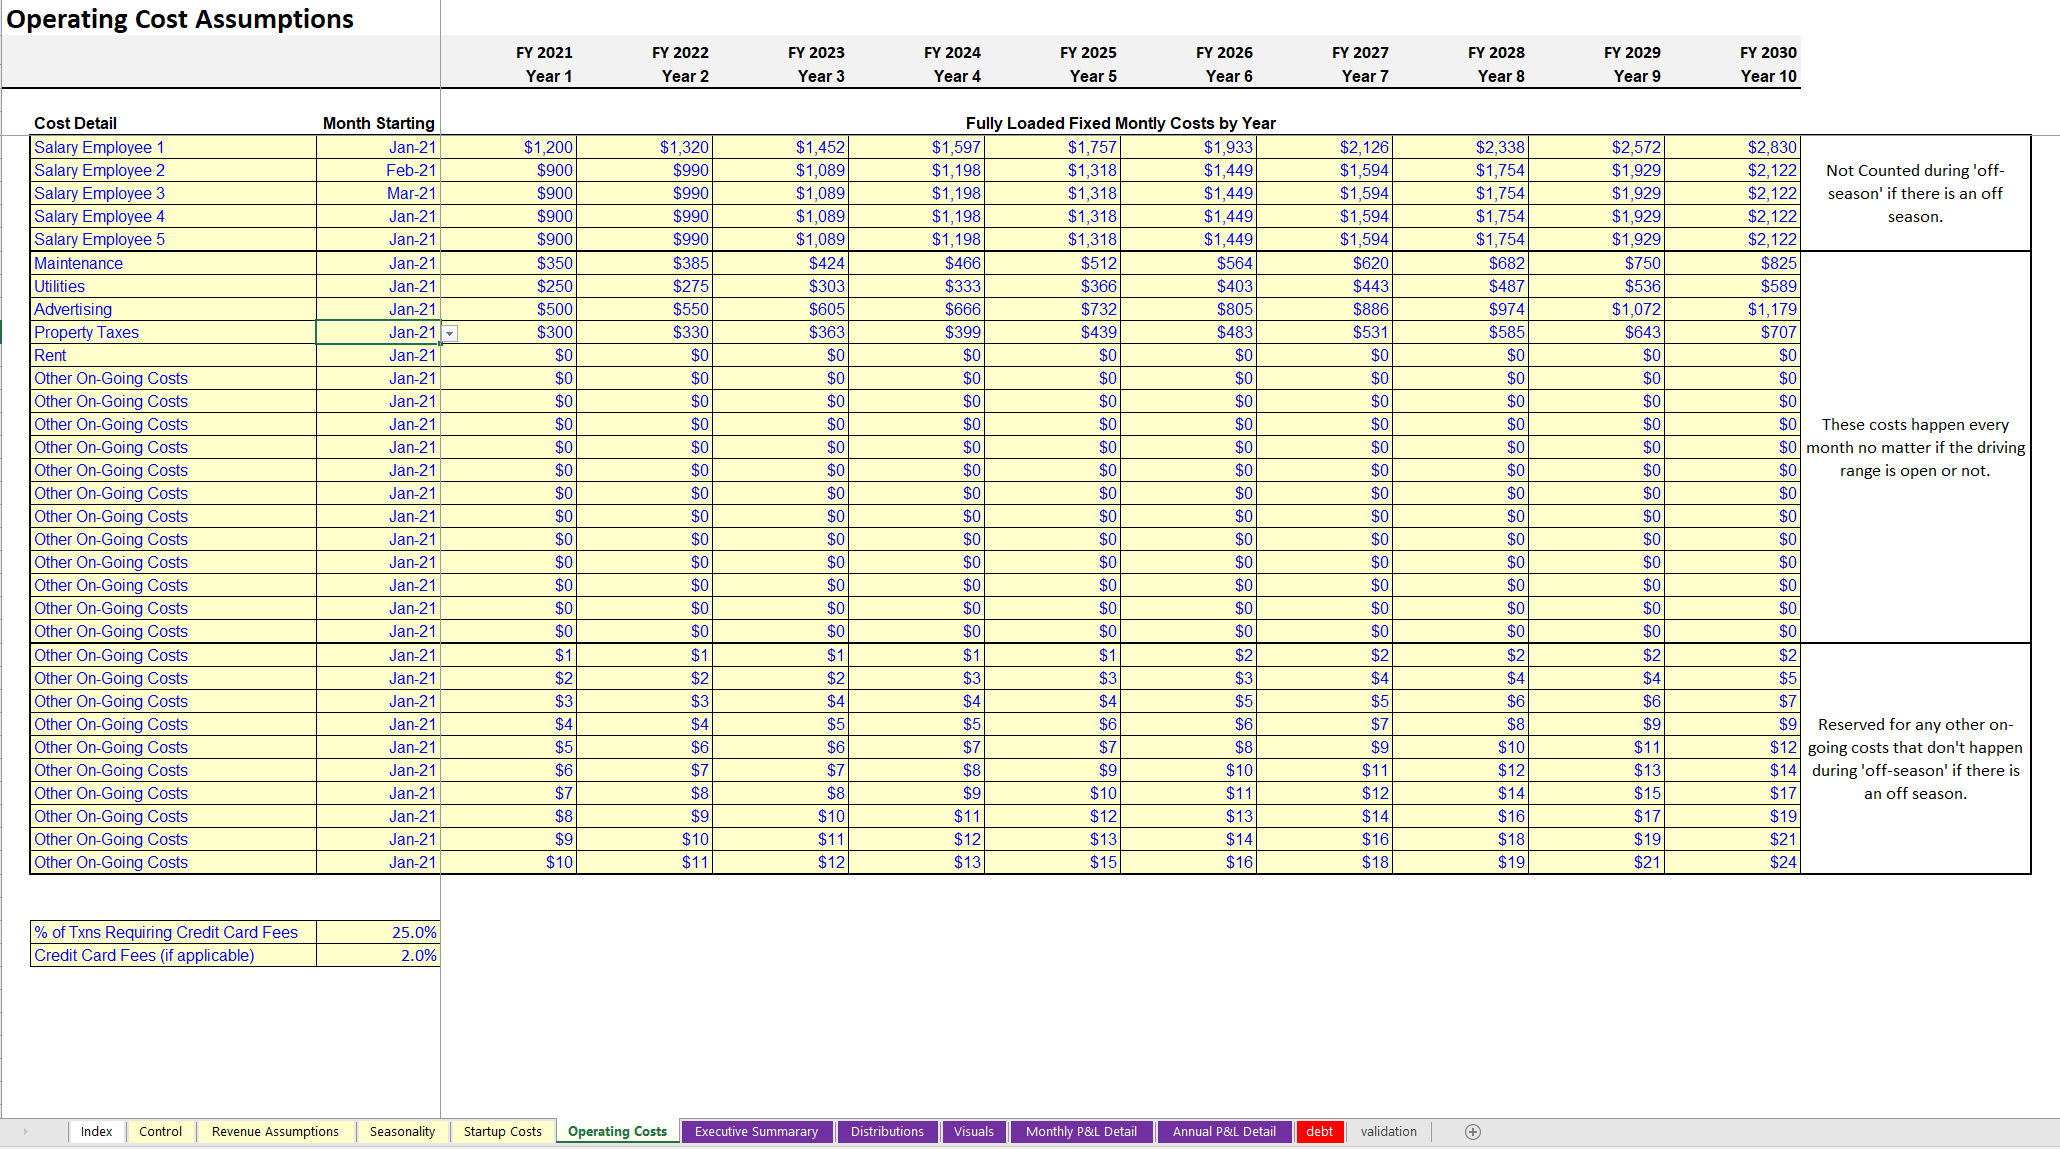
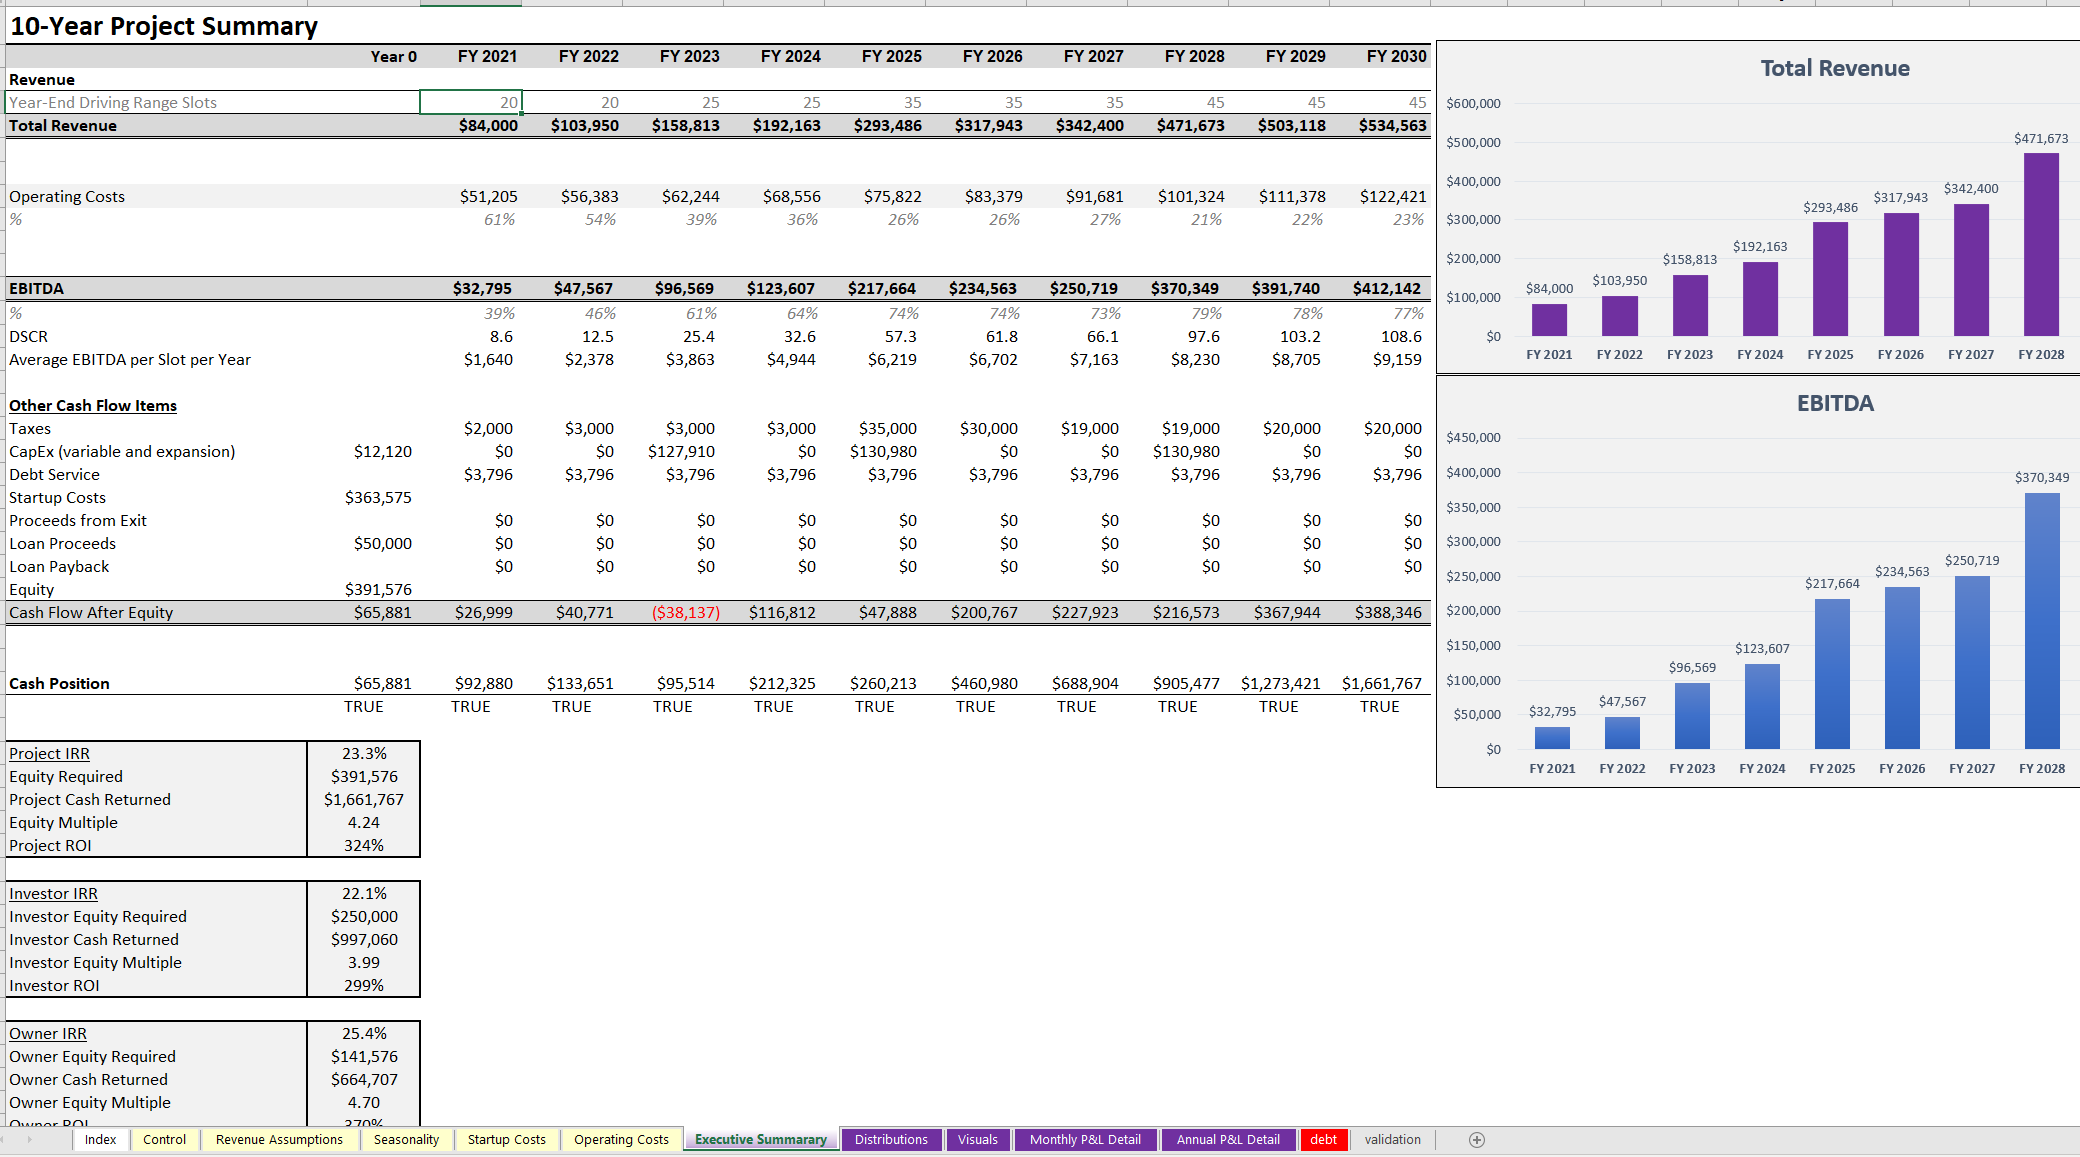
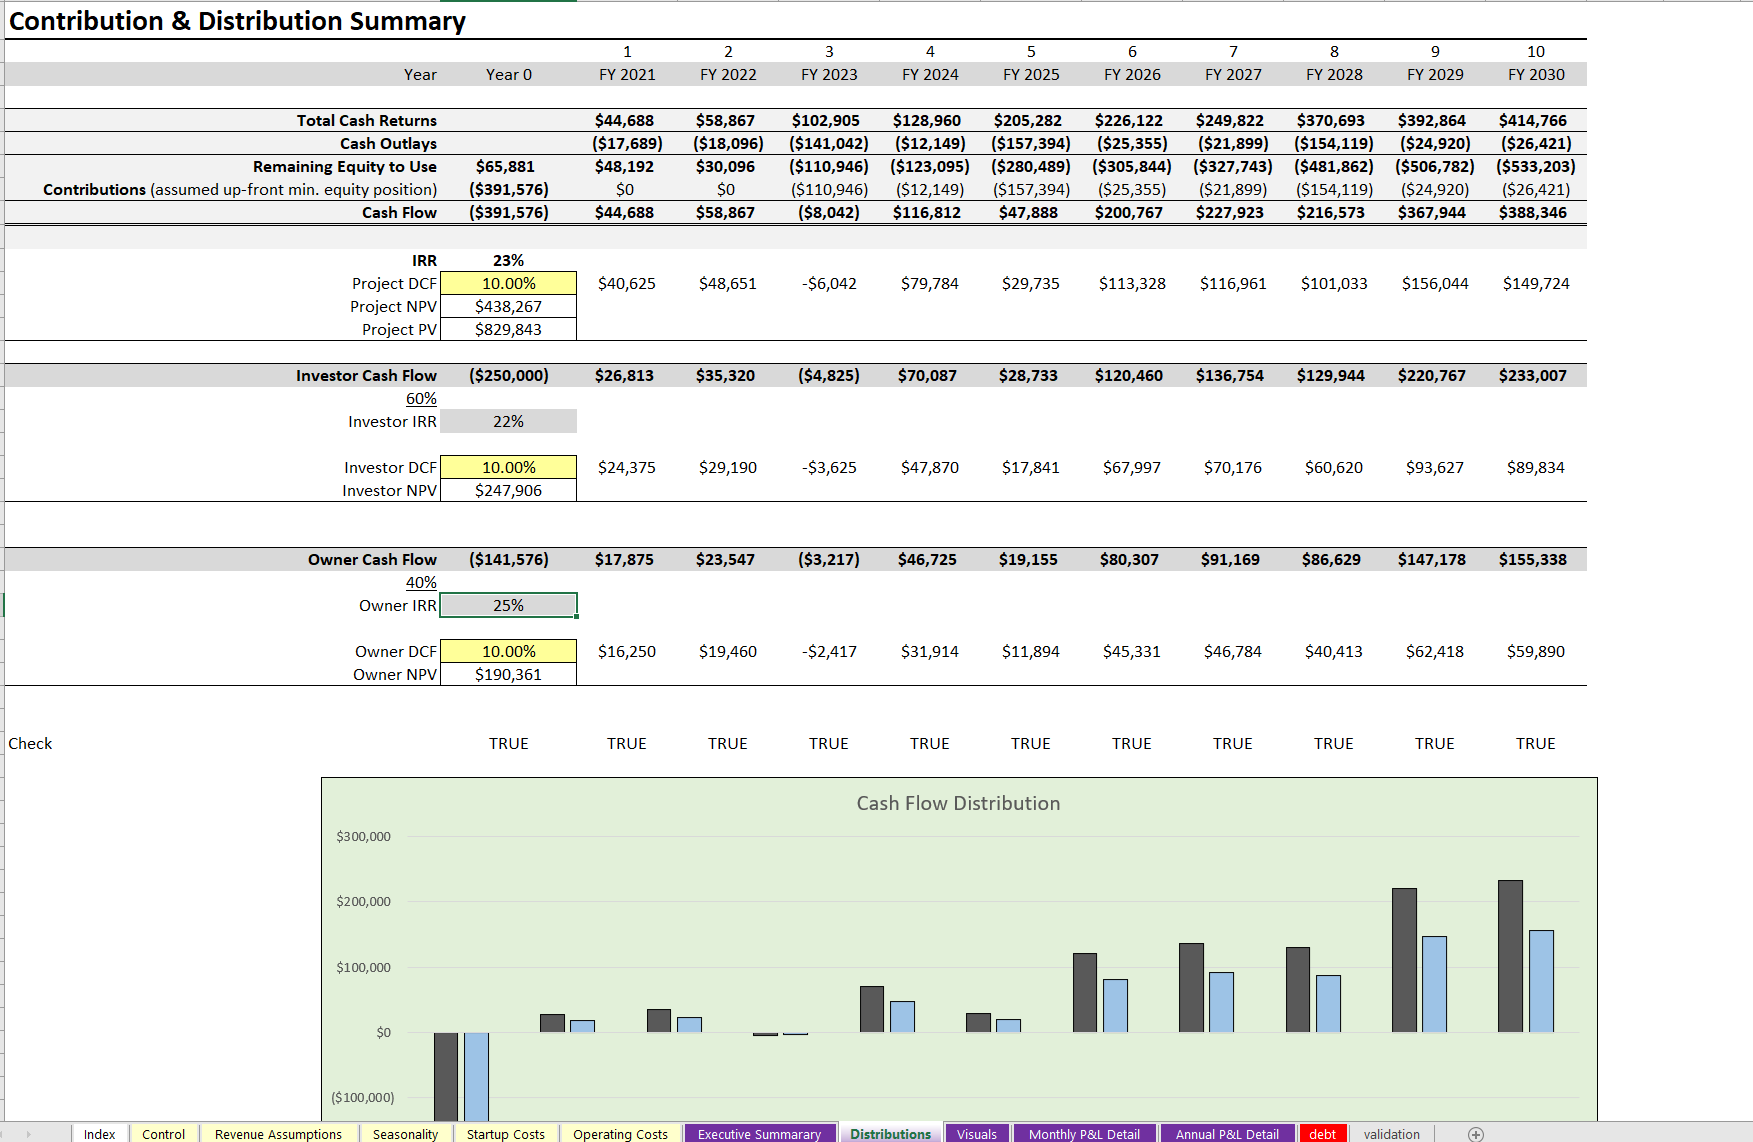
Driving Range - Capacity Driven Model
Capacity driven 10-year financial model specifically relating to building and operating a driving range.
Further information
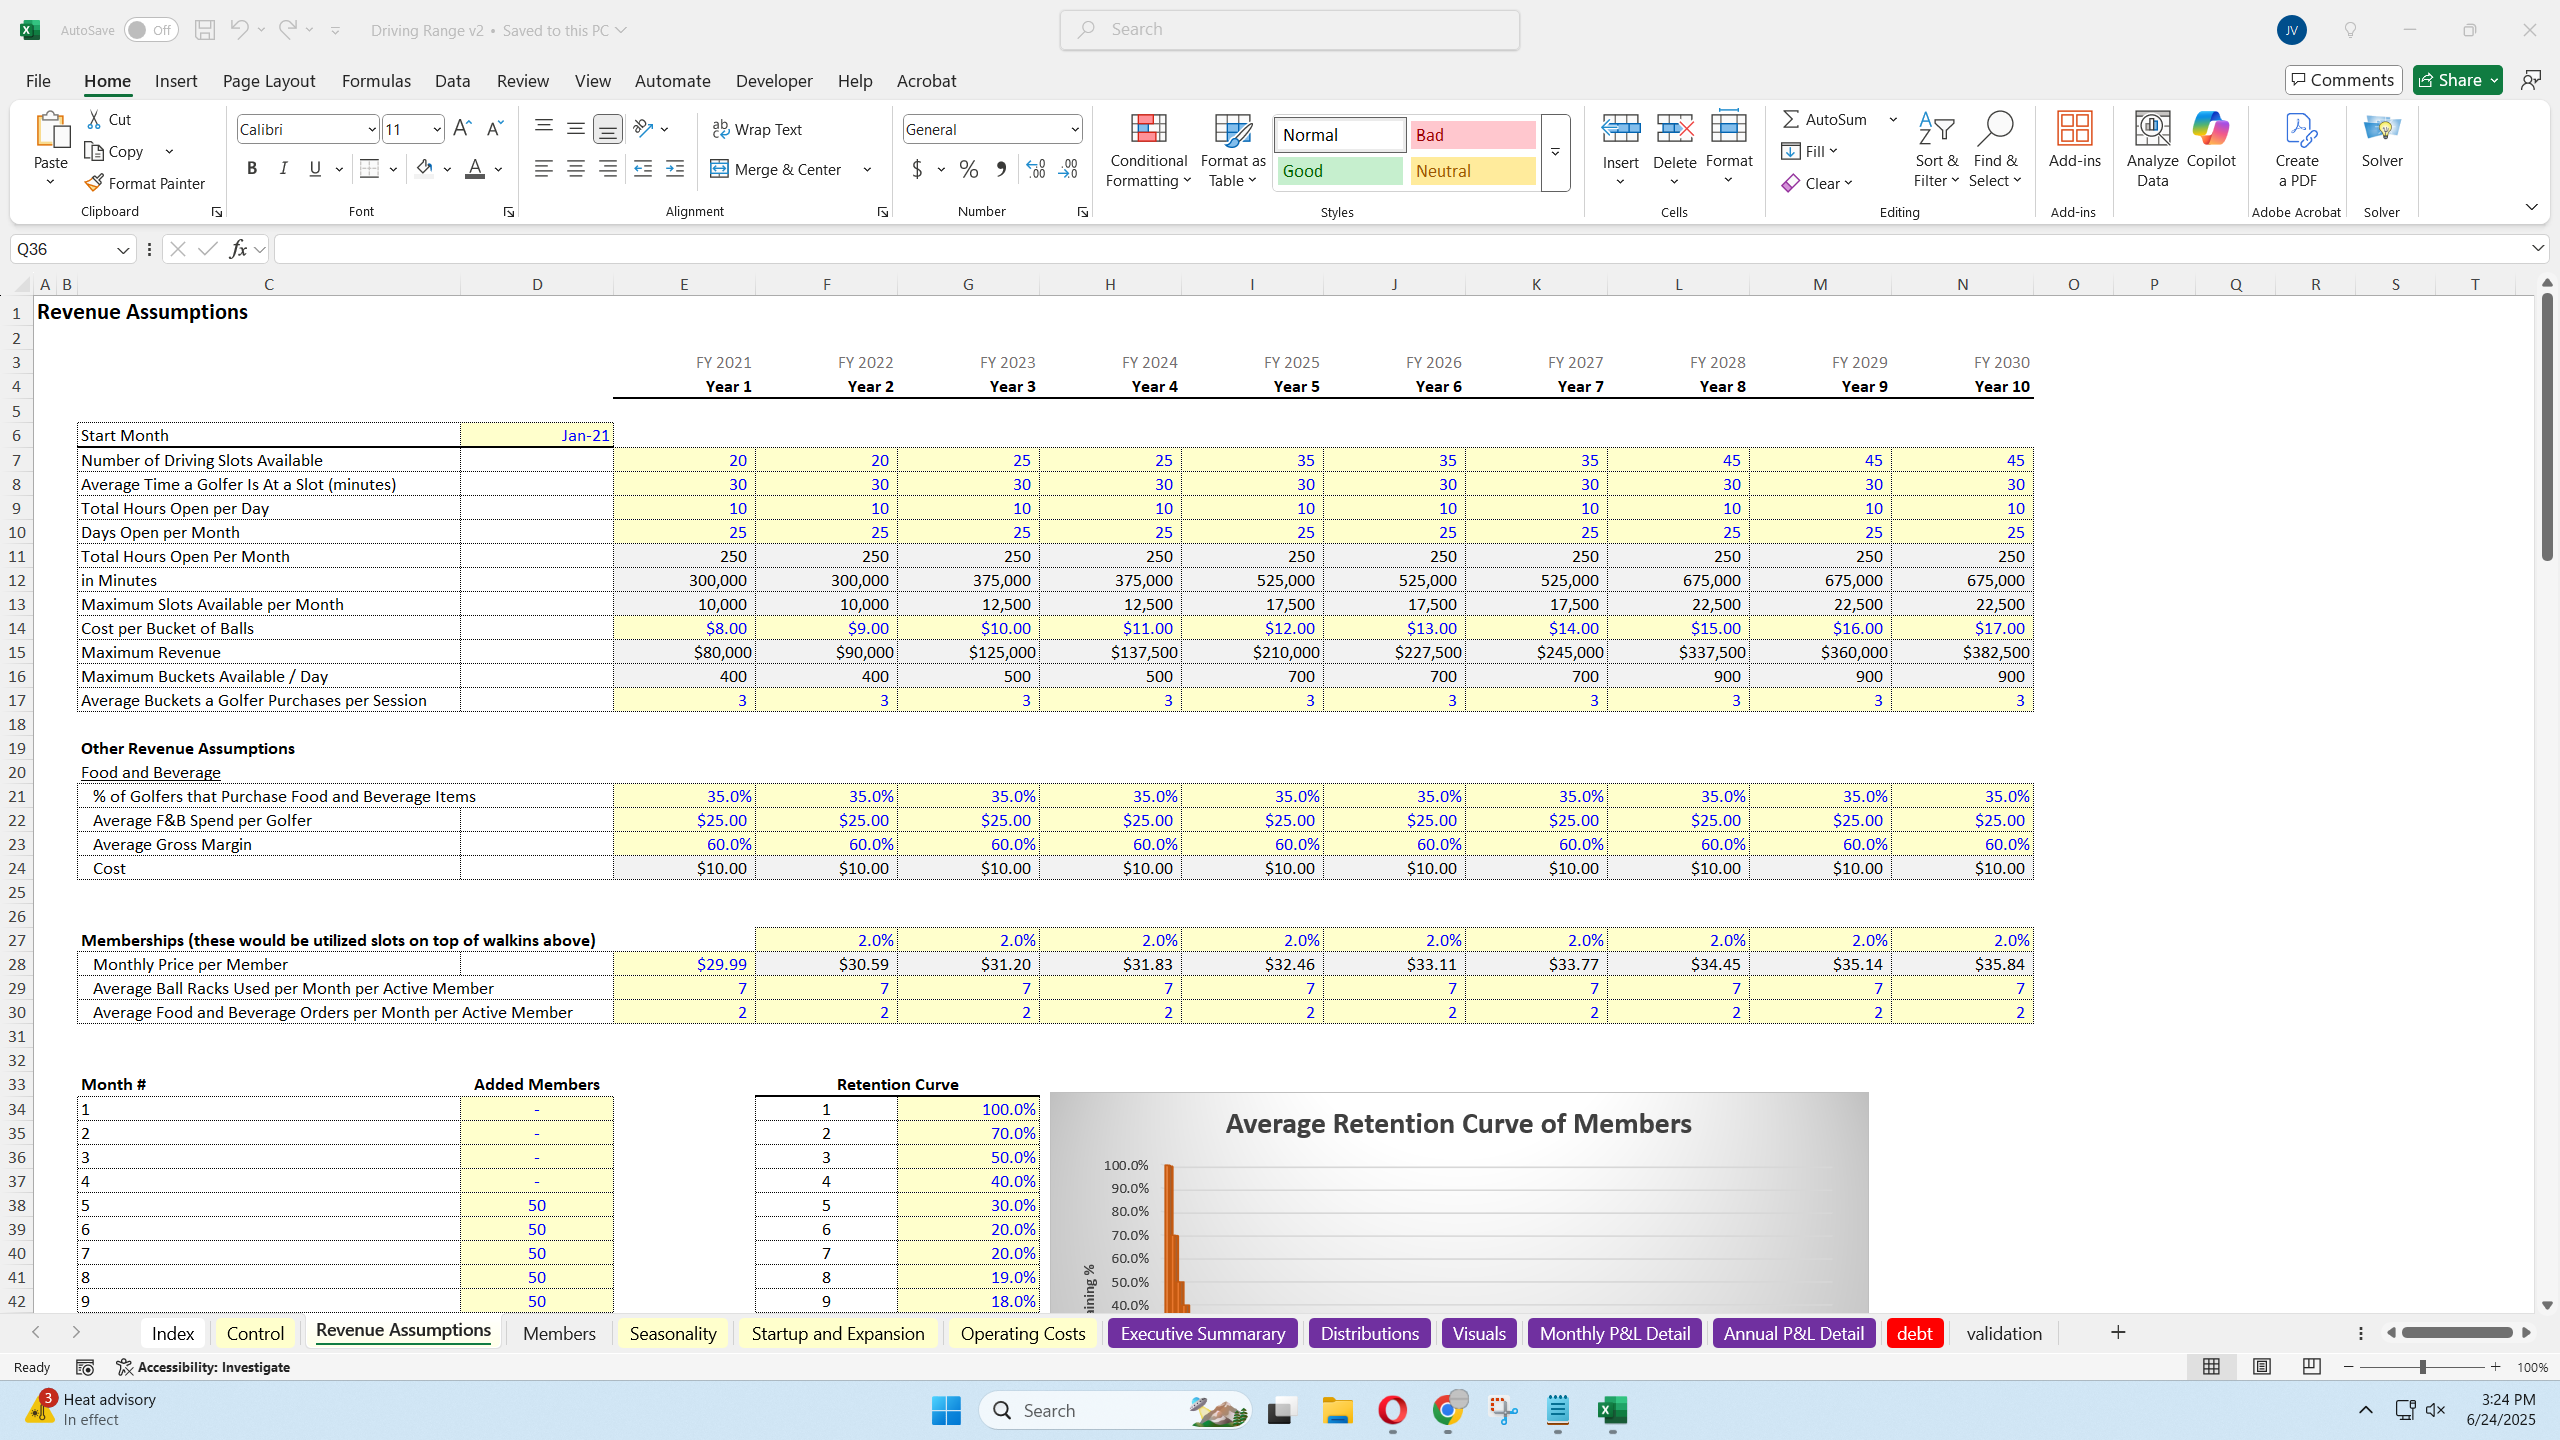
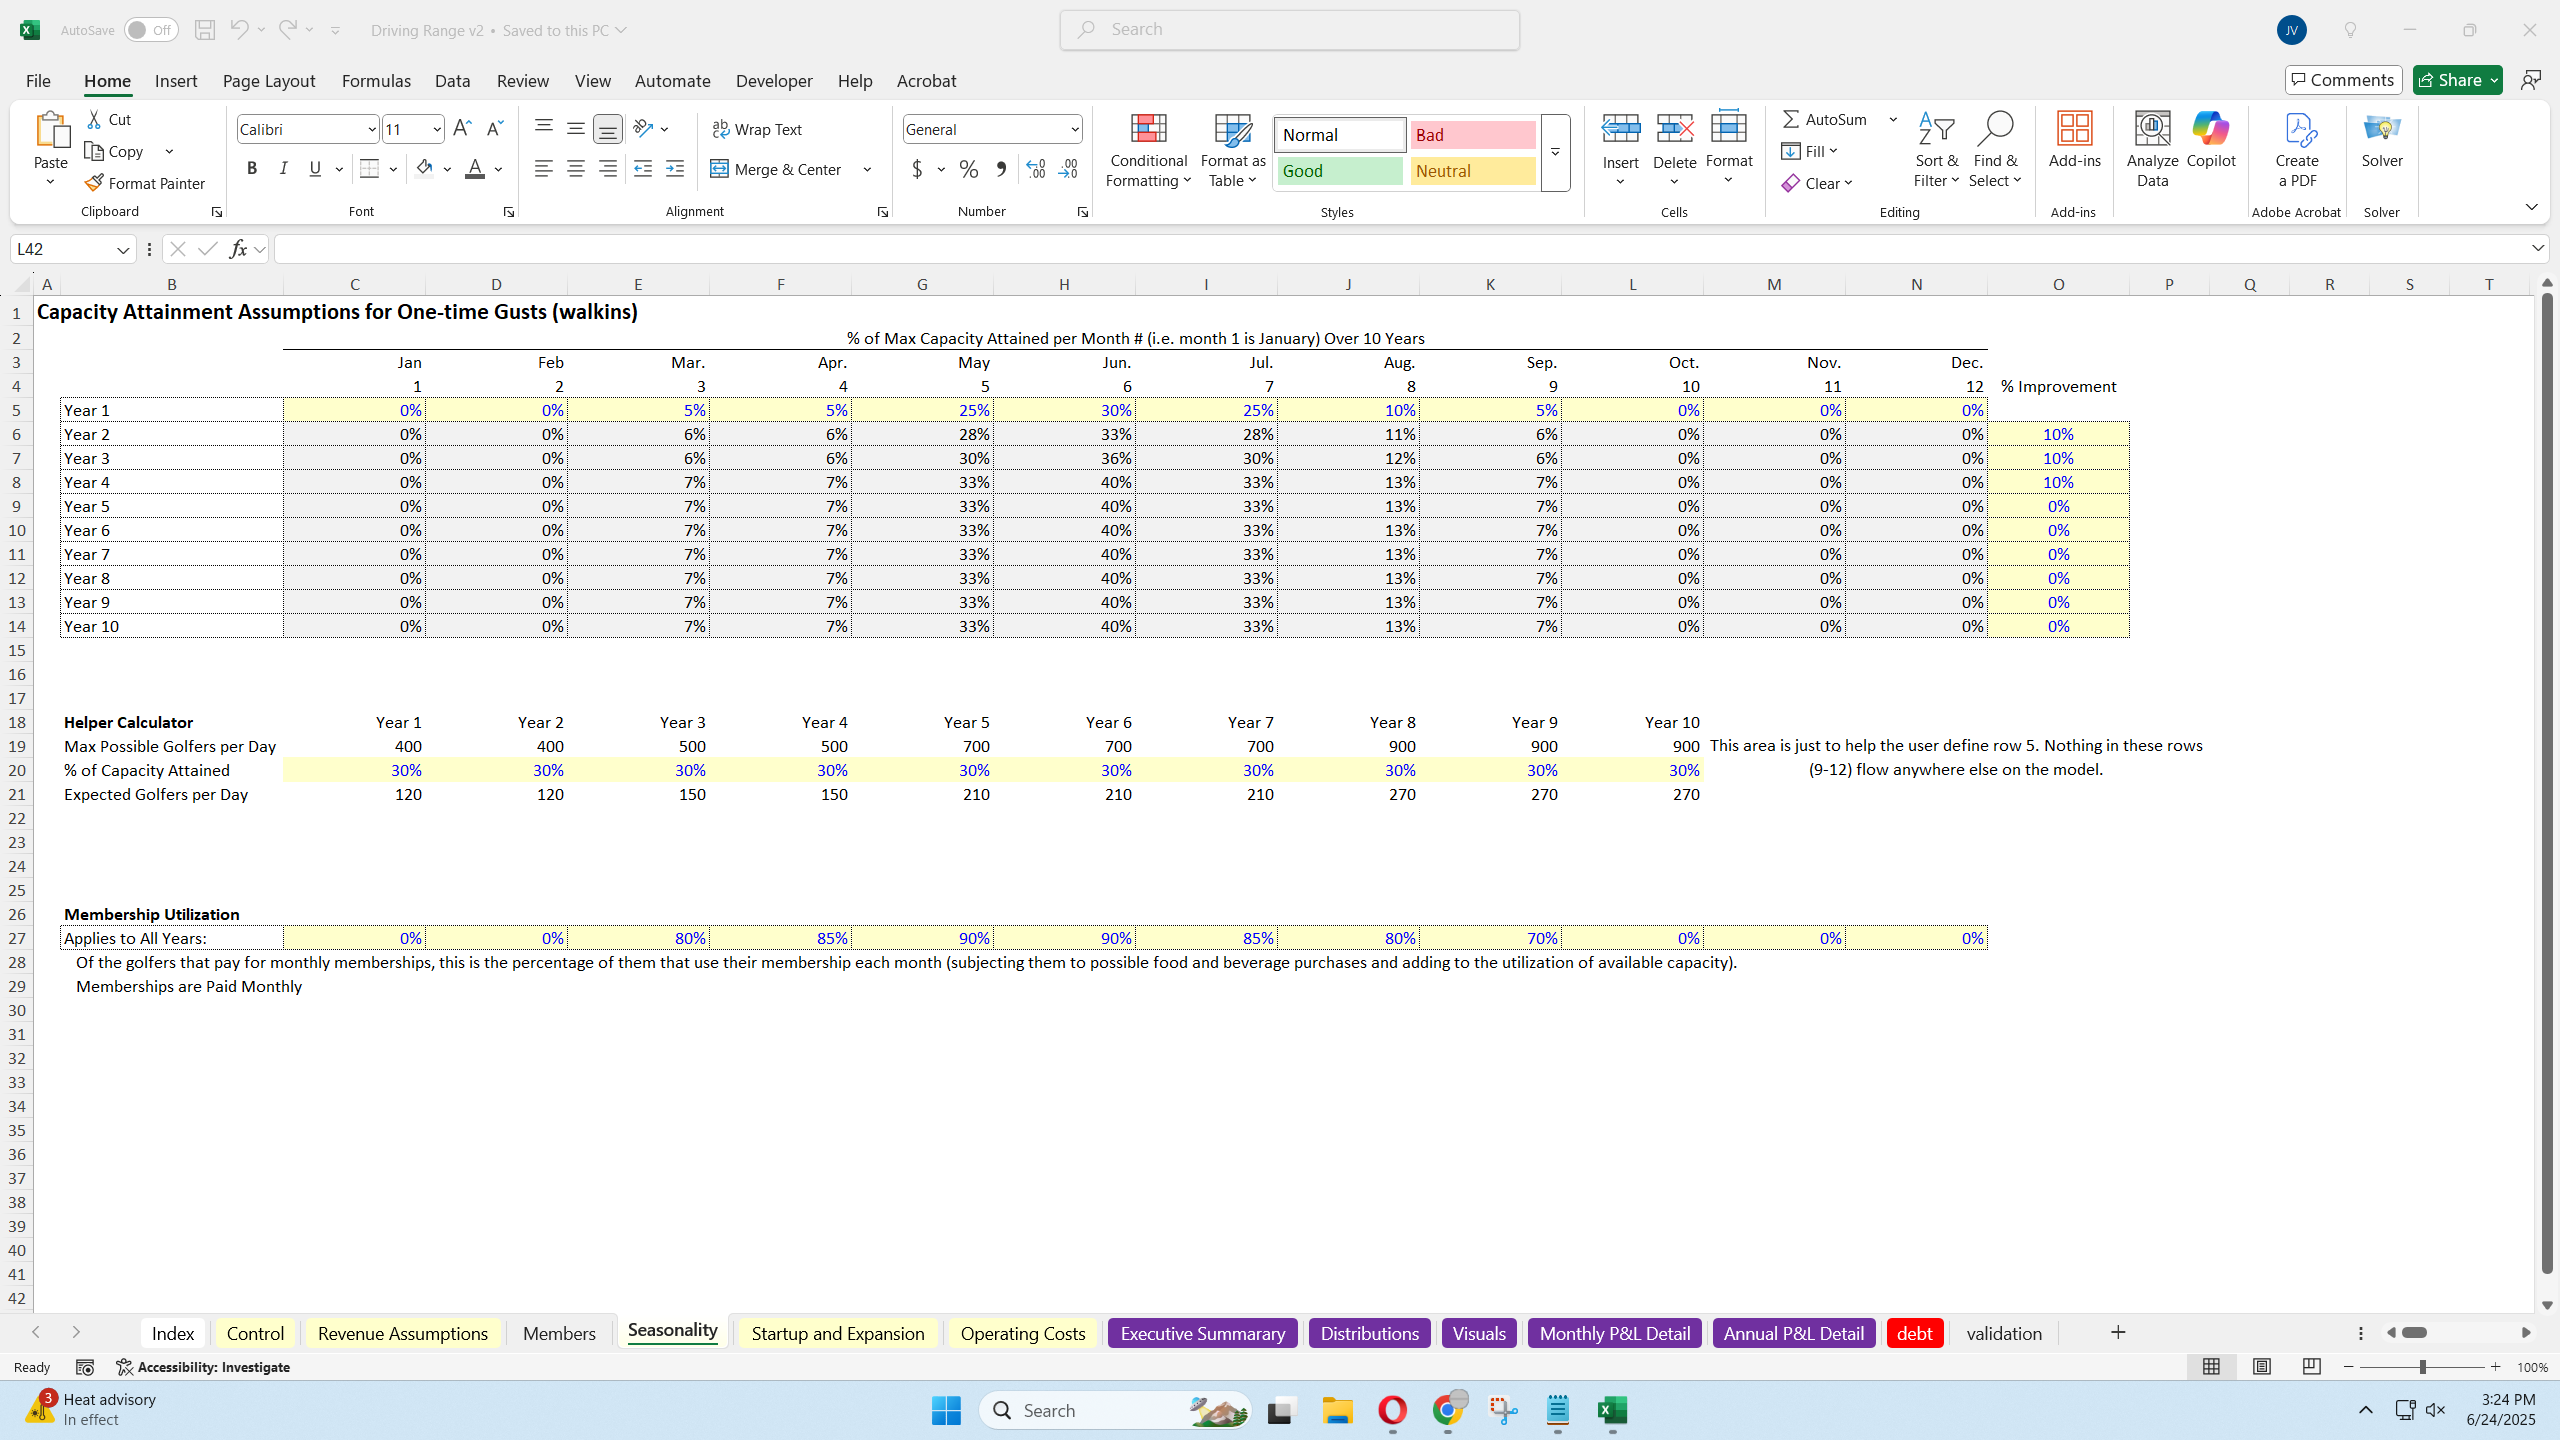
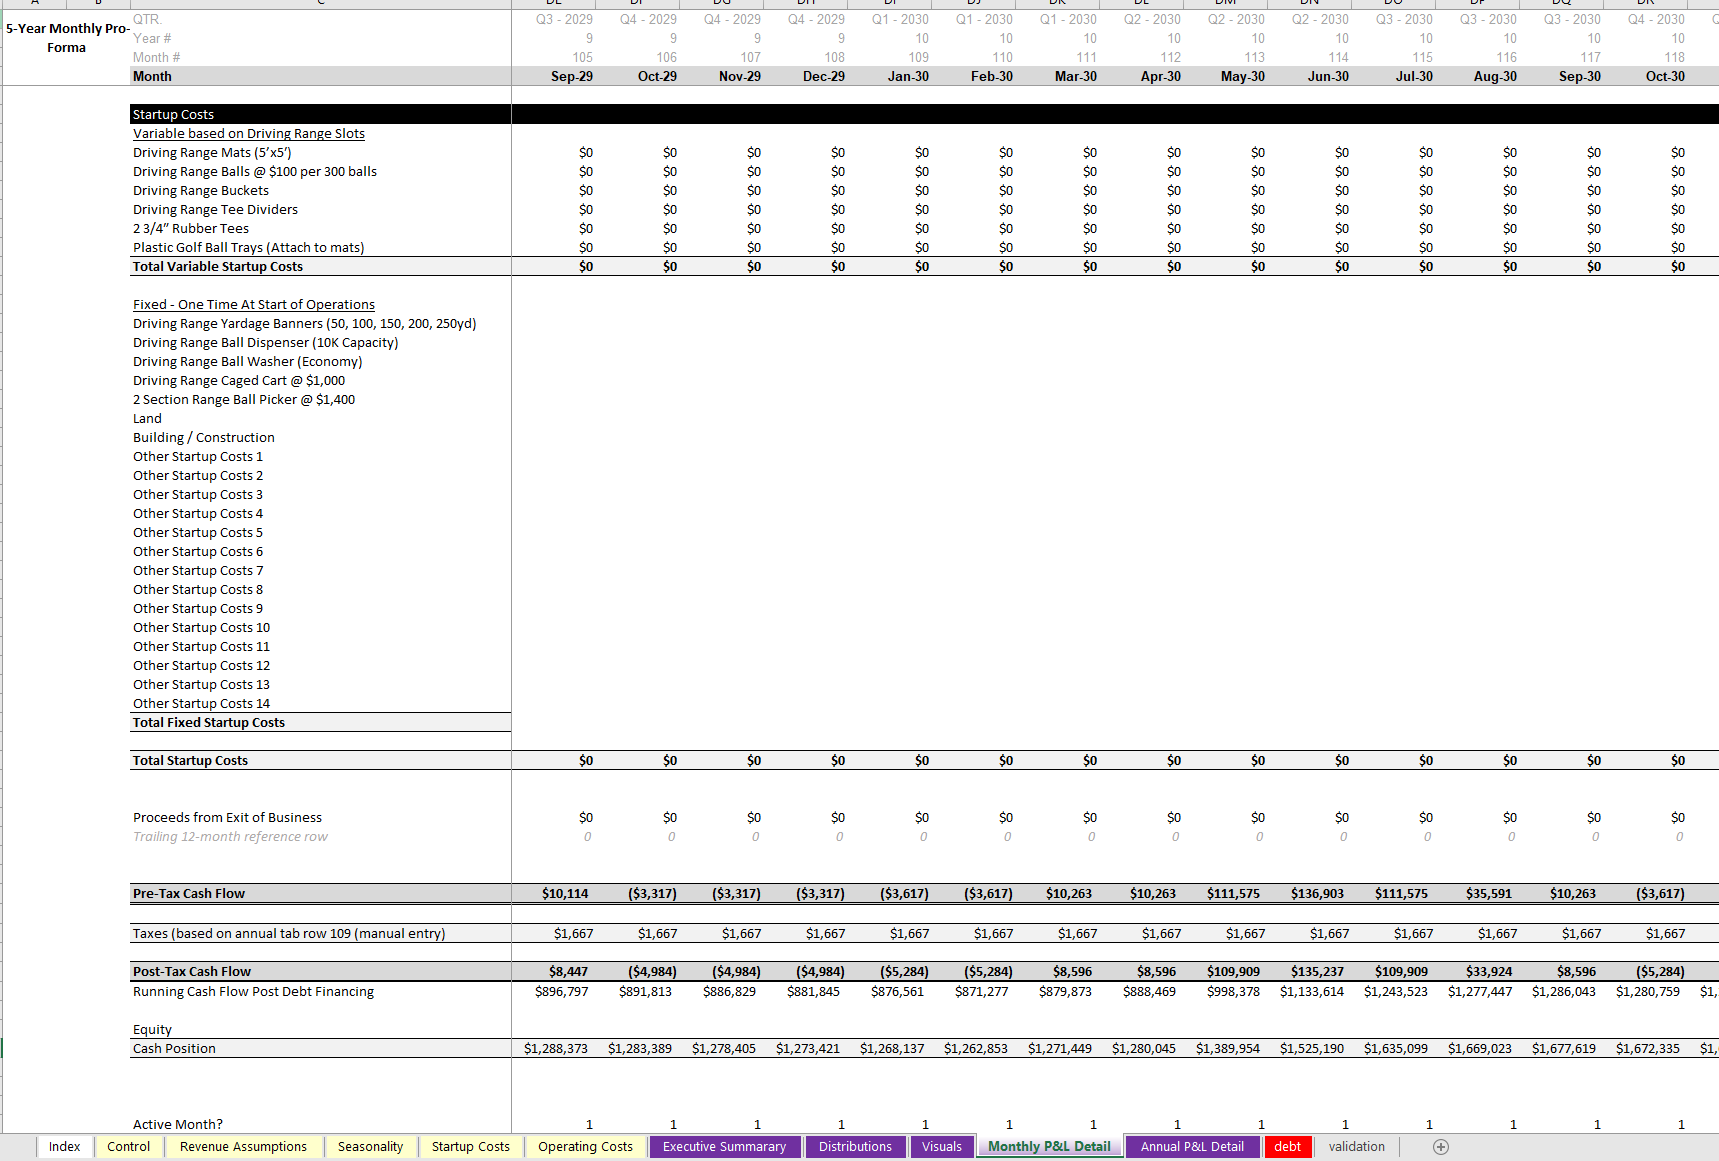
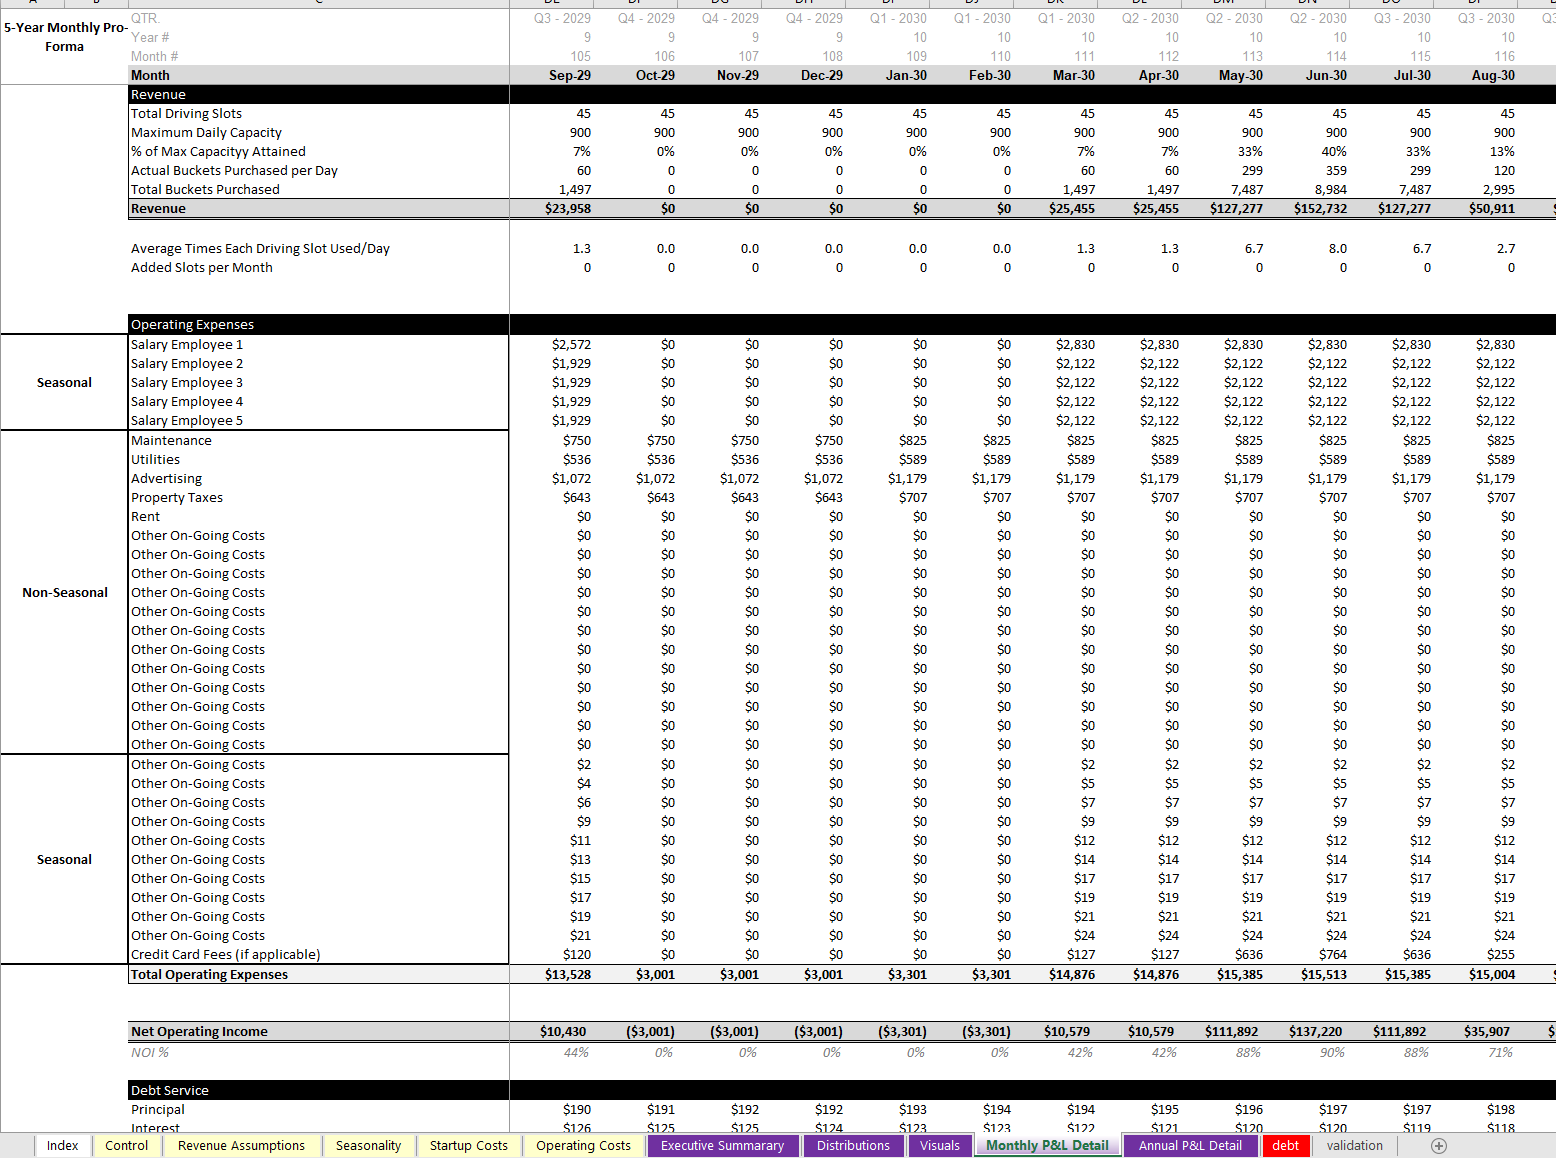
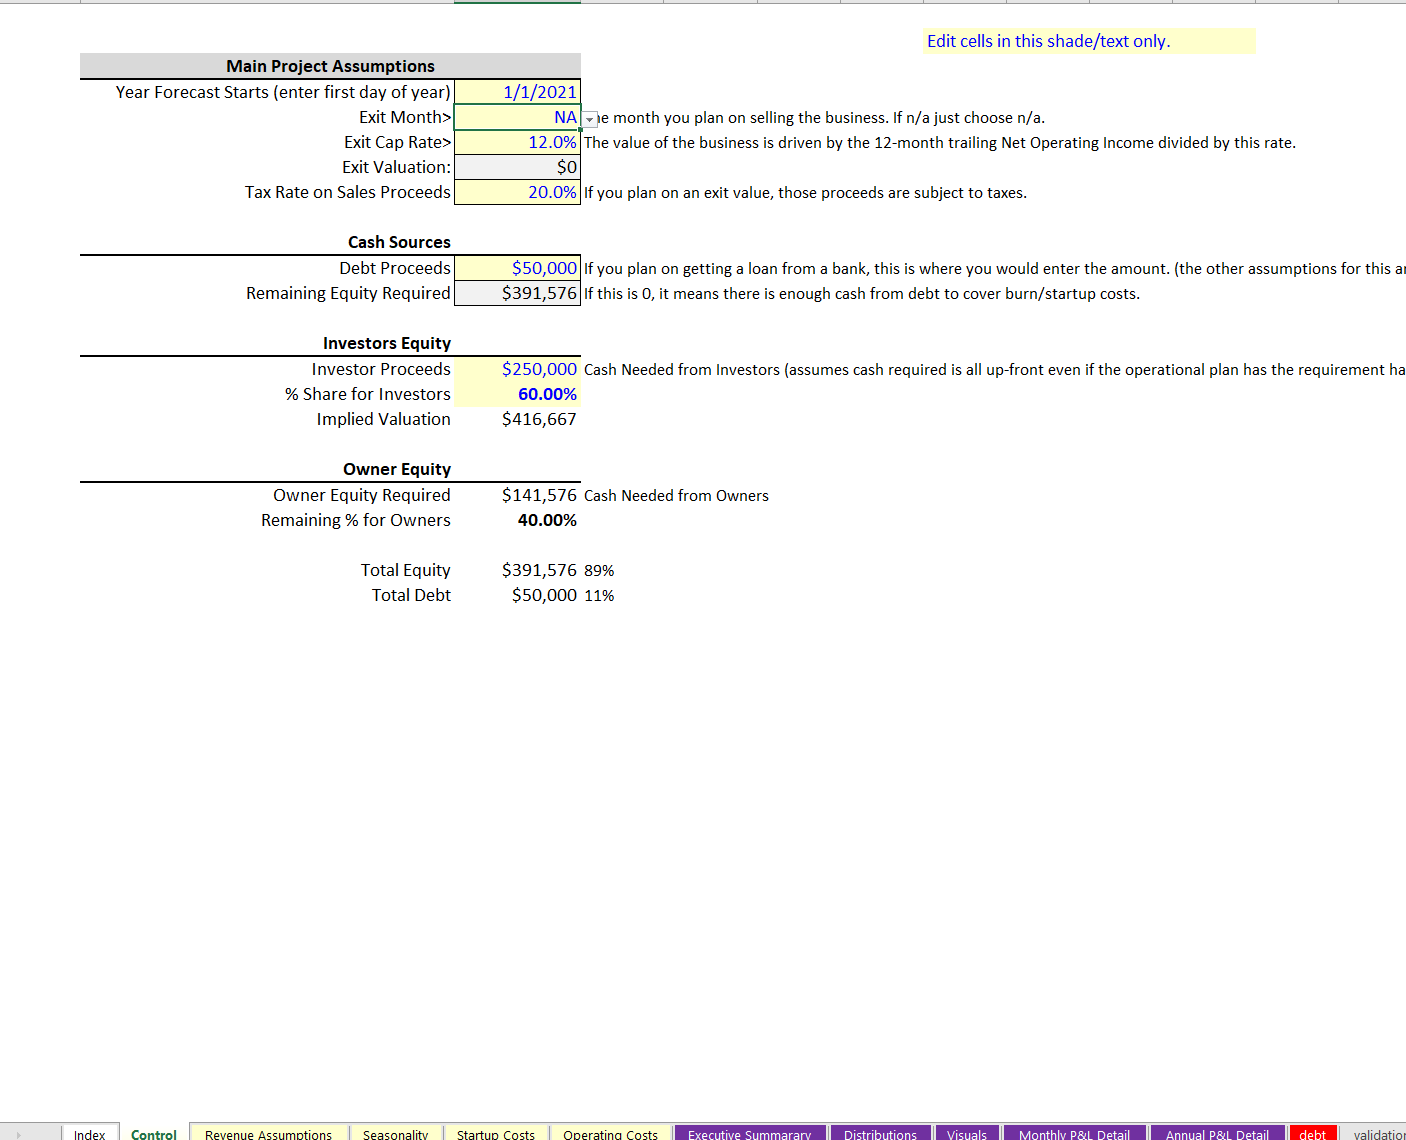
Forecast driving range revenues, expenses, EBITDA, and cash flow on a monthly and annual basis for up to 10 years.
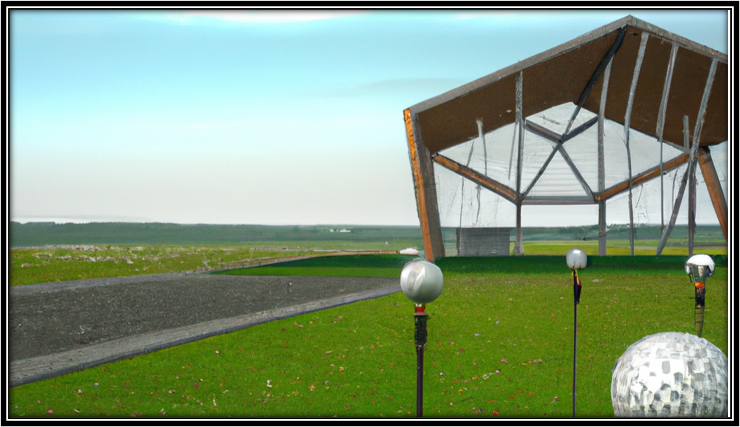
Driving range that charges per bucket of balls.
If you have a membership fee or other type of revenue generation strategy.
