Stock Analysis Excel Model (Ver. 3.0) - Safal Niveshak
A 16 tab Stock Analysis Excel Model Template to analyse the past performance of a company and determine its valuation.
Original Best Practice: Stock Analysis Excel Model by Vishal Khandelwal
Further information
Let me now explain briefly the sheets this excel file contains:
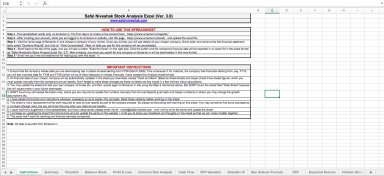
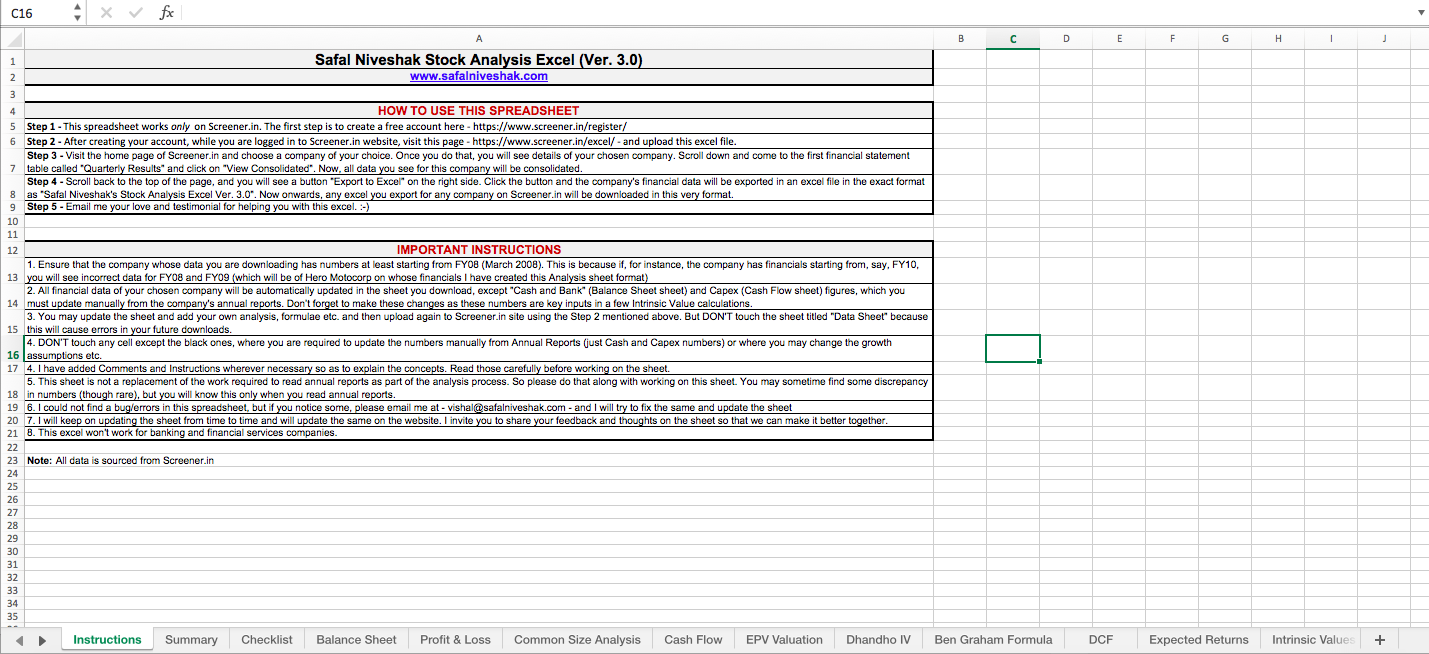
-> Instructions: After downloading the excel file on your computer, read this instructions sheet carefully before proceeding to use the rest of the excel.
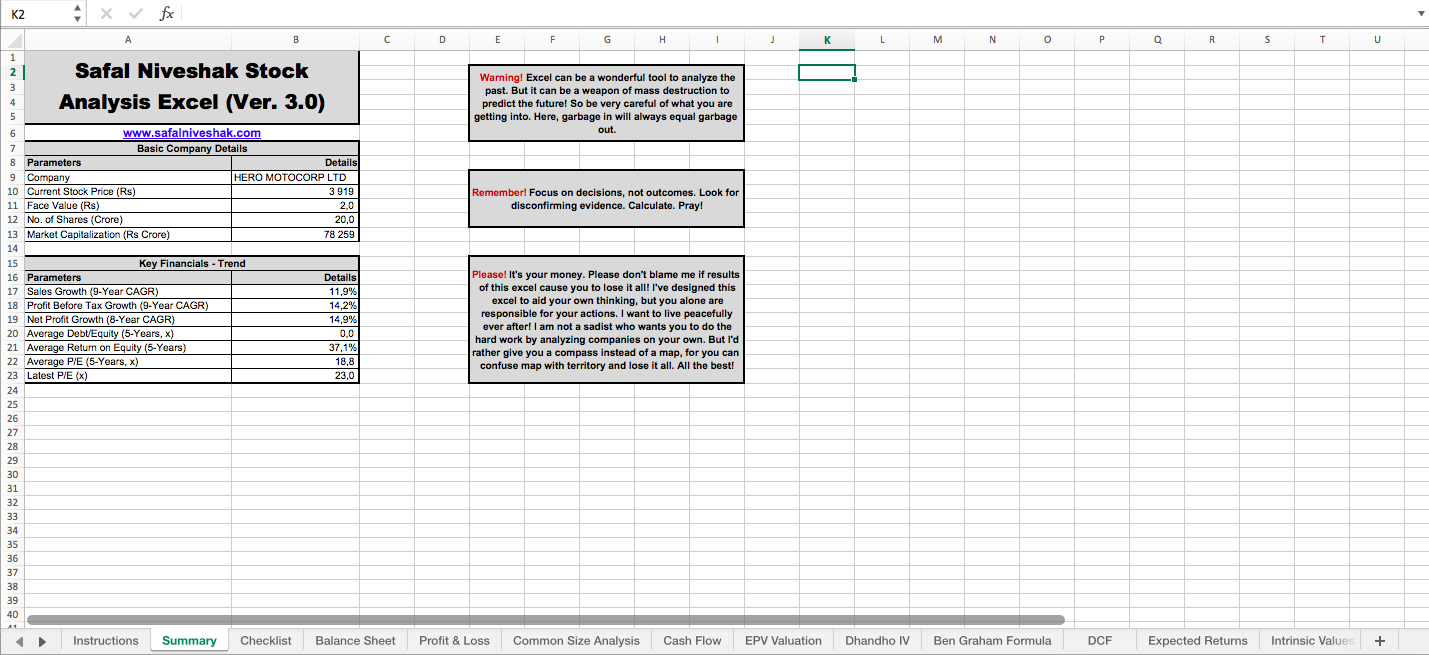
-> Summary: Contains some basic data of the company and a few warnings and disclaimers.
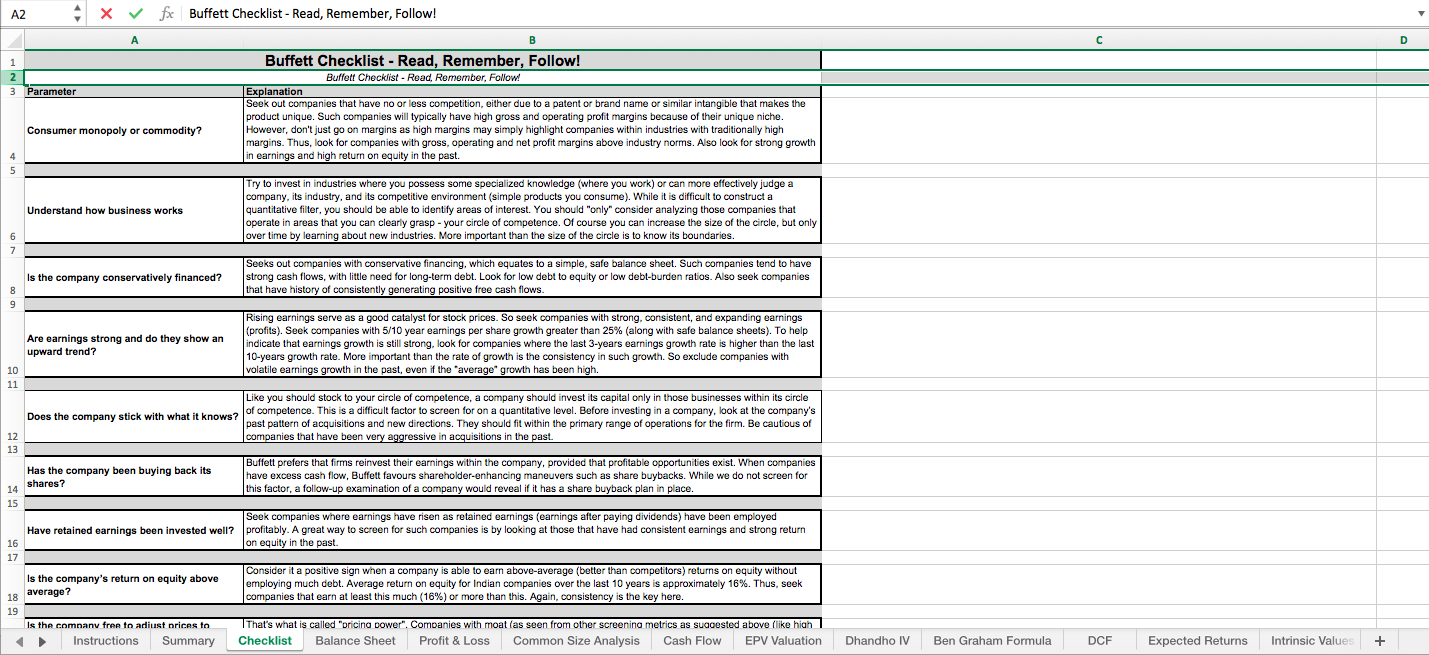
-> Checklist: Contains a simple Buffett checklist that will help you a lot in your overall decision-making.
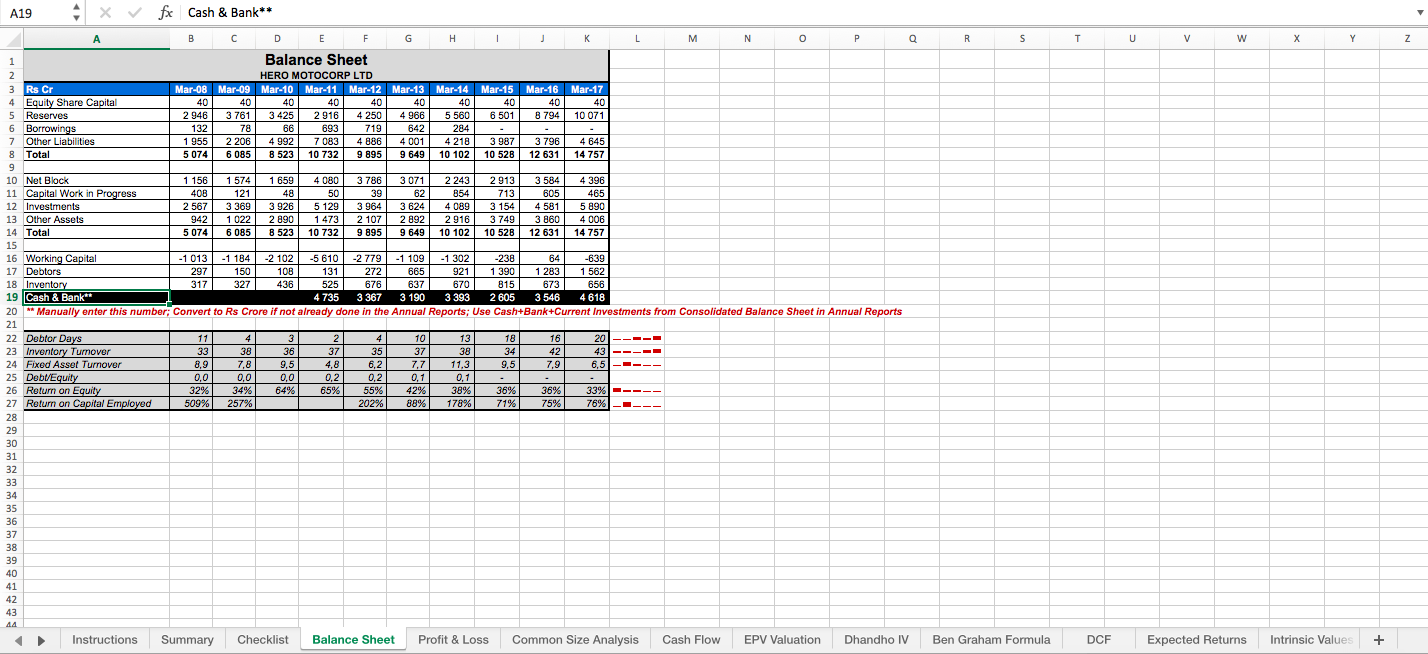
-> Balance Sheet: Contains key Balance Sheet numbers and a few related ratios. Updated automatically. You just have to manually enter the “Cash & Bank” number (in Rs Crore) from the annual reports.
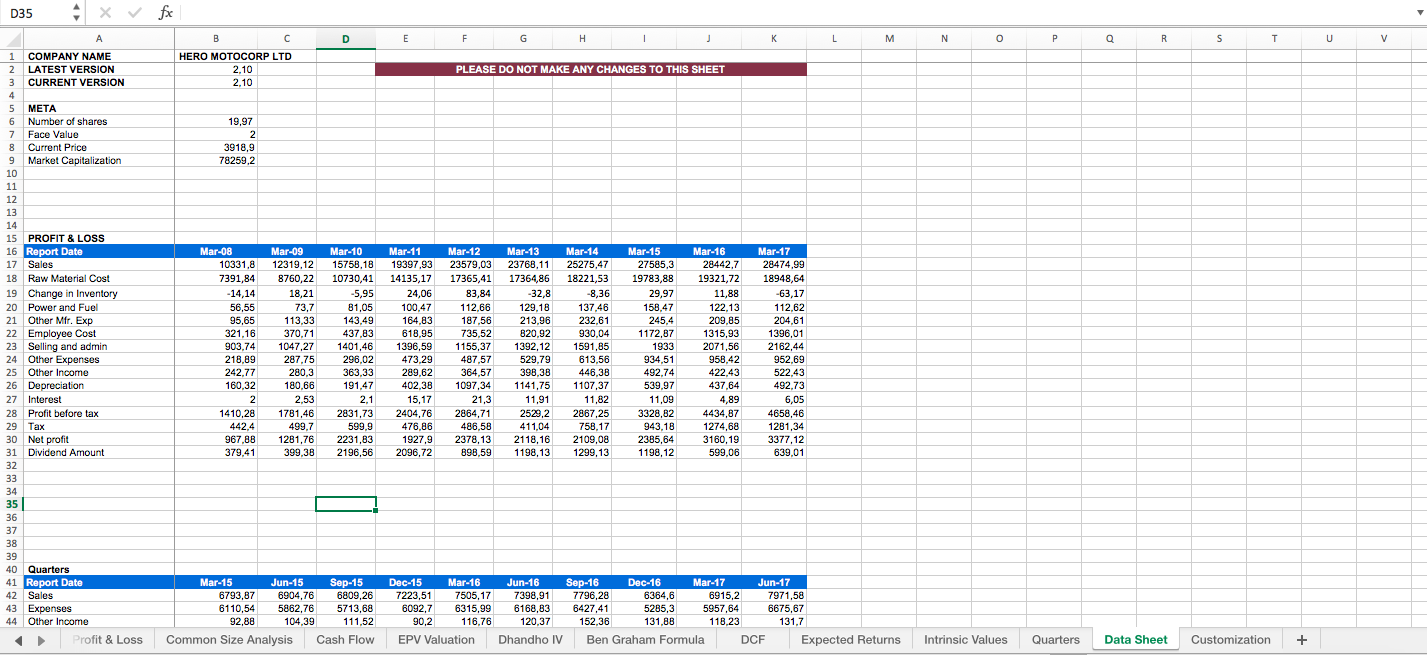
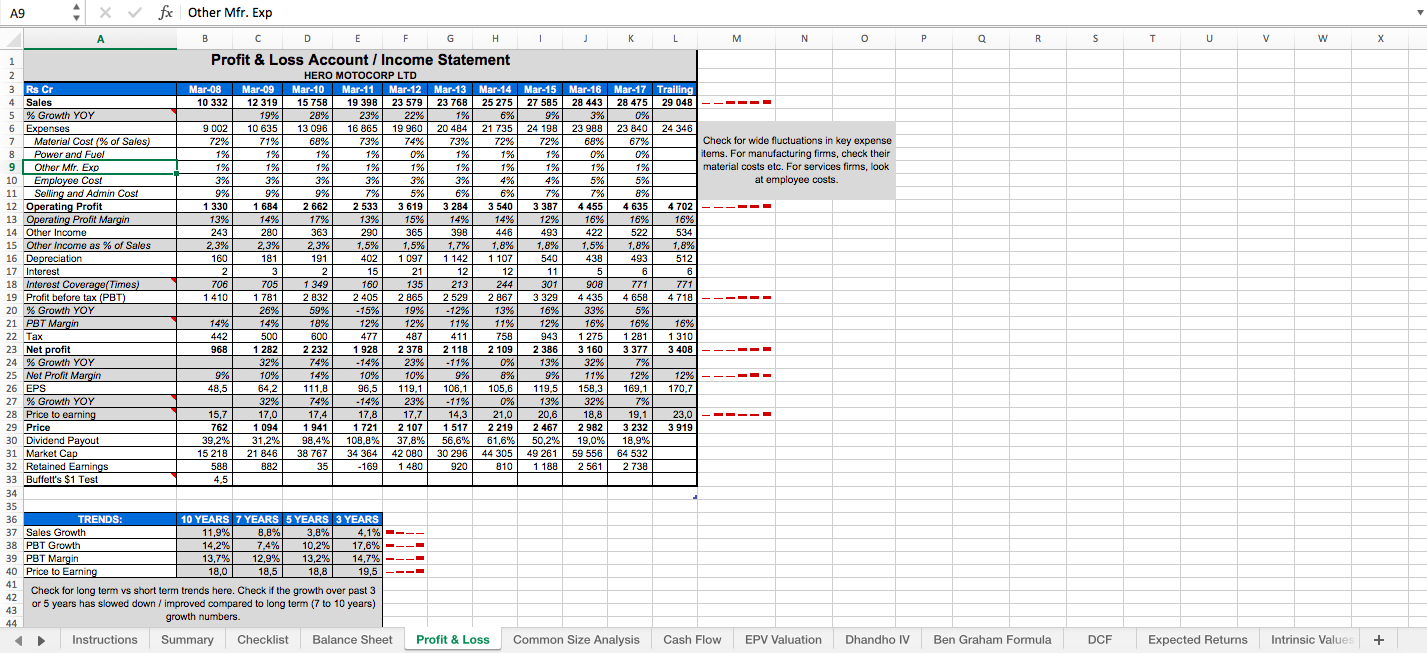
-> Profit & Loss: Contains key Profit & Loss Statement numbers. Updated automatically.
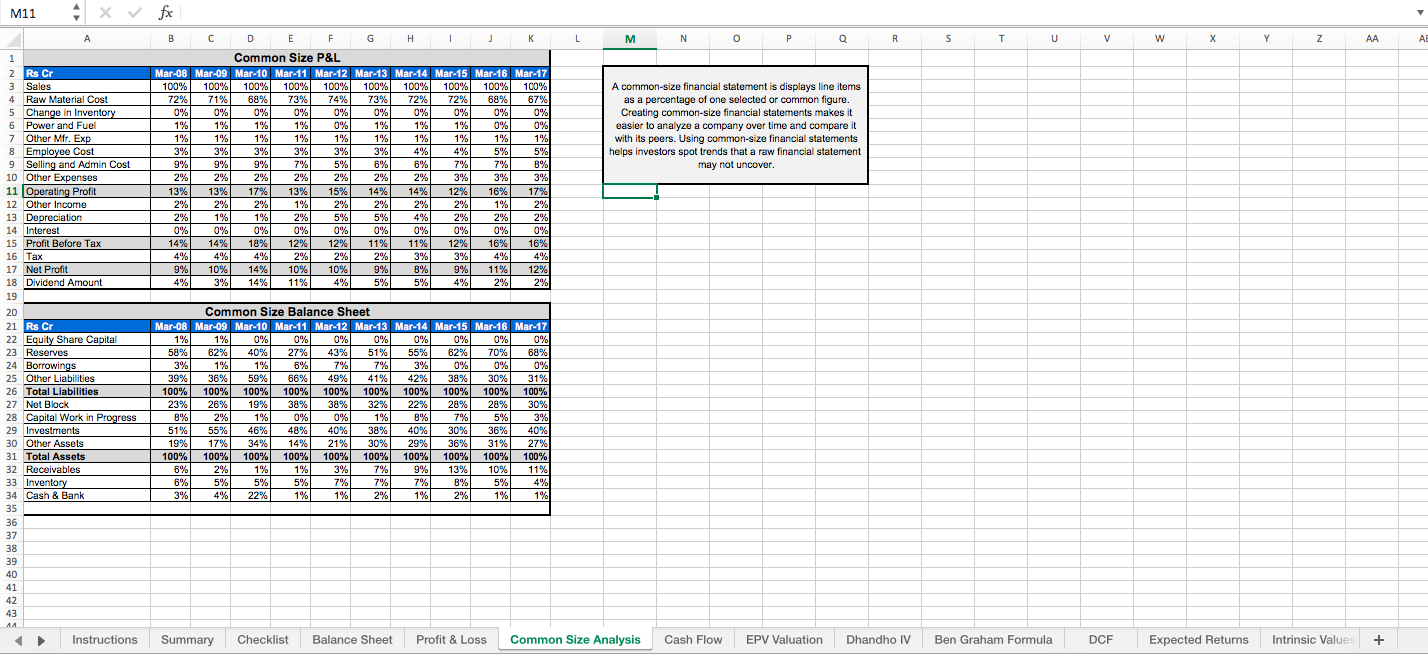
-> Common Size Analysis: Updated automatically. Contains common size analysis of both the Balance Sheet and the P&L Statement, and is an insightful way to analyze the changes in key numbers over the years, and compare across companies.
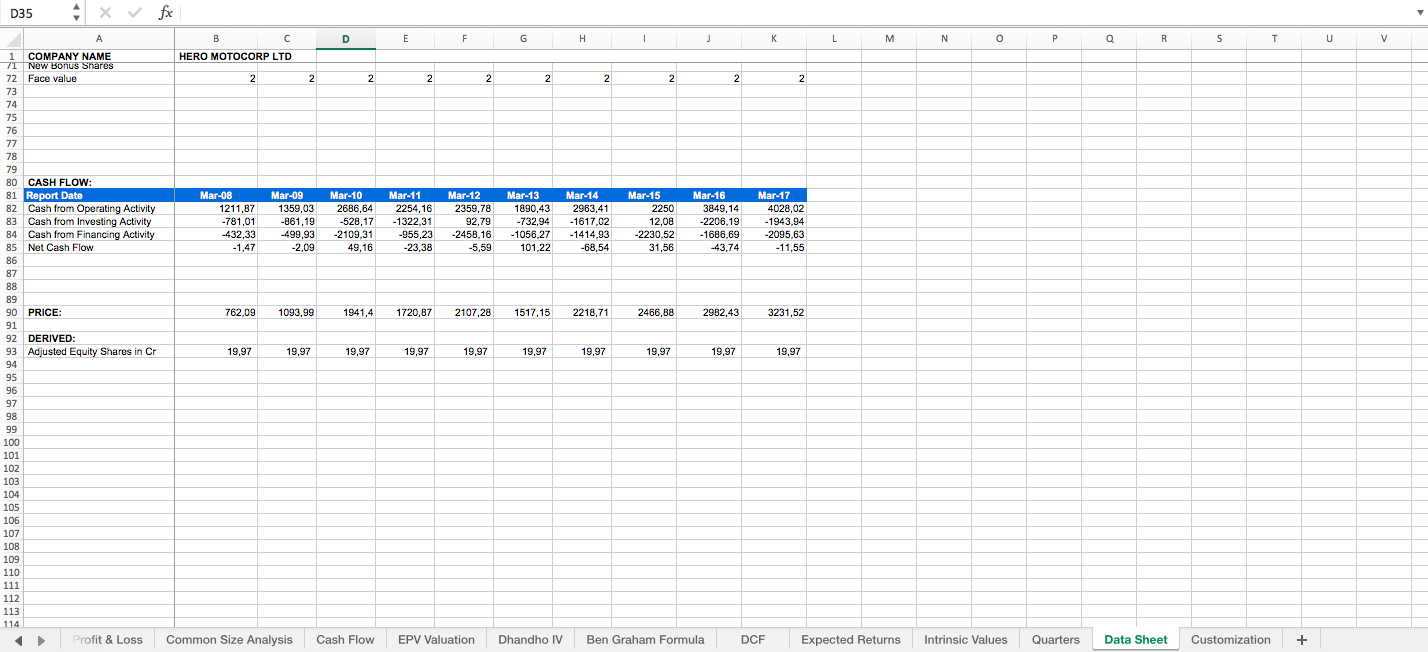
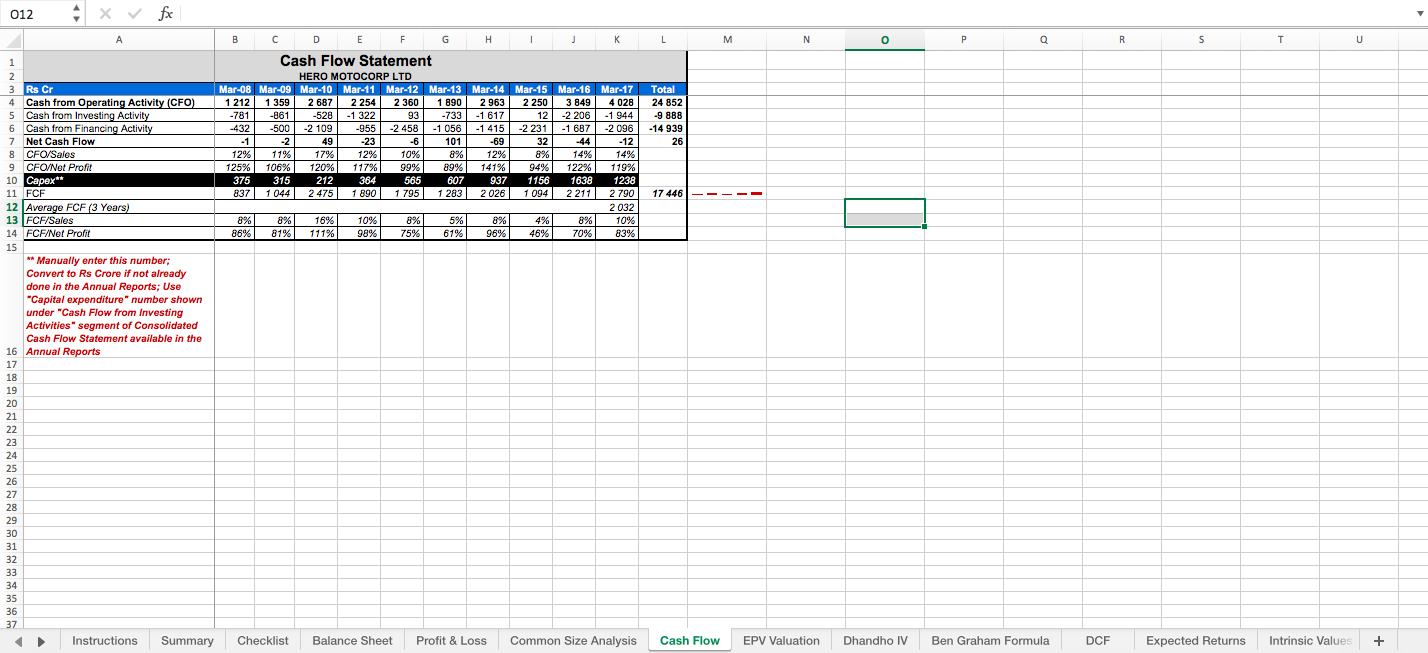
-> Cash Flow: Contains key Cash Flow numbers. Updated automatically, except the “Capex” number that you must enter manually (in Rs Crore) from the annual reports.
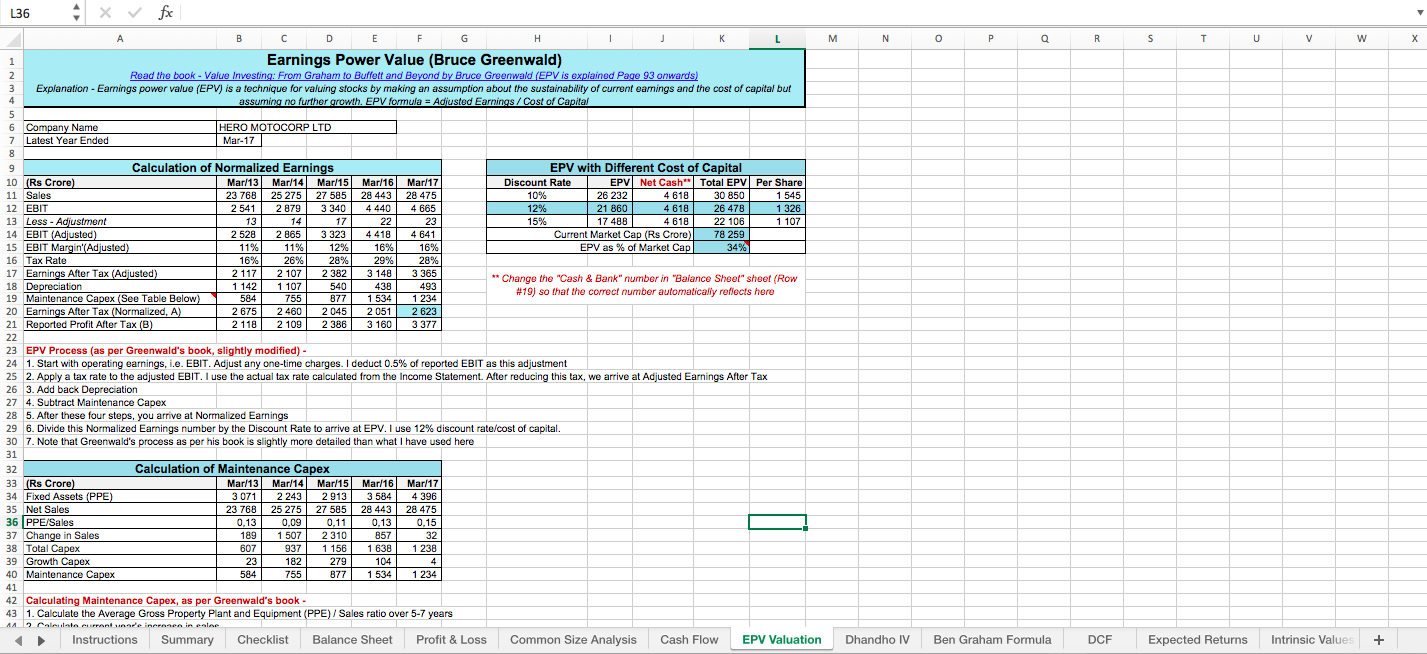
-> EPV Valuation: Updated automatically. Contains intrinsic value calculation as per the EPV framework described by Bruce Greenwald in his book Value Investing: From Graham to Buffett and Beyond.
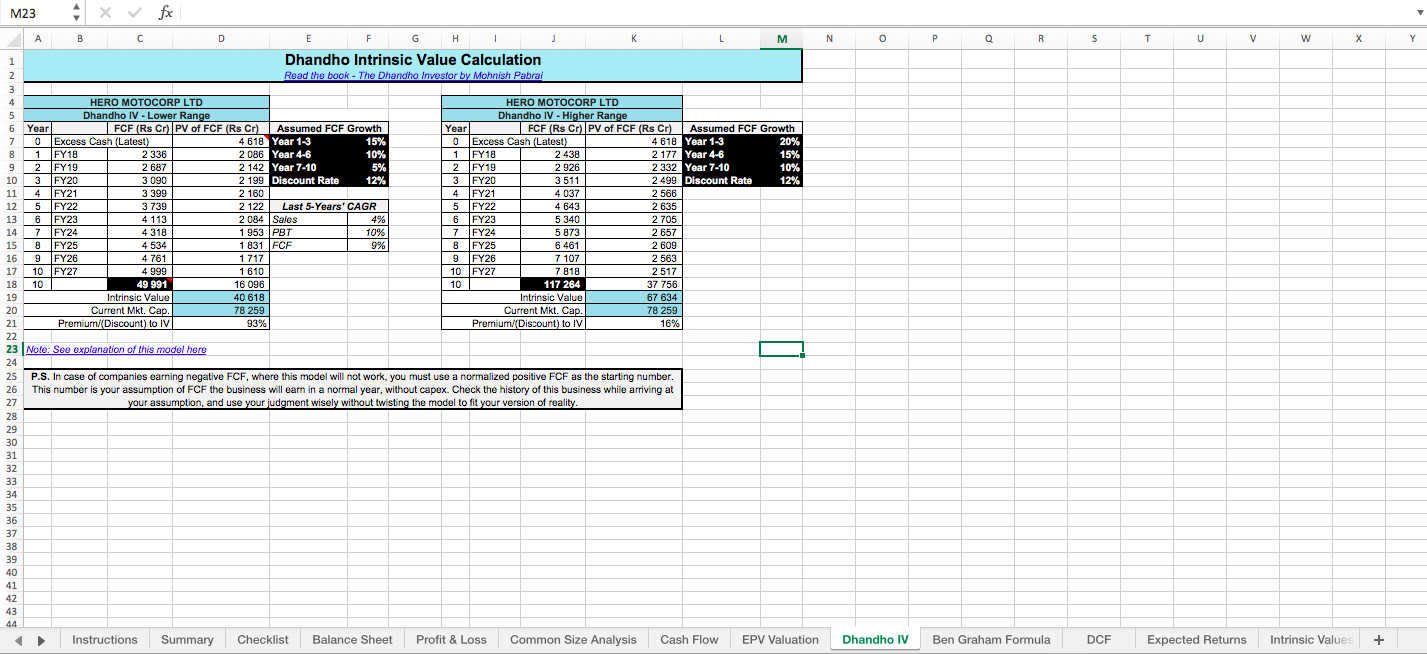
-> Dhandho Valuation: Updated automatically, though you may change assumptions in the black cells. Contains intrinsic value calculation as per the framework described by Mohnish Pabrai in his book The Dhandho Investor.
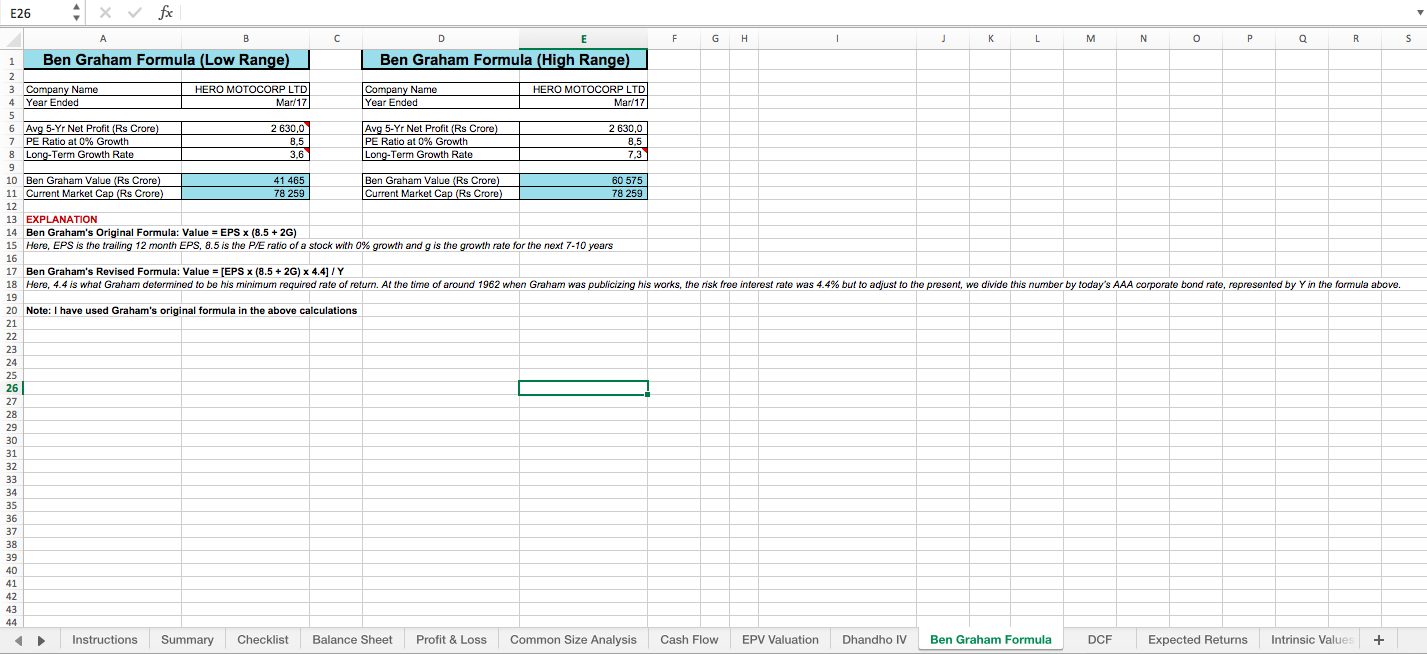
-> Ben Graham Formula: Updated automatically. Contains intrinsic value calculation as per the framework mentioned by Ben Graham in The Intelligent Investor.
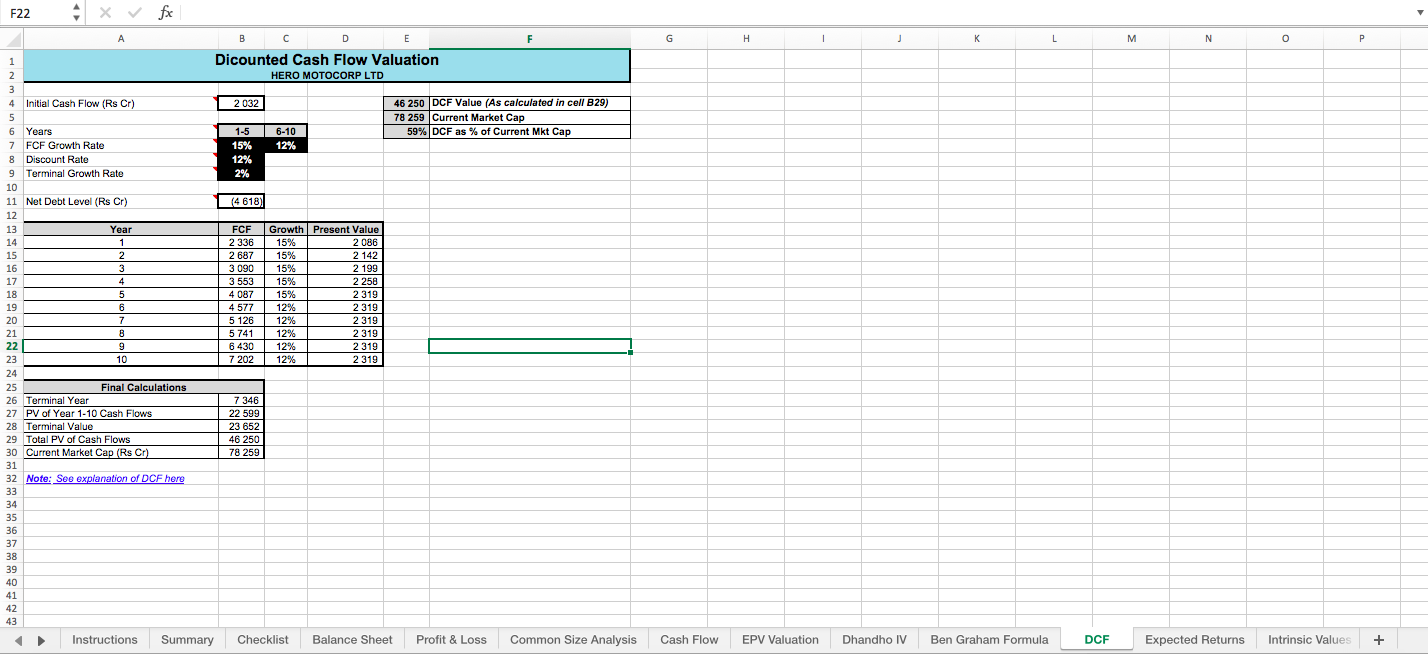
-> DCF: Updated automatically. Contains intrinsic value calculation as per the discounted cash flow method.
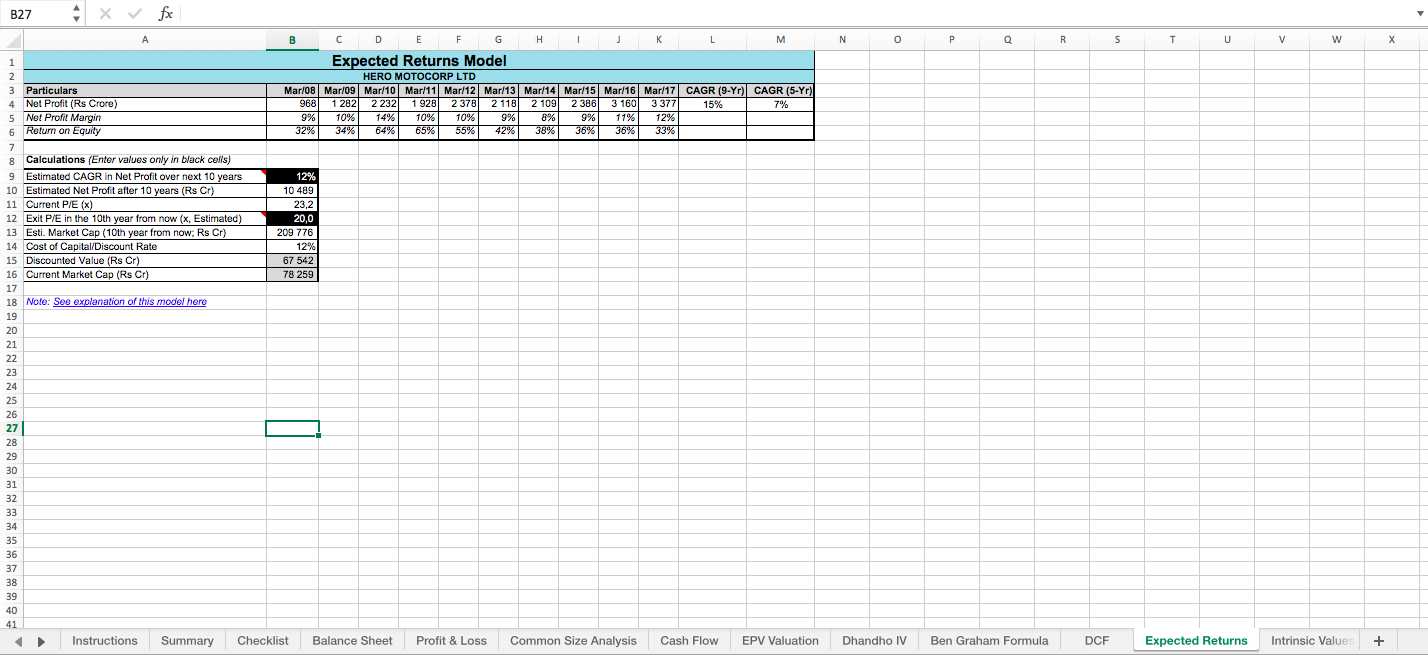
-> Expected Returns: Updated automatically, though you may change assumptions in the black cells. Contains intrinsic value calculation as per the framework described by Prof. Sanjay Bakshi in an interaction with me.
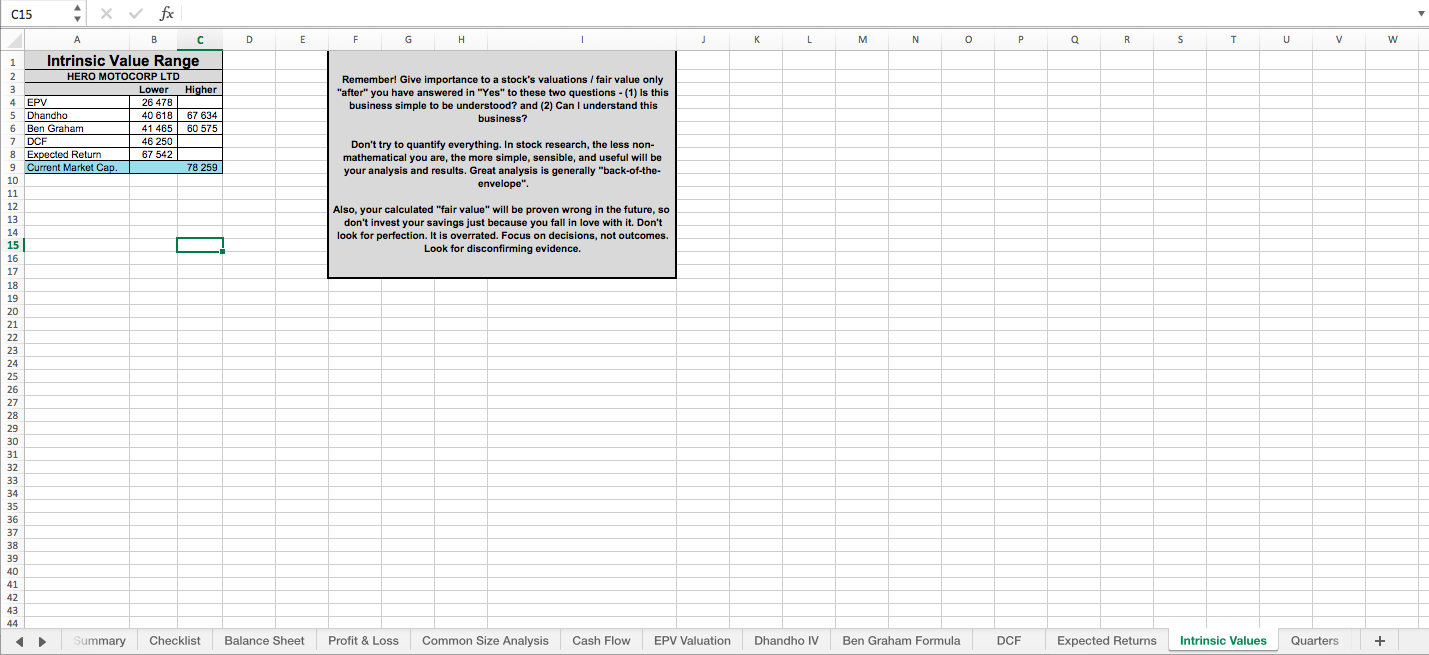
-> Intrinsic Values: Updated automatically. Contains intrinsic value ranges calculated in the previous five sheets to enable you to assess the broad range as compared to the market cap of the stock.
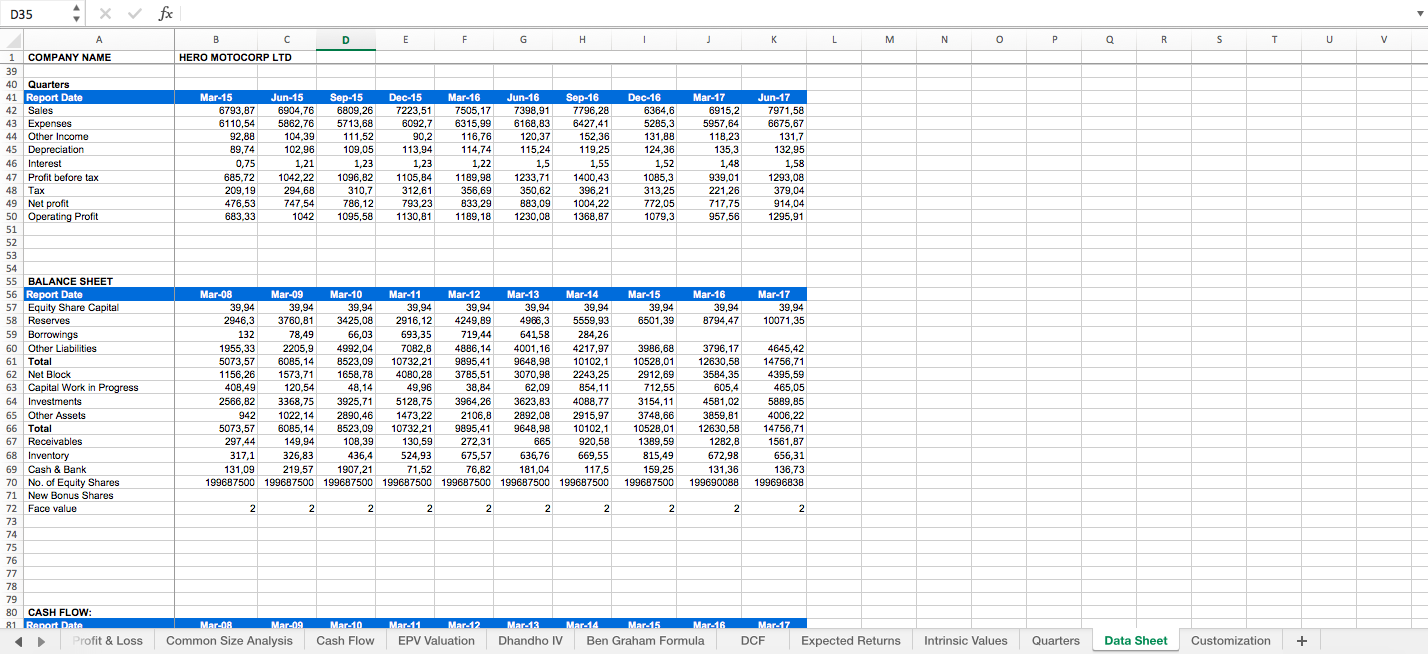
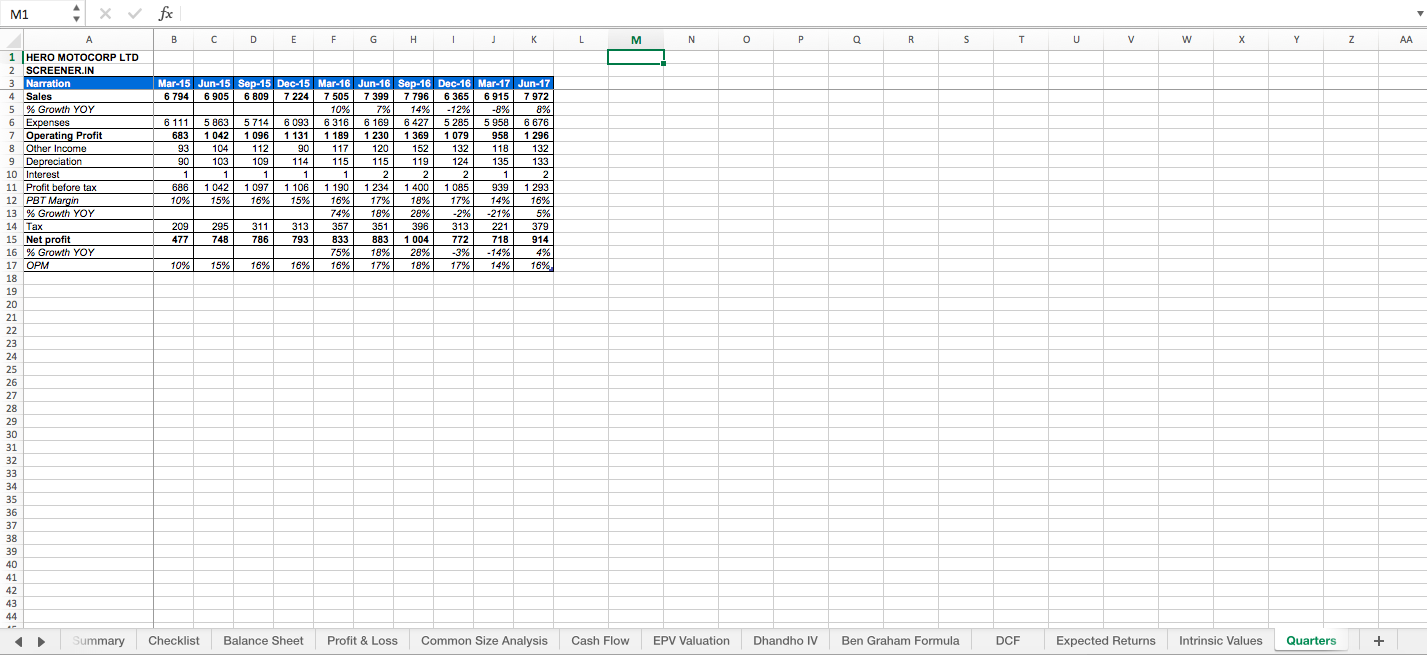
-> Quarters: Updated automatically. Contains a few key quarterly numbers.
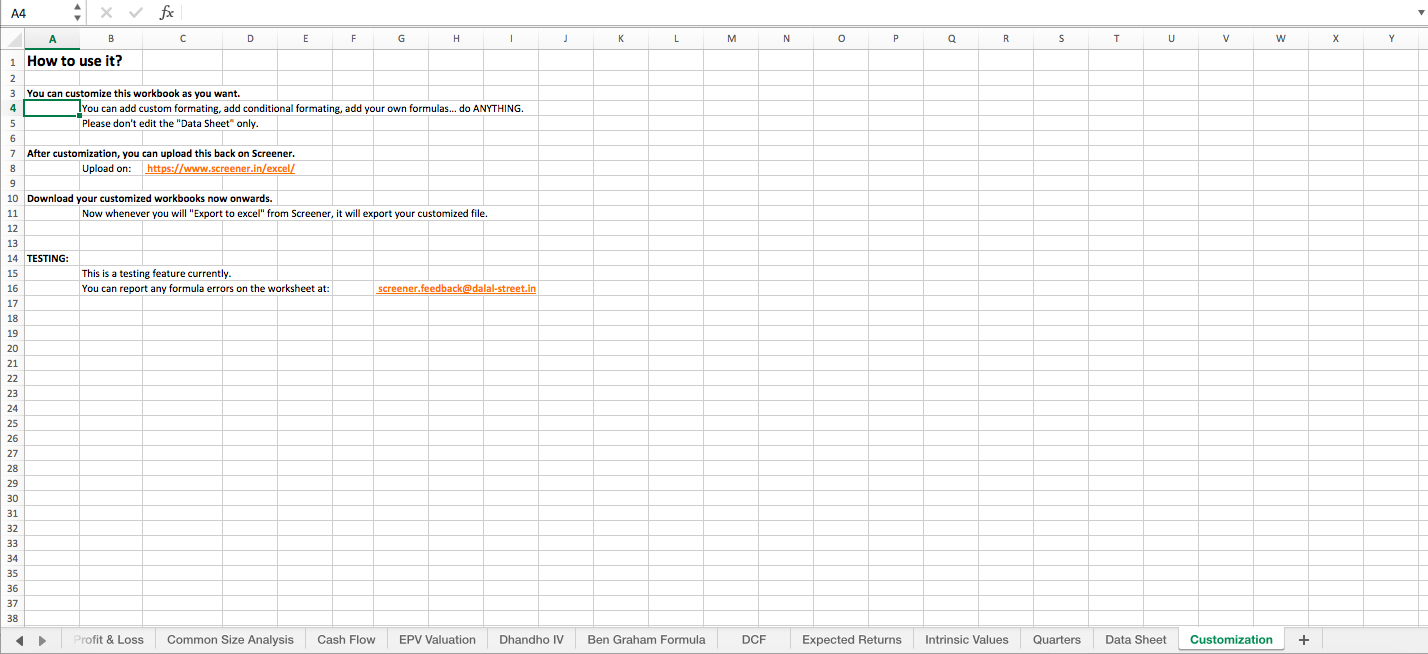
-> Data Sheet: Don’t touch this sheet at all. This is the core sheet from Screener.in site and any changes to it may produce errors if you want to customize the Safal Niveshak excel and upload again to Screener’s site.
Words of Warning!
Before you get down to using this excel, remember six critical things…
1/ It’s just a compass and not a map. So take your next step carefully.
2/ Don’t look for perfection. It is overrated.
3/ Focus on decisions, not outcomes.
4/ Look for disconfirming evidence. Avoid falling in love with the numbers.
5/Remember Charlie Munger who said, “All I want to know is where I’m going to die, so I won’t go there.” Depending just on this excel for decision-making can really kill you (financially)!
Let me know if you found this excel helpful. I will try to improve upon this in the future based on your feedback.
Share your thoughts, suggestions, and testimonial for this excel in the Comments section

