

Originally published: 18/04/2020 16:42
Last version published: 06/06/2025 08:11
Publication number: ELQ-60403-10
View all versions & Certificate
Last version published: 06/06/2025 08:11
Publication number: ELQ-60403-10
View all versions & Certificate

Economic Feasibility Forecast: Manufacturing Plant
A 10-year financial model designed for general manufacturing of nearly any kind of widget(s).
manufacturingcost of goods soldcogsmanufacturing plantcost per unitfinancial feasibilityeconomicsfinancestatement modelcap table
Description
Recent Update: Added a fully integrated 3-statement model (Income Statement, Balance Sheet, and Cash Flow Statement) and cap table.
This is a highly robust template that offers a 10-year monthly and annual forecast. It is driven by a wide range of key assumptions directly related to the operations of a manufacturing plant.
This kind of business has a few different unique aspects to it that pose challenging dilemmas when trying to build proper levers and variables.
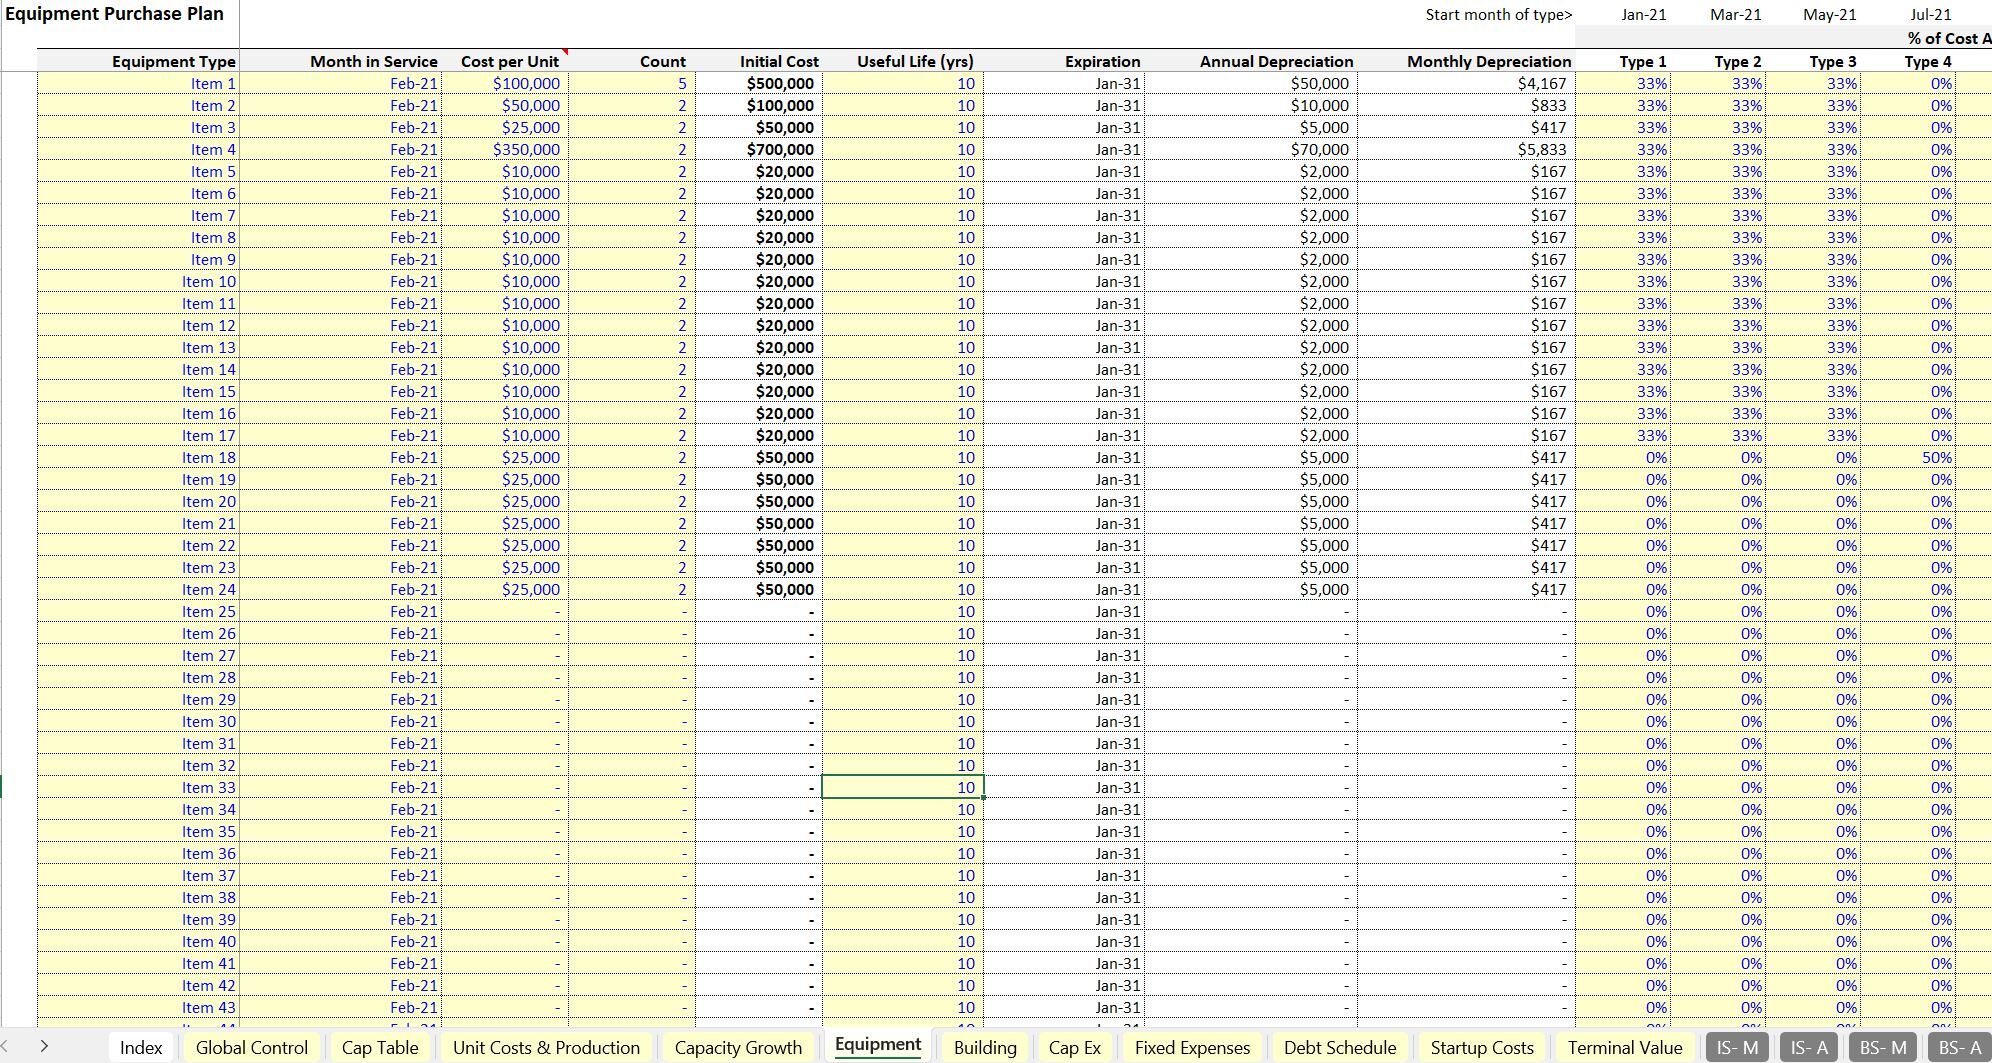
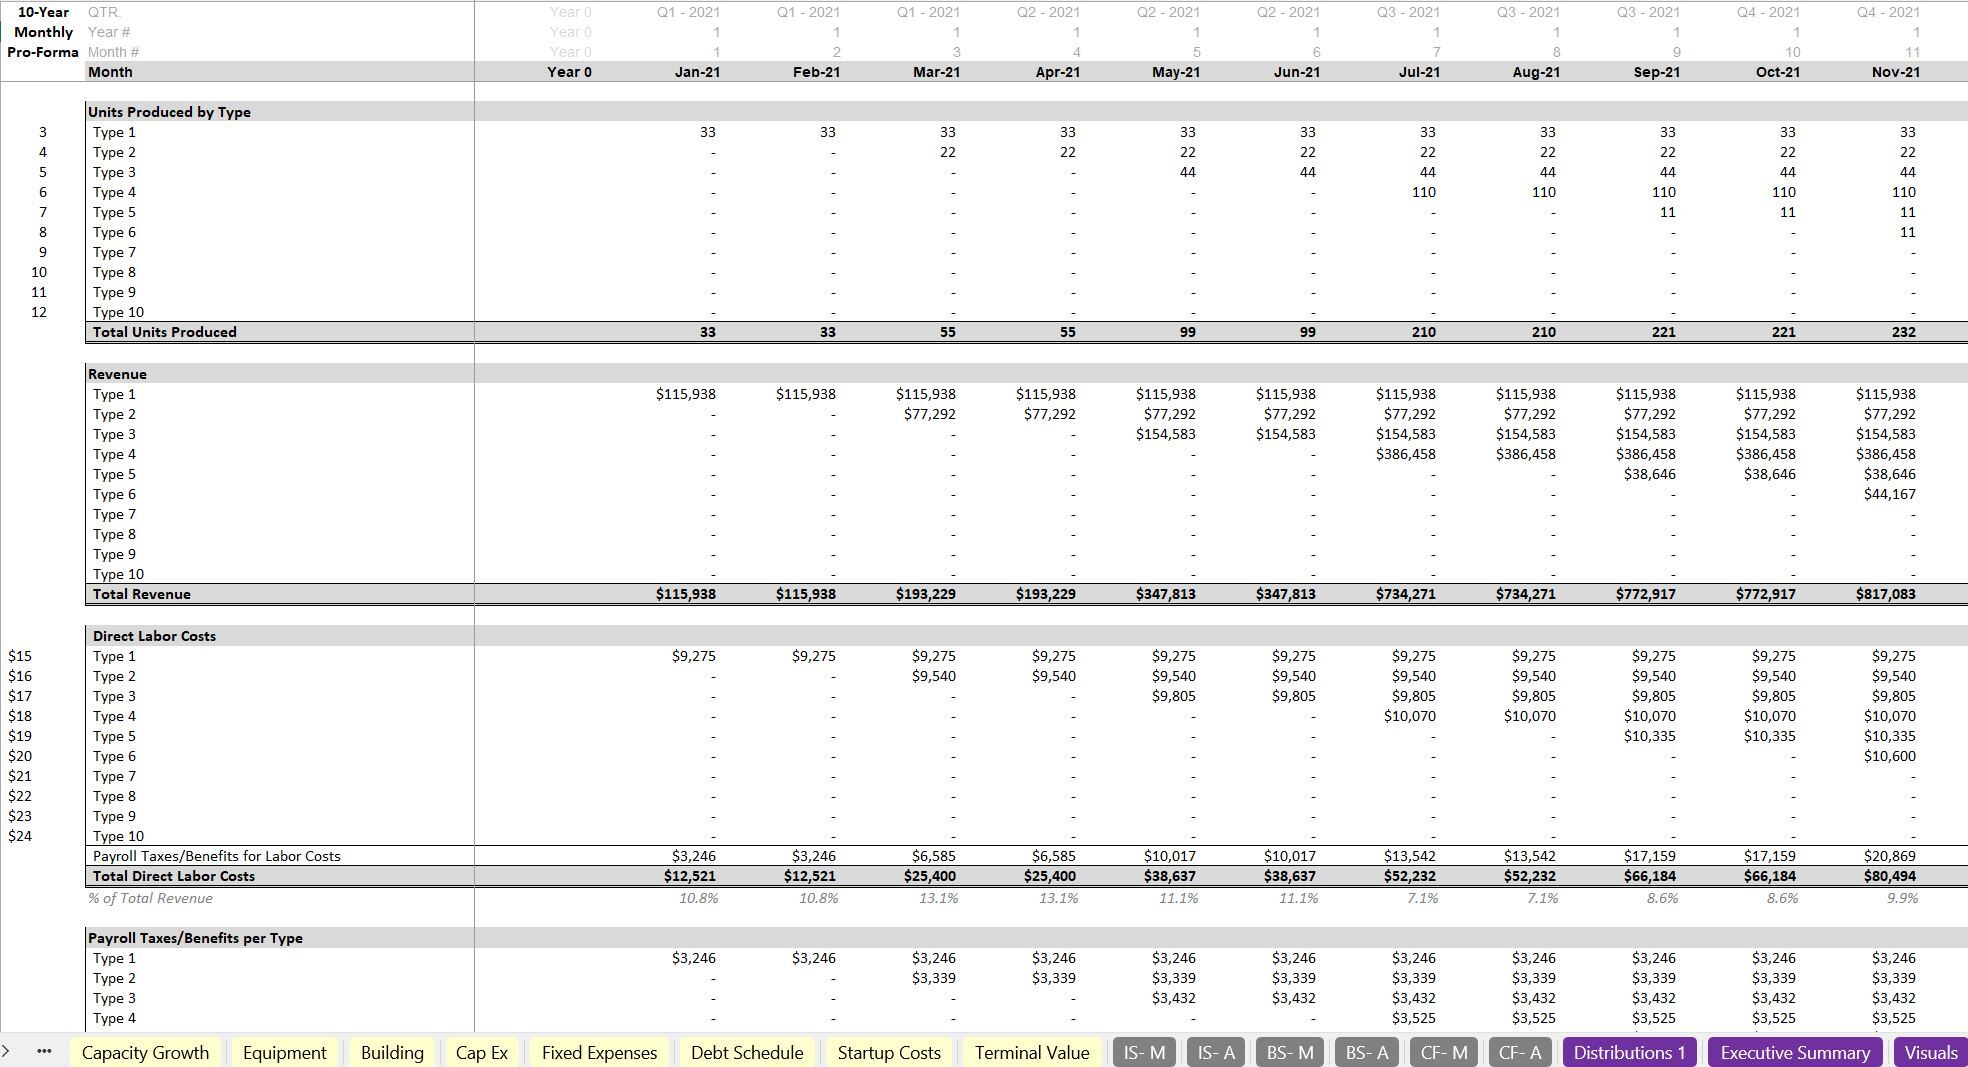
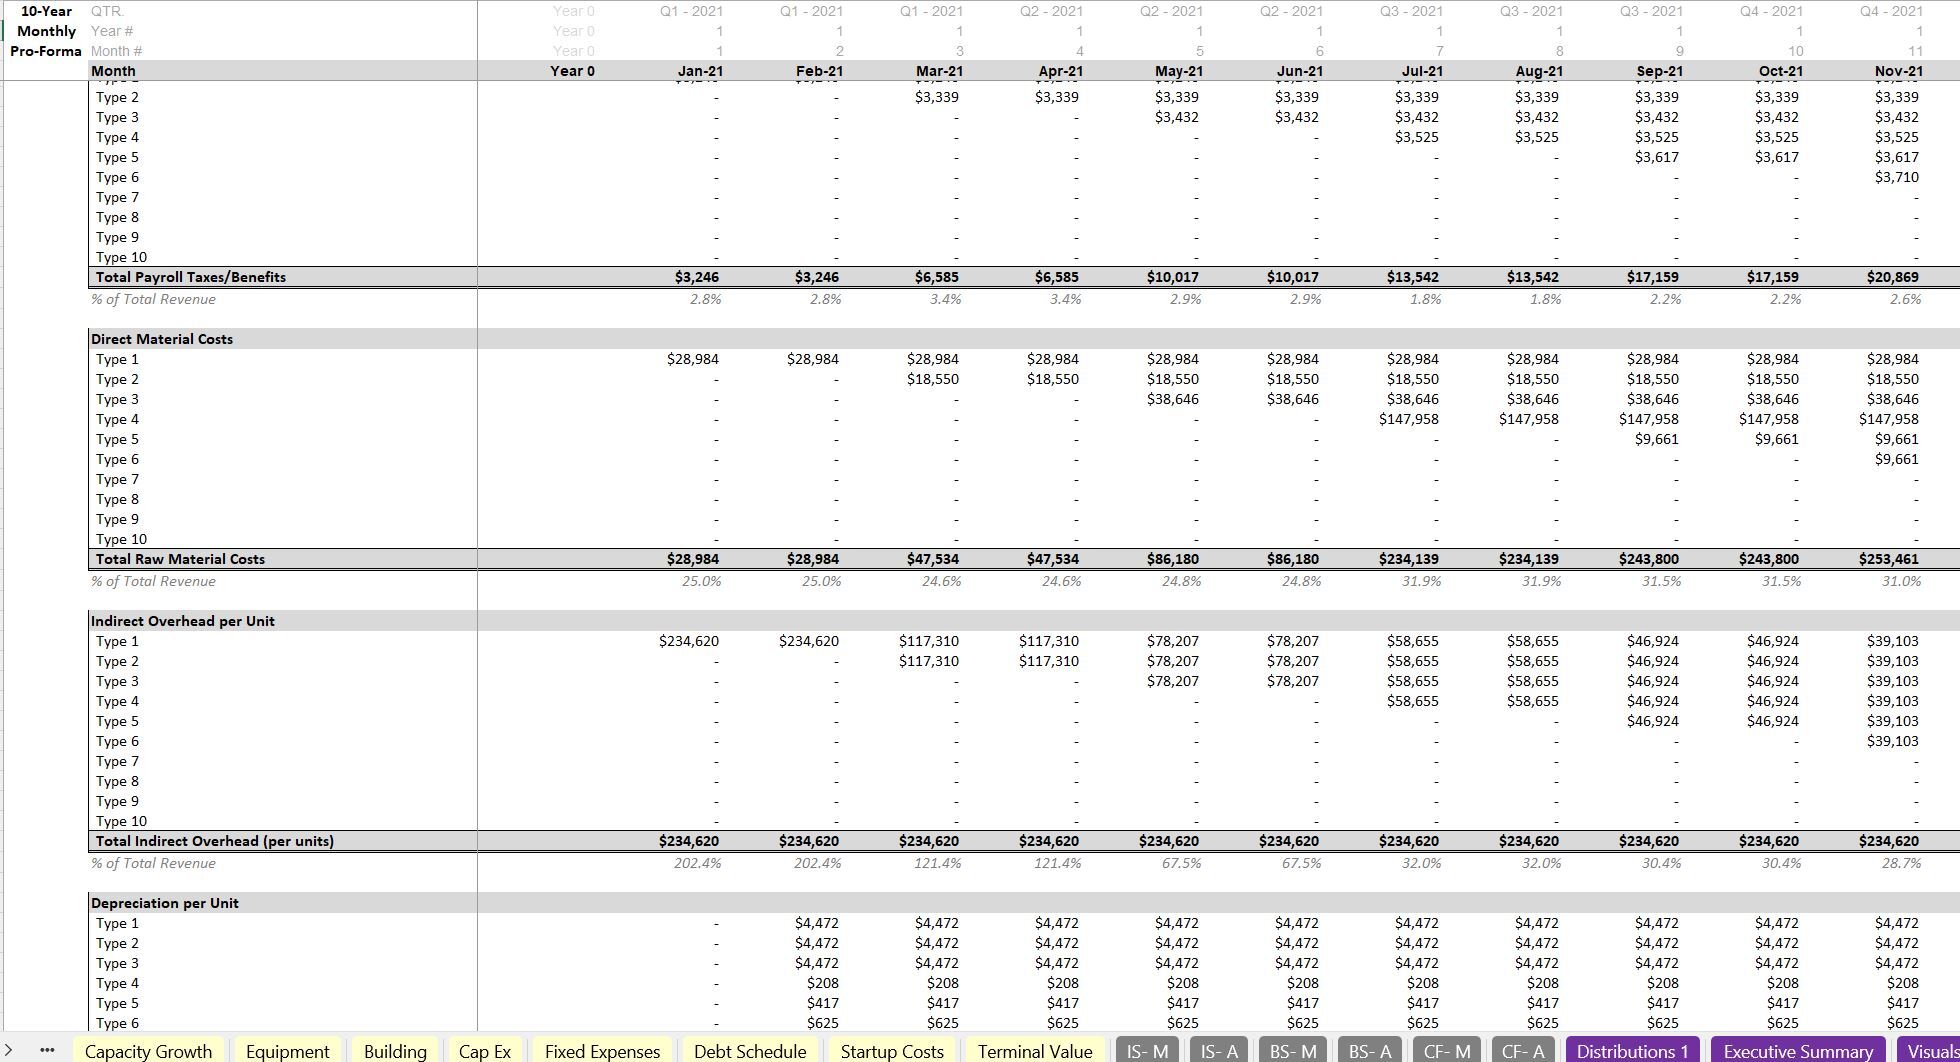
The biggest challenge is correctly assigning costs to each unit type. This model has the ability to drive production based on up to 10 different types of widgets and over 80 different slots for equipment types. The month that each widget type goes into production can be variable as well as when equipment is put into service. The resulting depreciation is dynamically assigned to widgets over time.
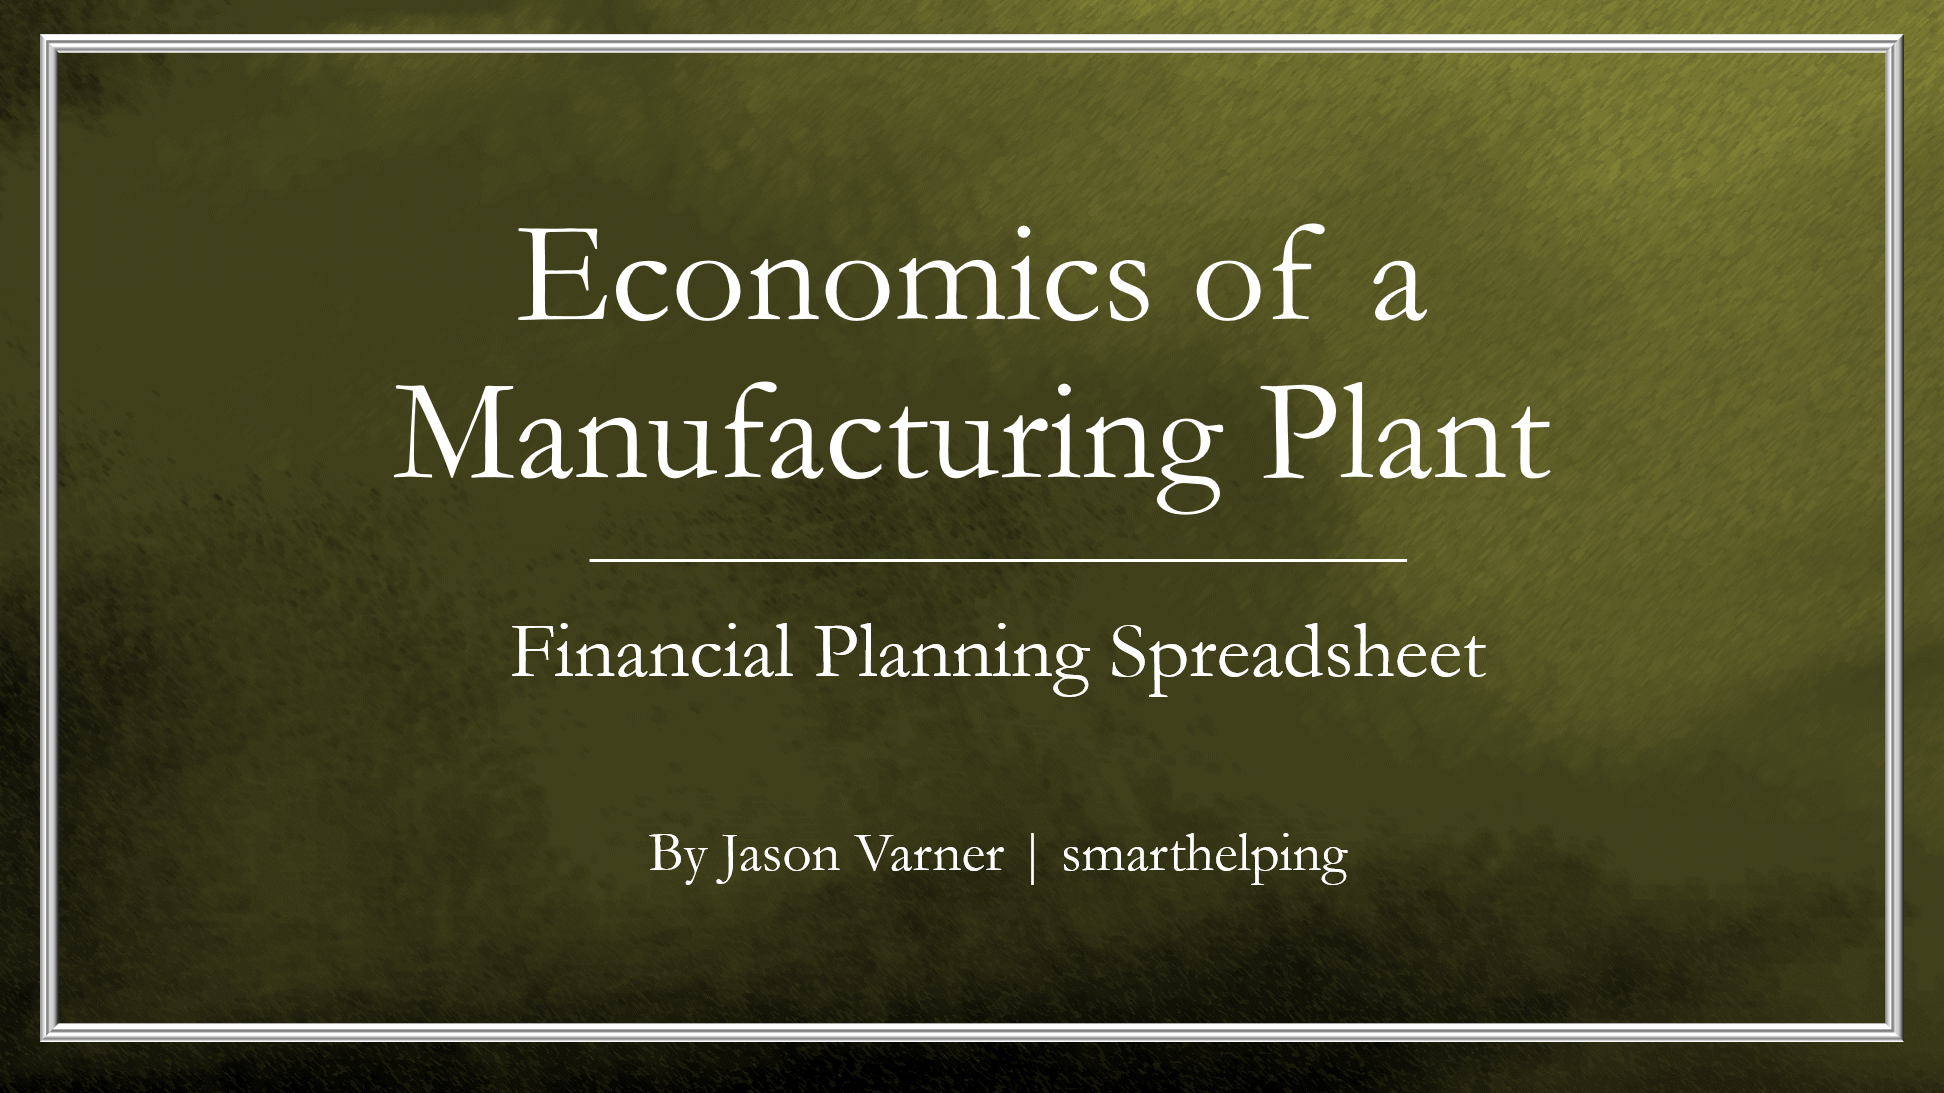
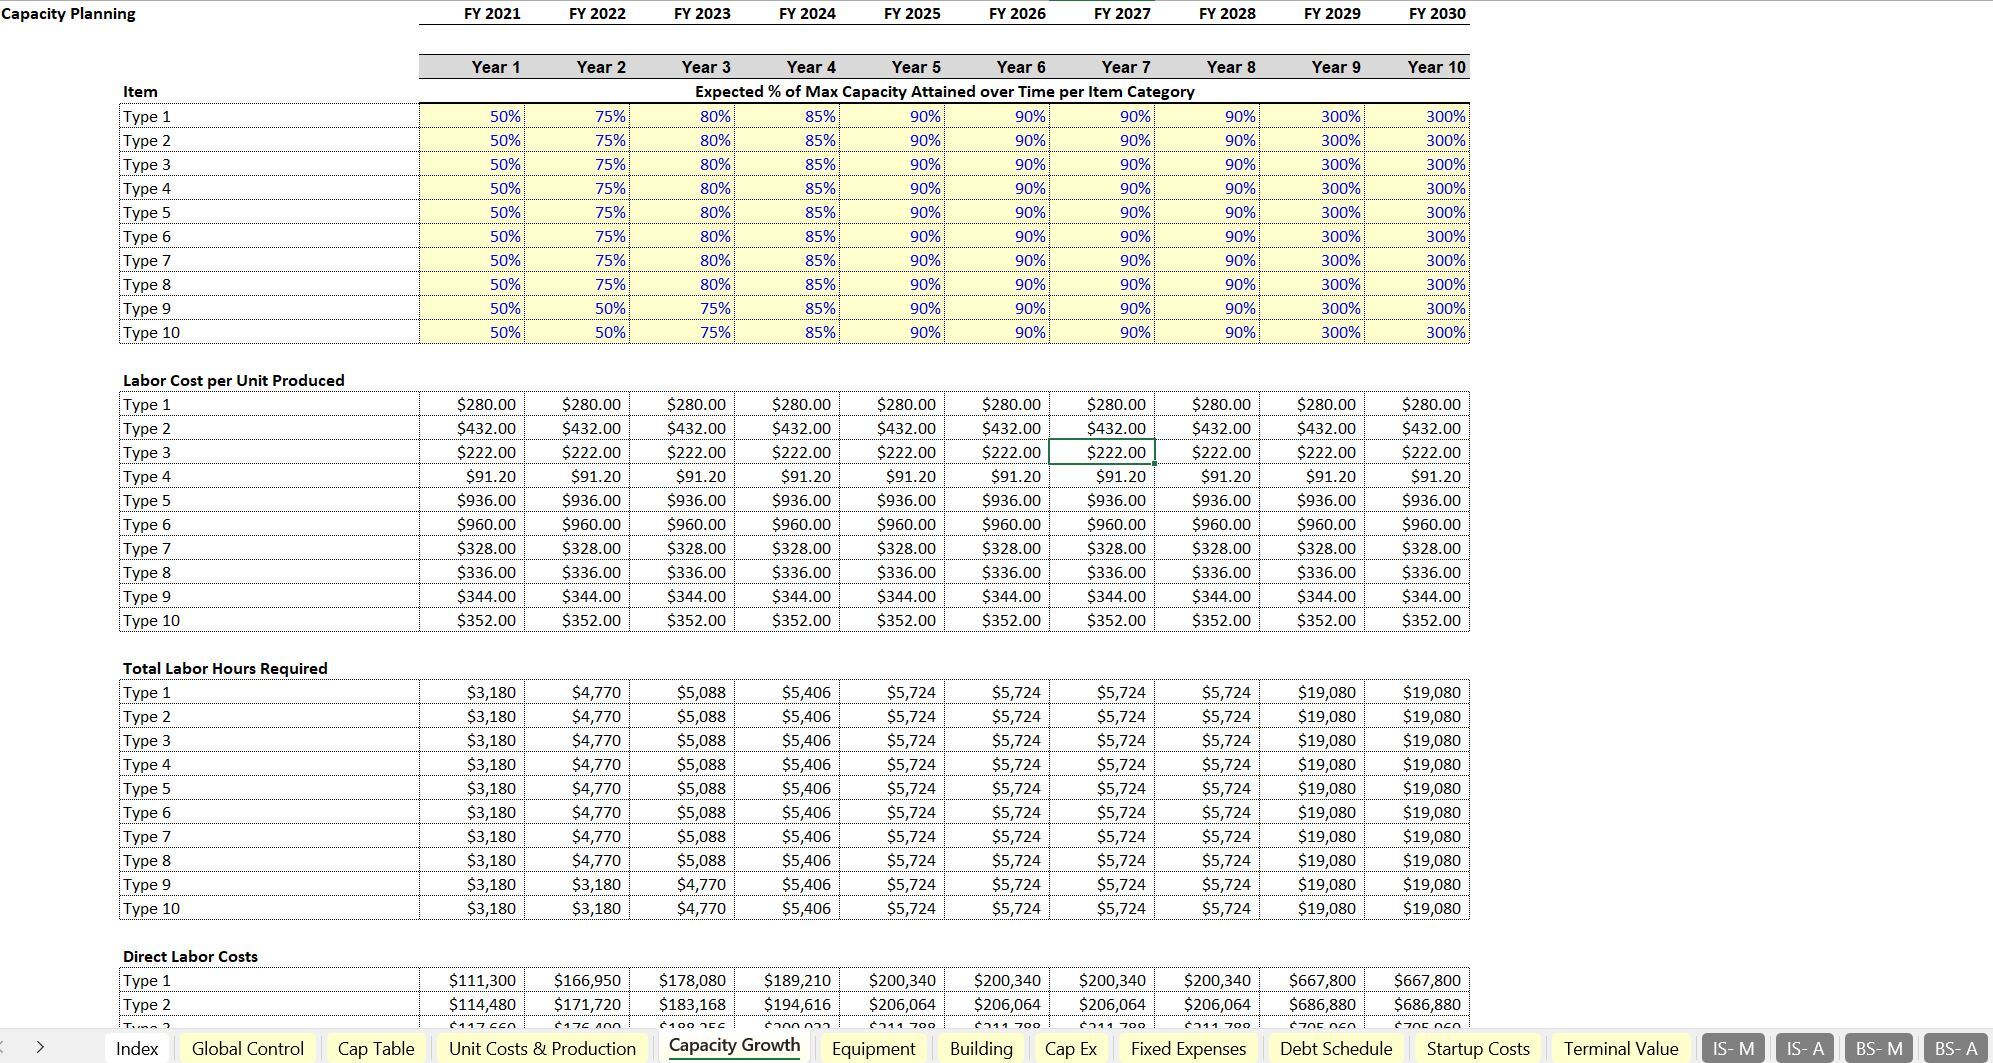
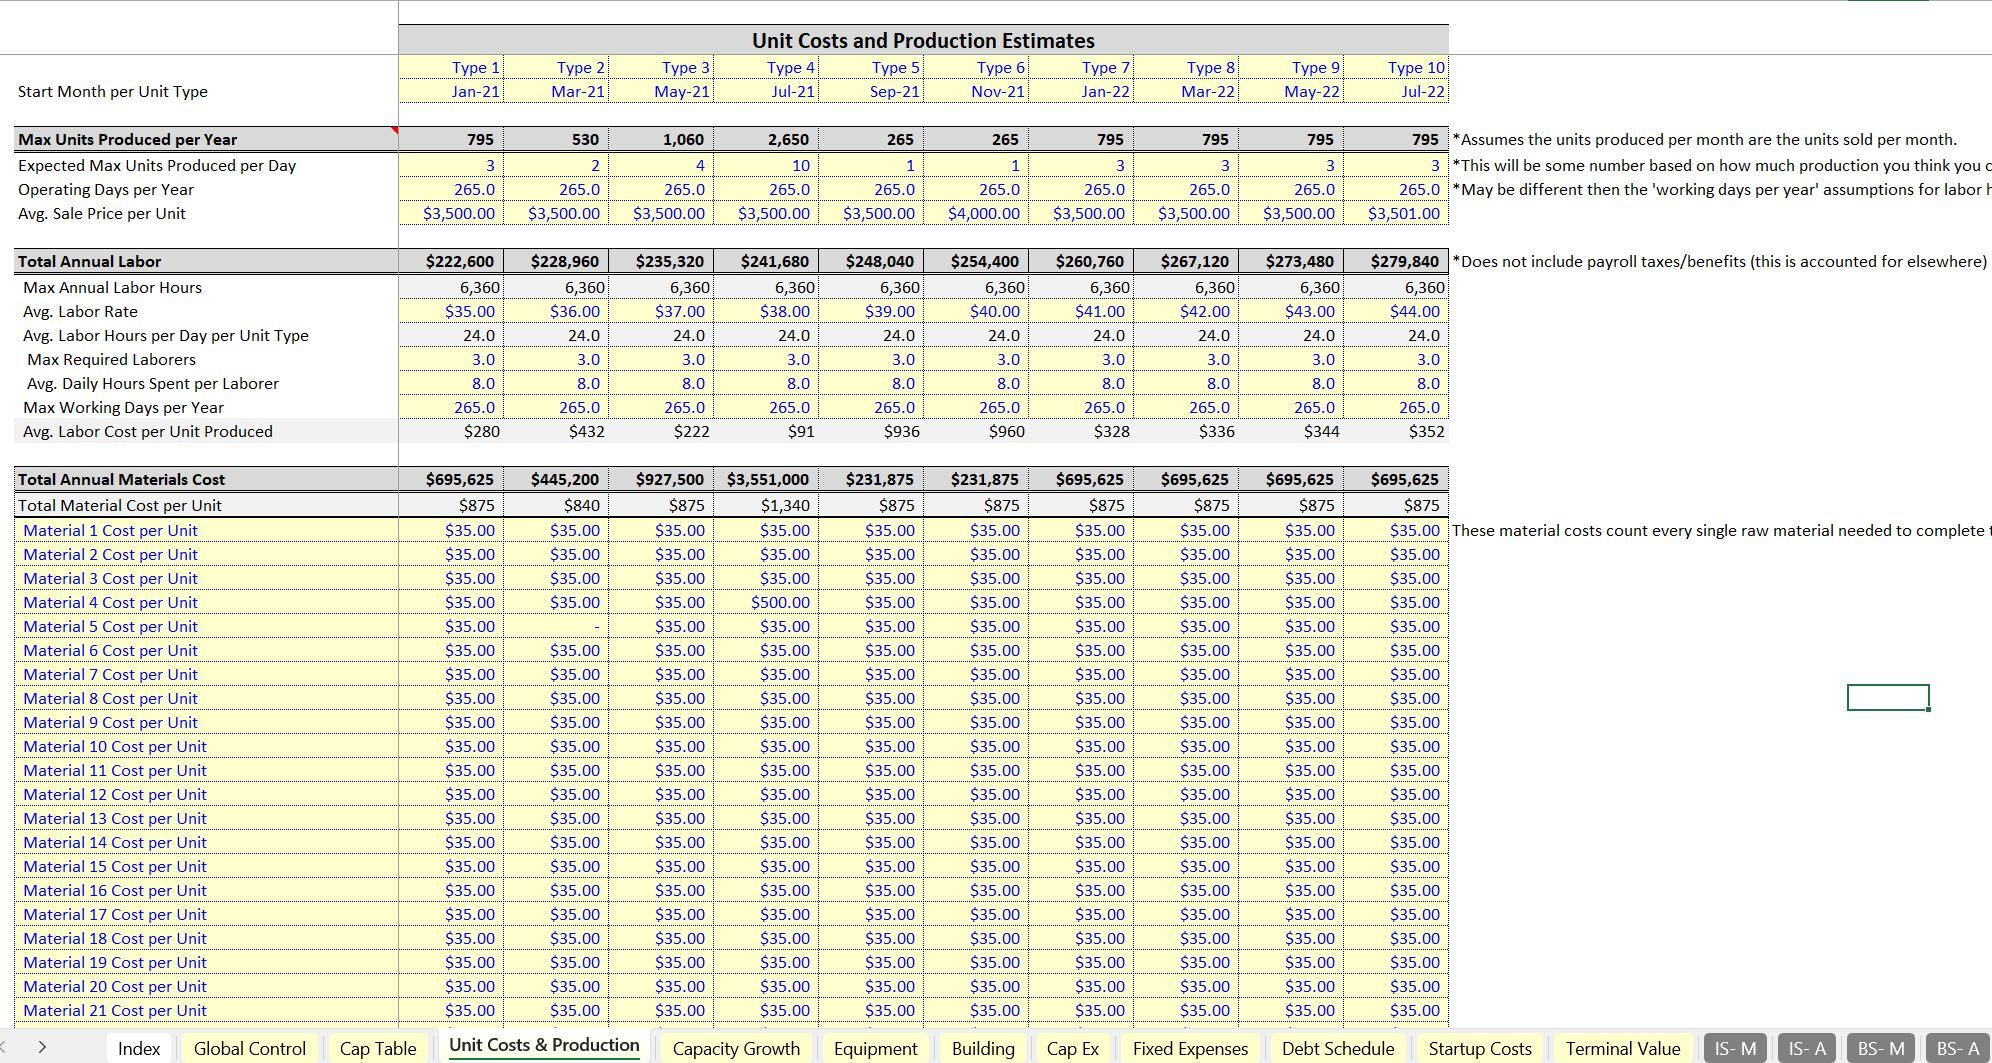
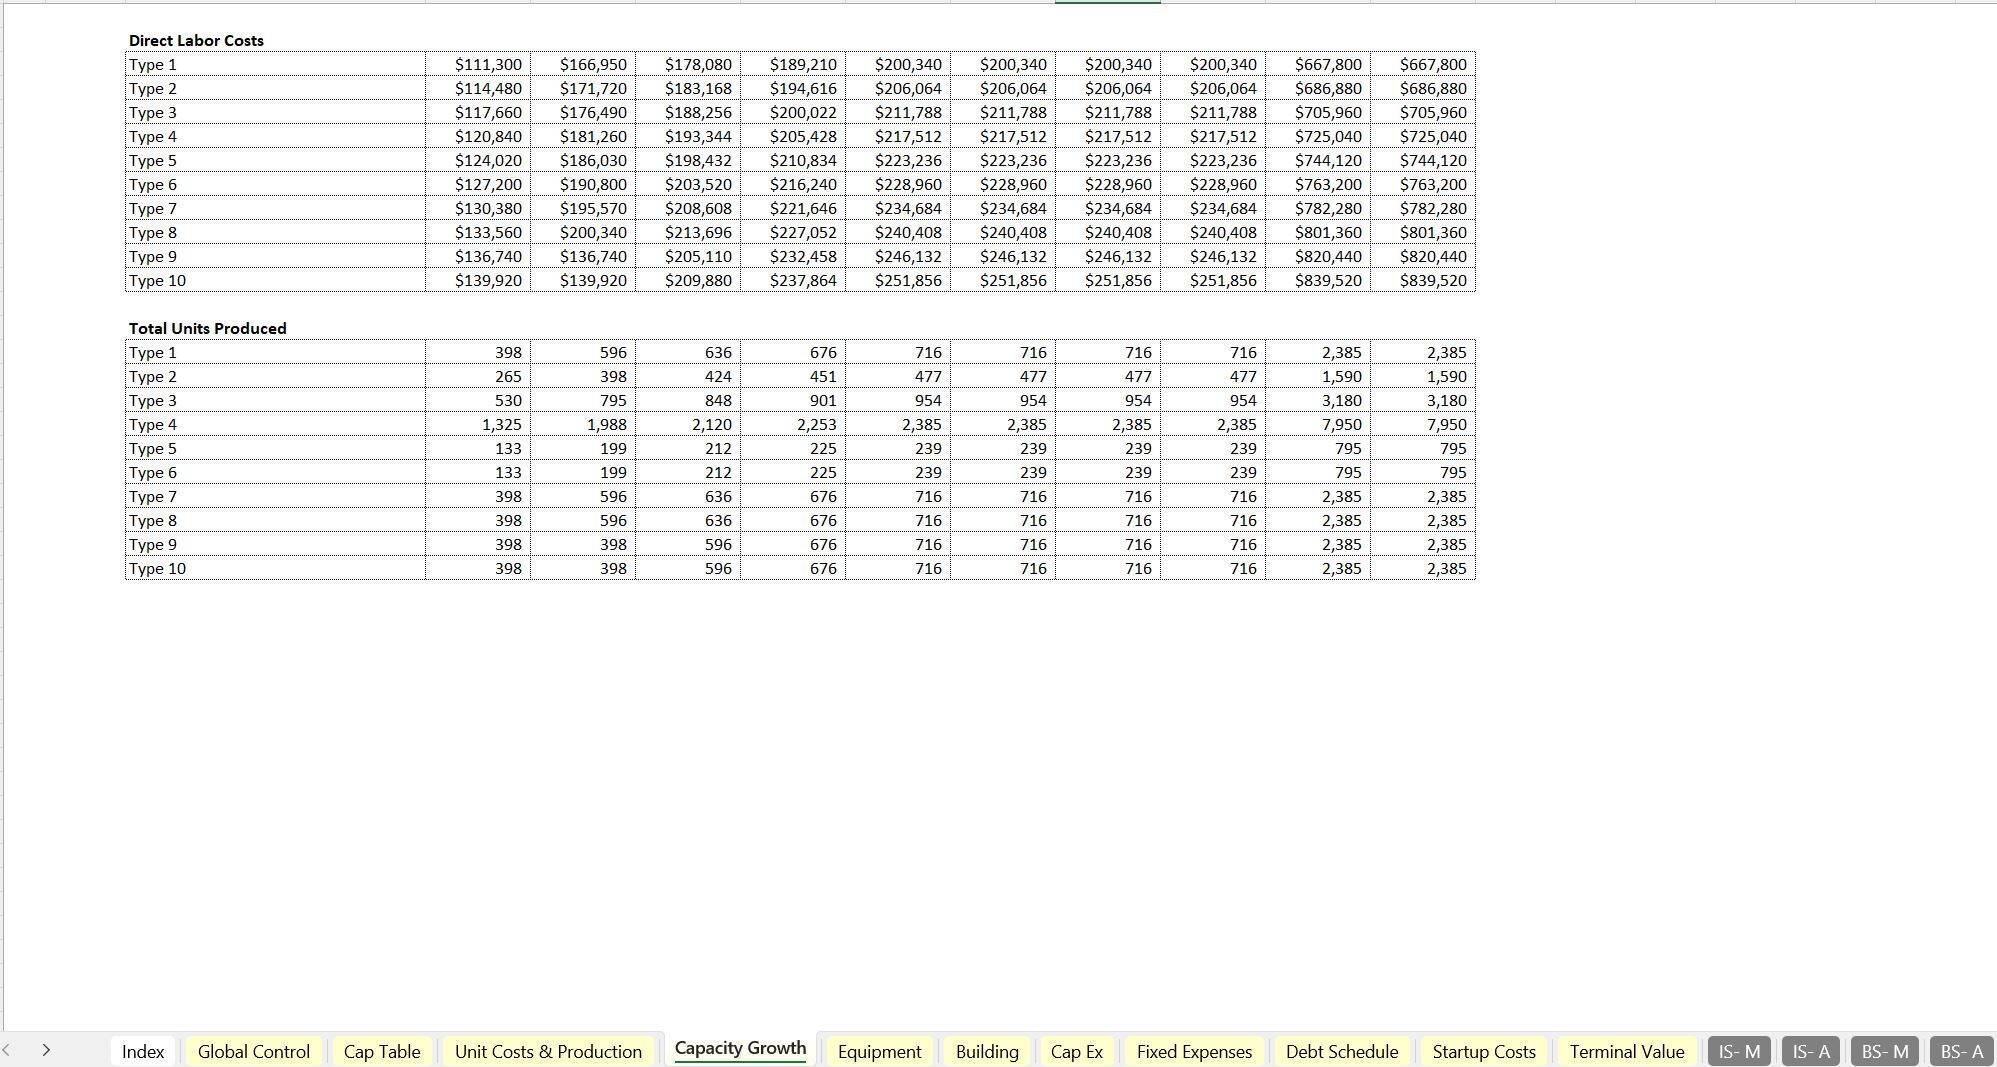
The other primary components include a bottoms up build out of direct labor costs per widget type as well as raw material costs. The user can define the max production (# of units produced per day, working days per year) as well as max direct labor costs per number of laborers required, their hours per day, and their average hourly rate. This is all configurable for each of the 10 widget types. There are capacity percentages to input for each year to show how close to 'max production' a given type of widget achieves since it is not likely production starts at 100% capacity in year 1.
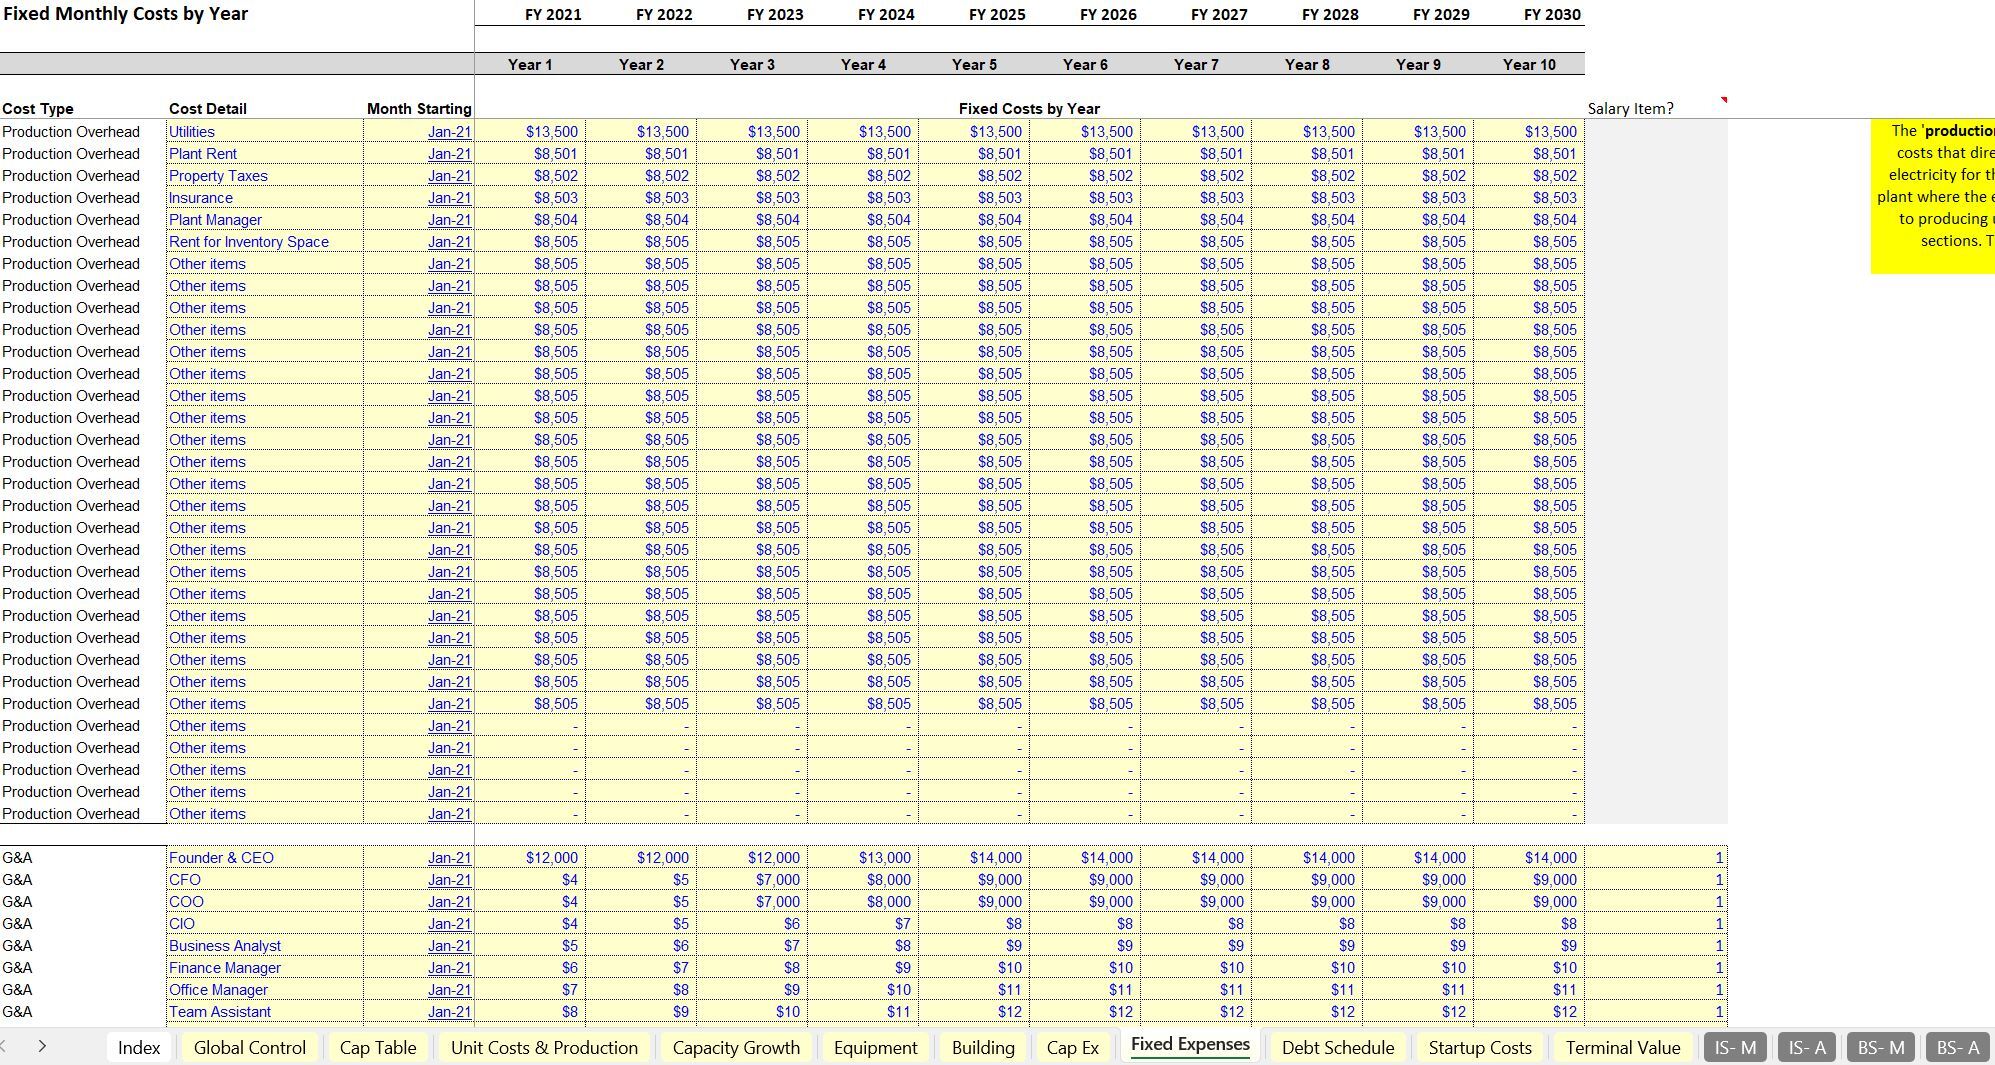
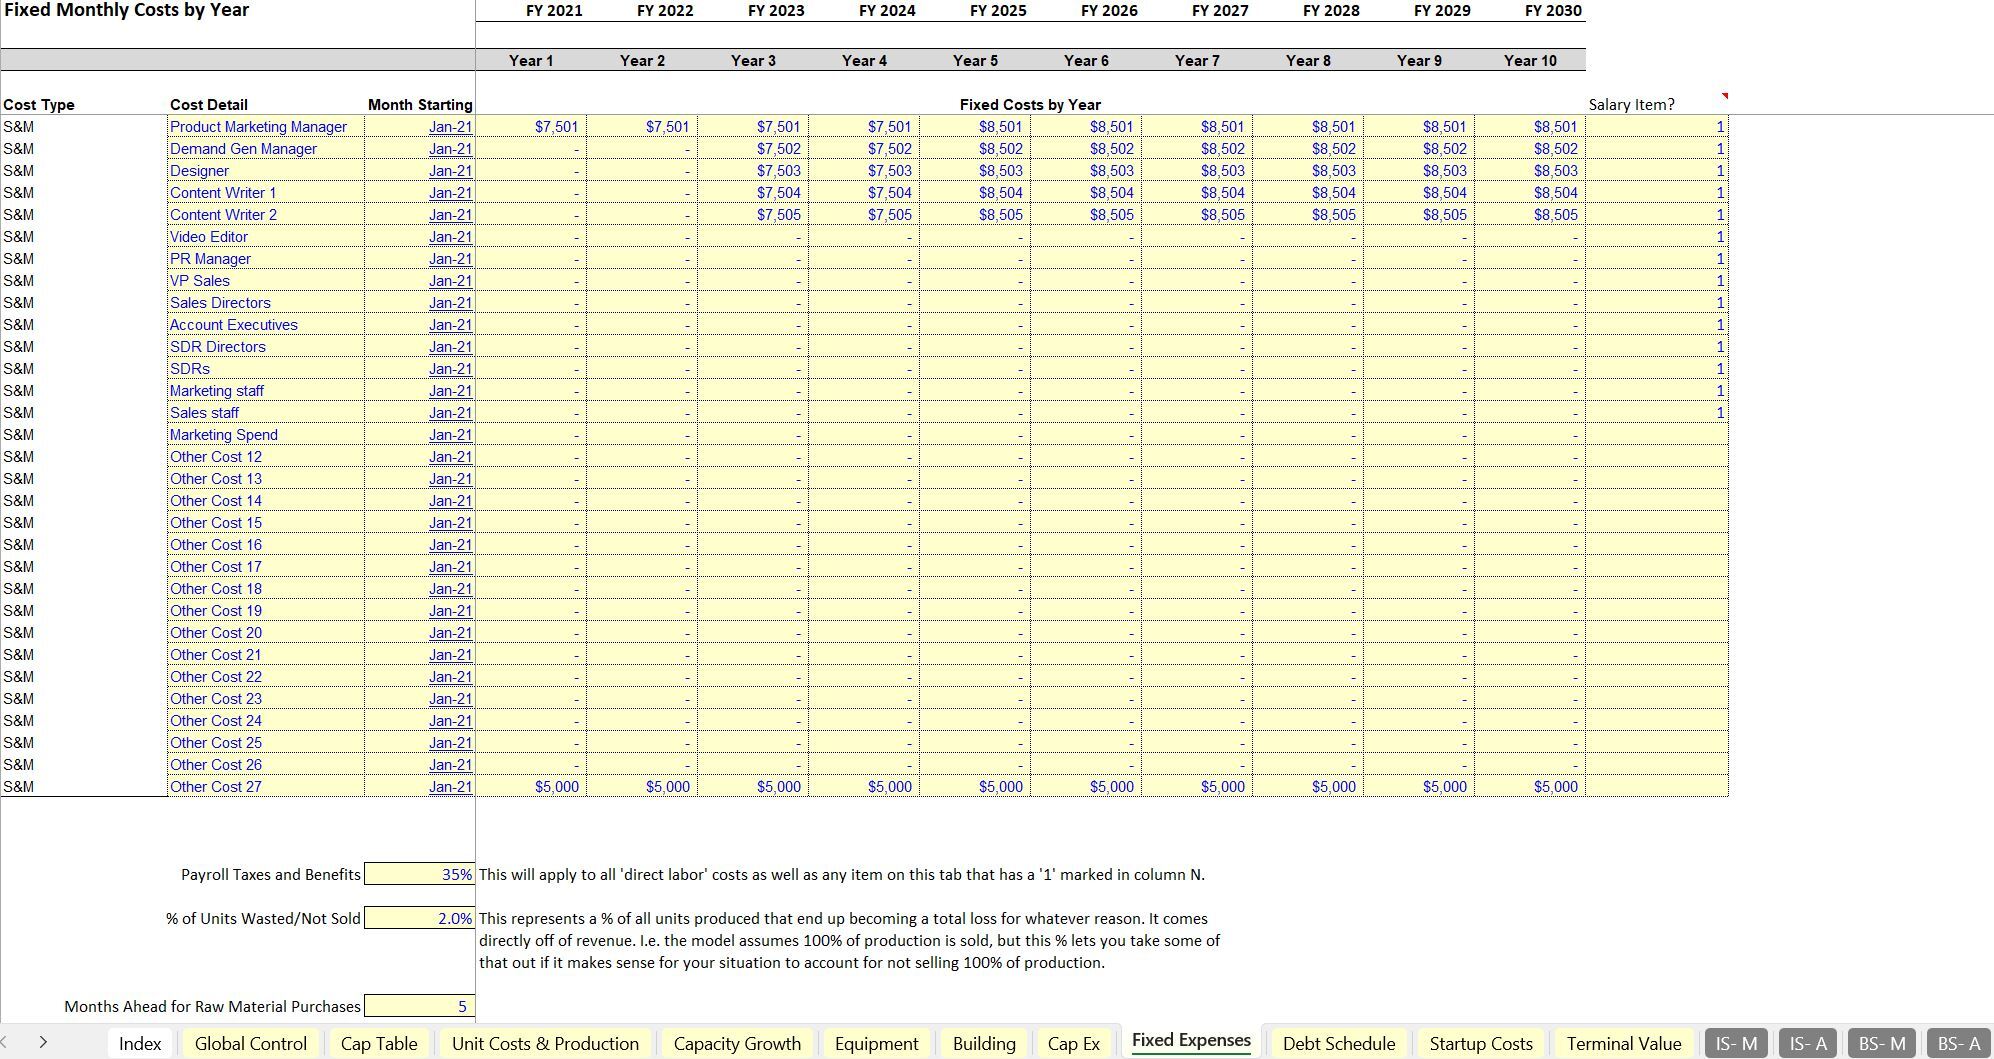
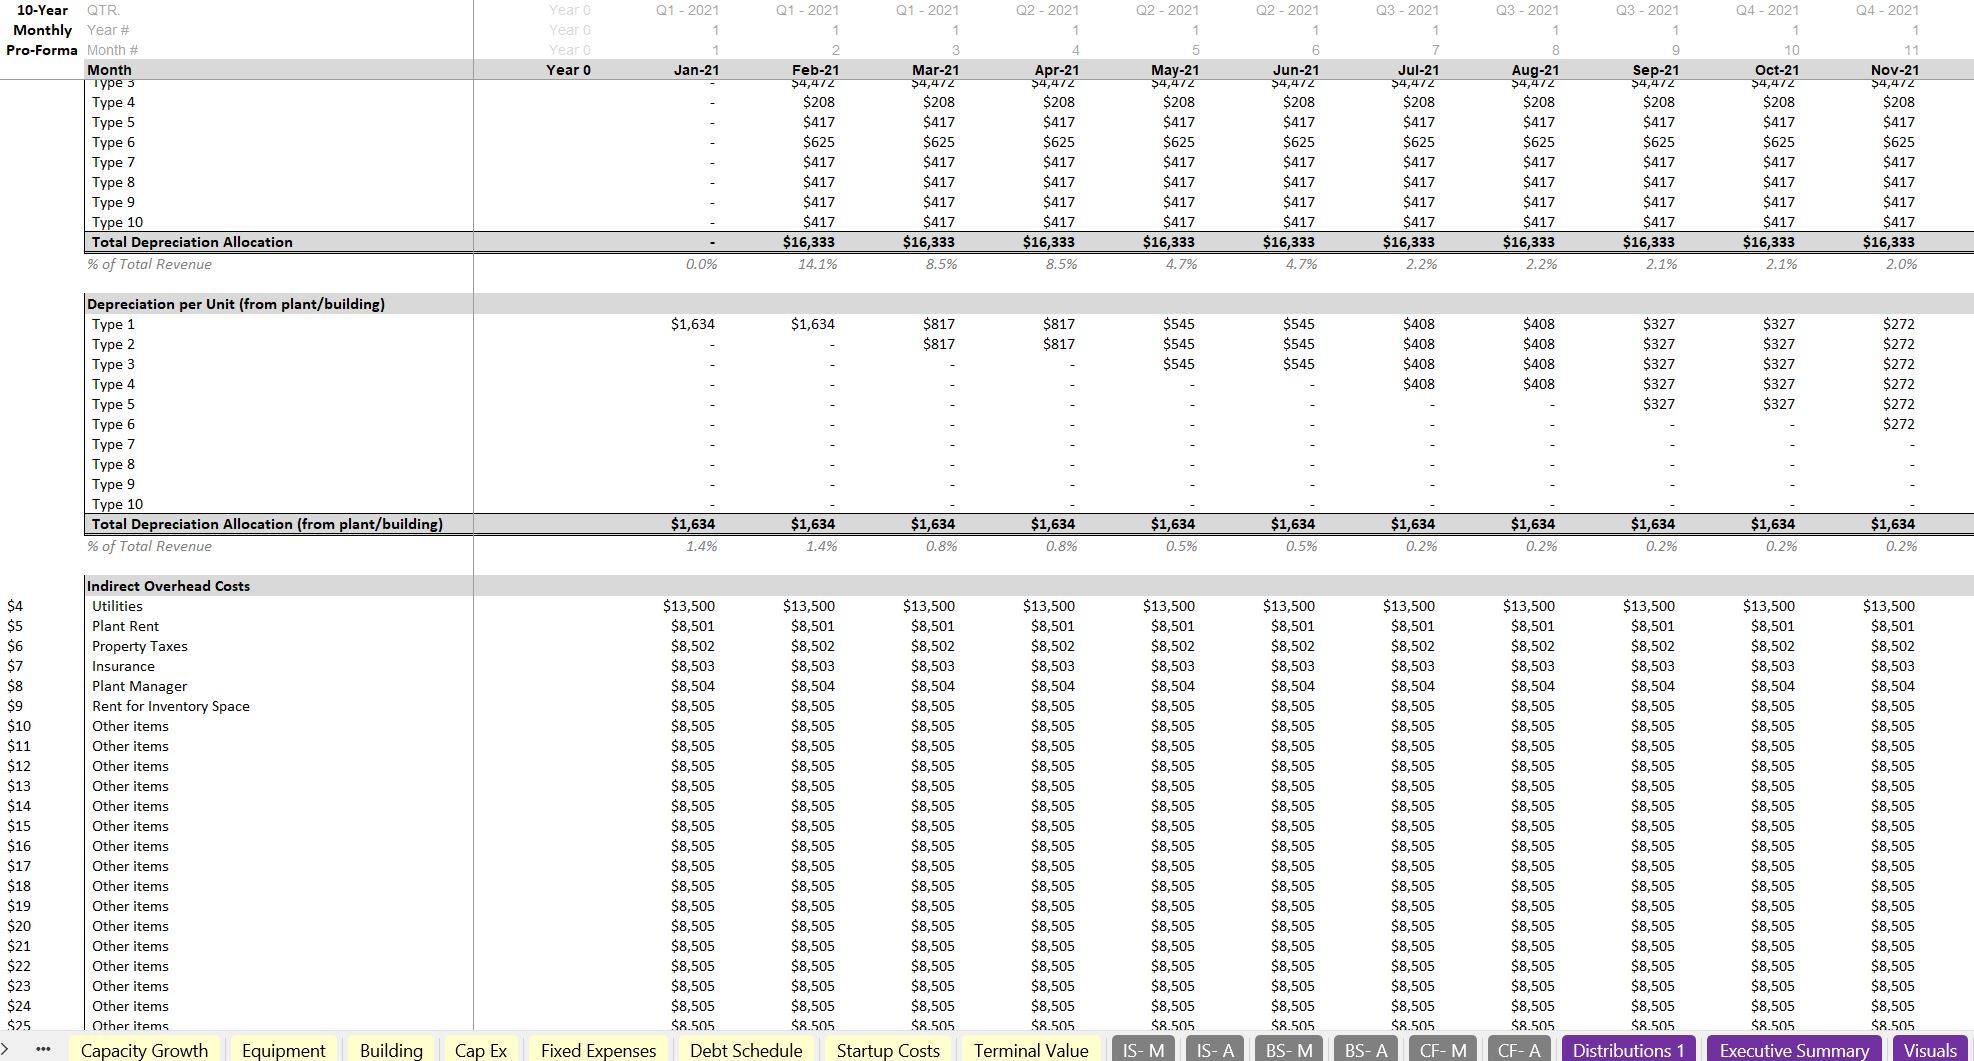
The last piece of cost of goods sold would be the depreciation from the plant itself (if it is not being rented out) and any fixed expenses (overheads) directly related to production i.e. utilities for the plant, plant manager, property taxes, and rent if the plant was not purchased as well as anything else that can be directly attributed to production. These items are all assigned an even portion of cost for all the widgets in production.
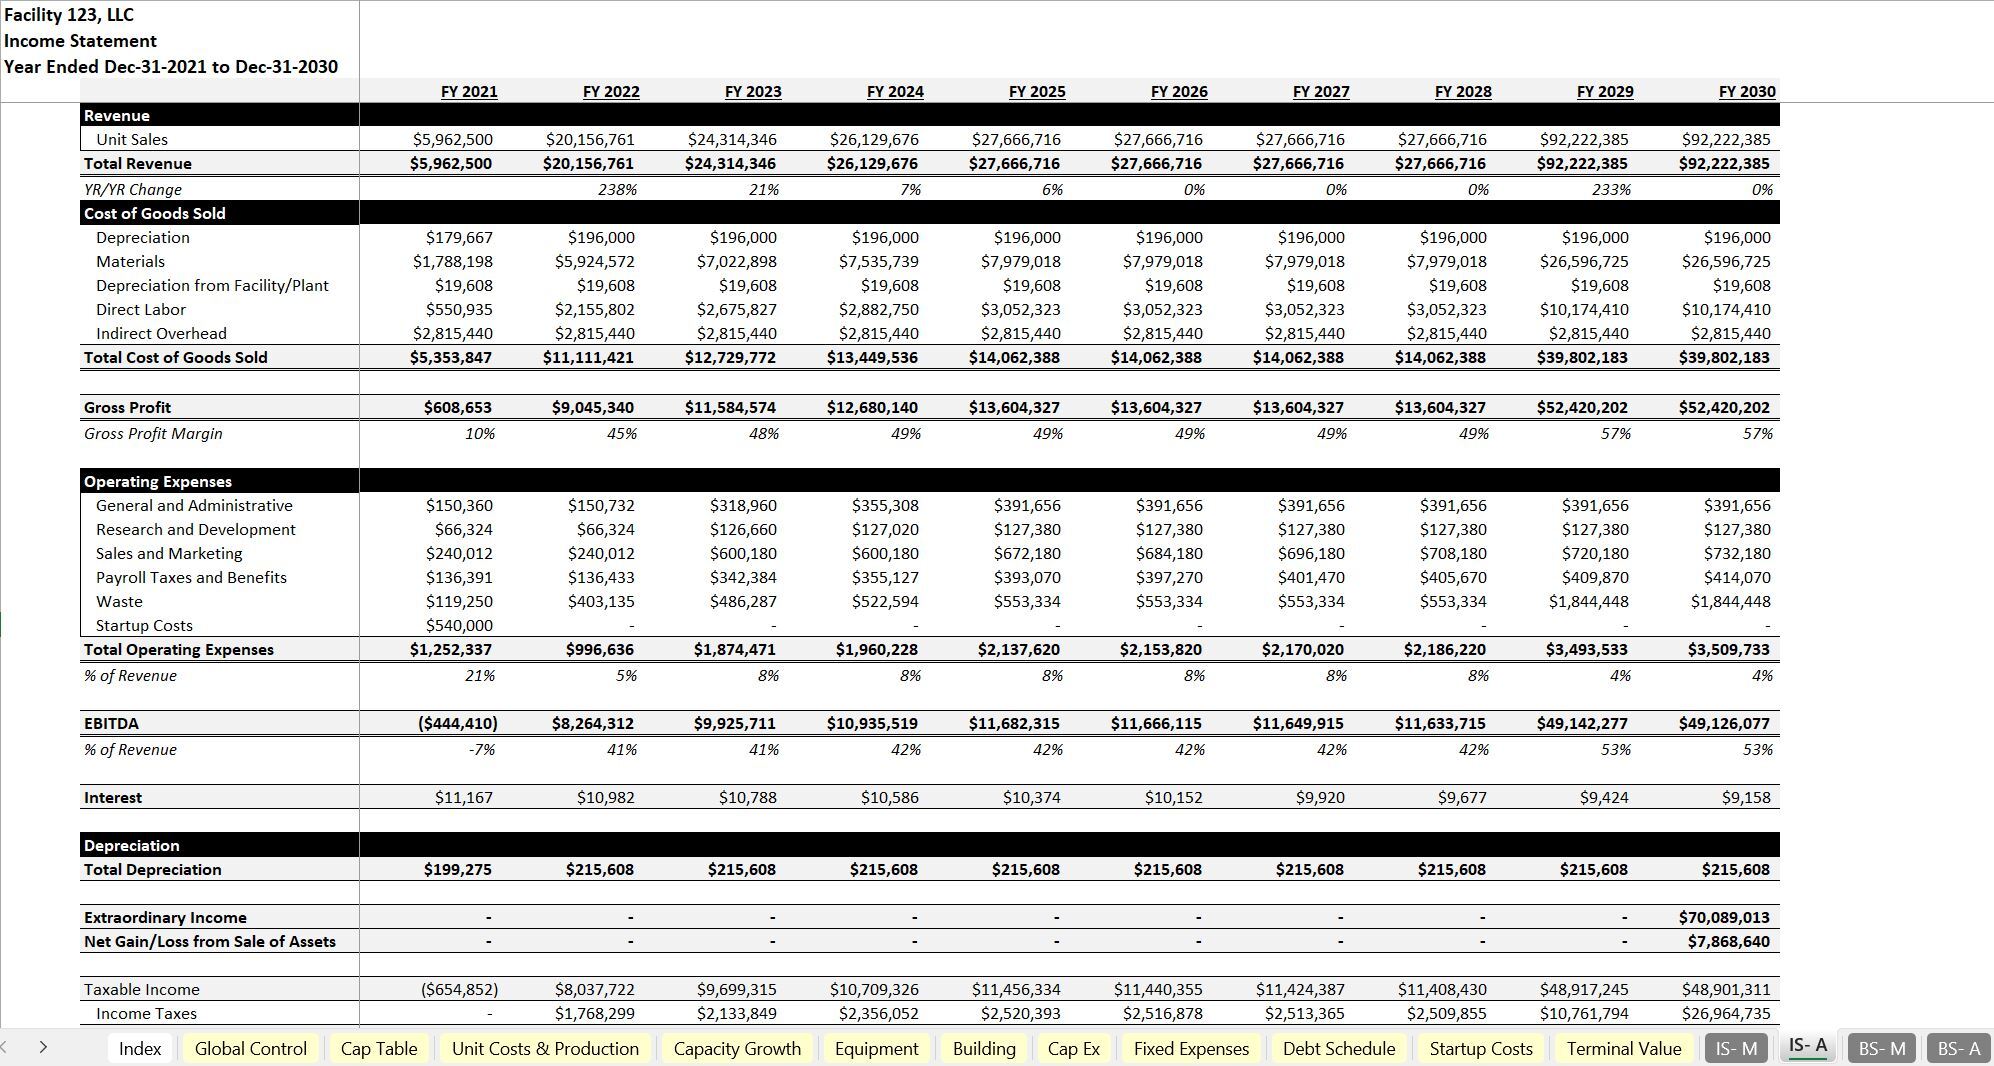
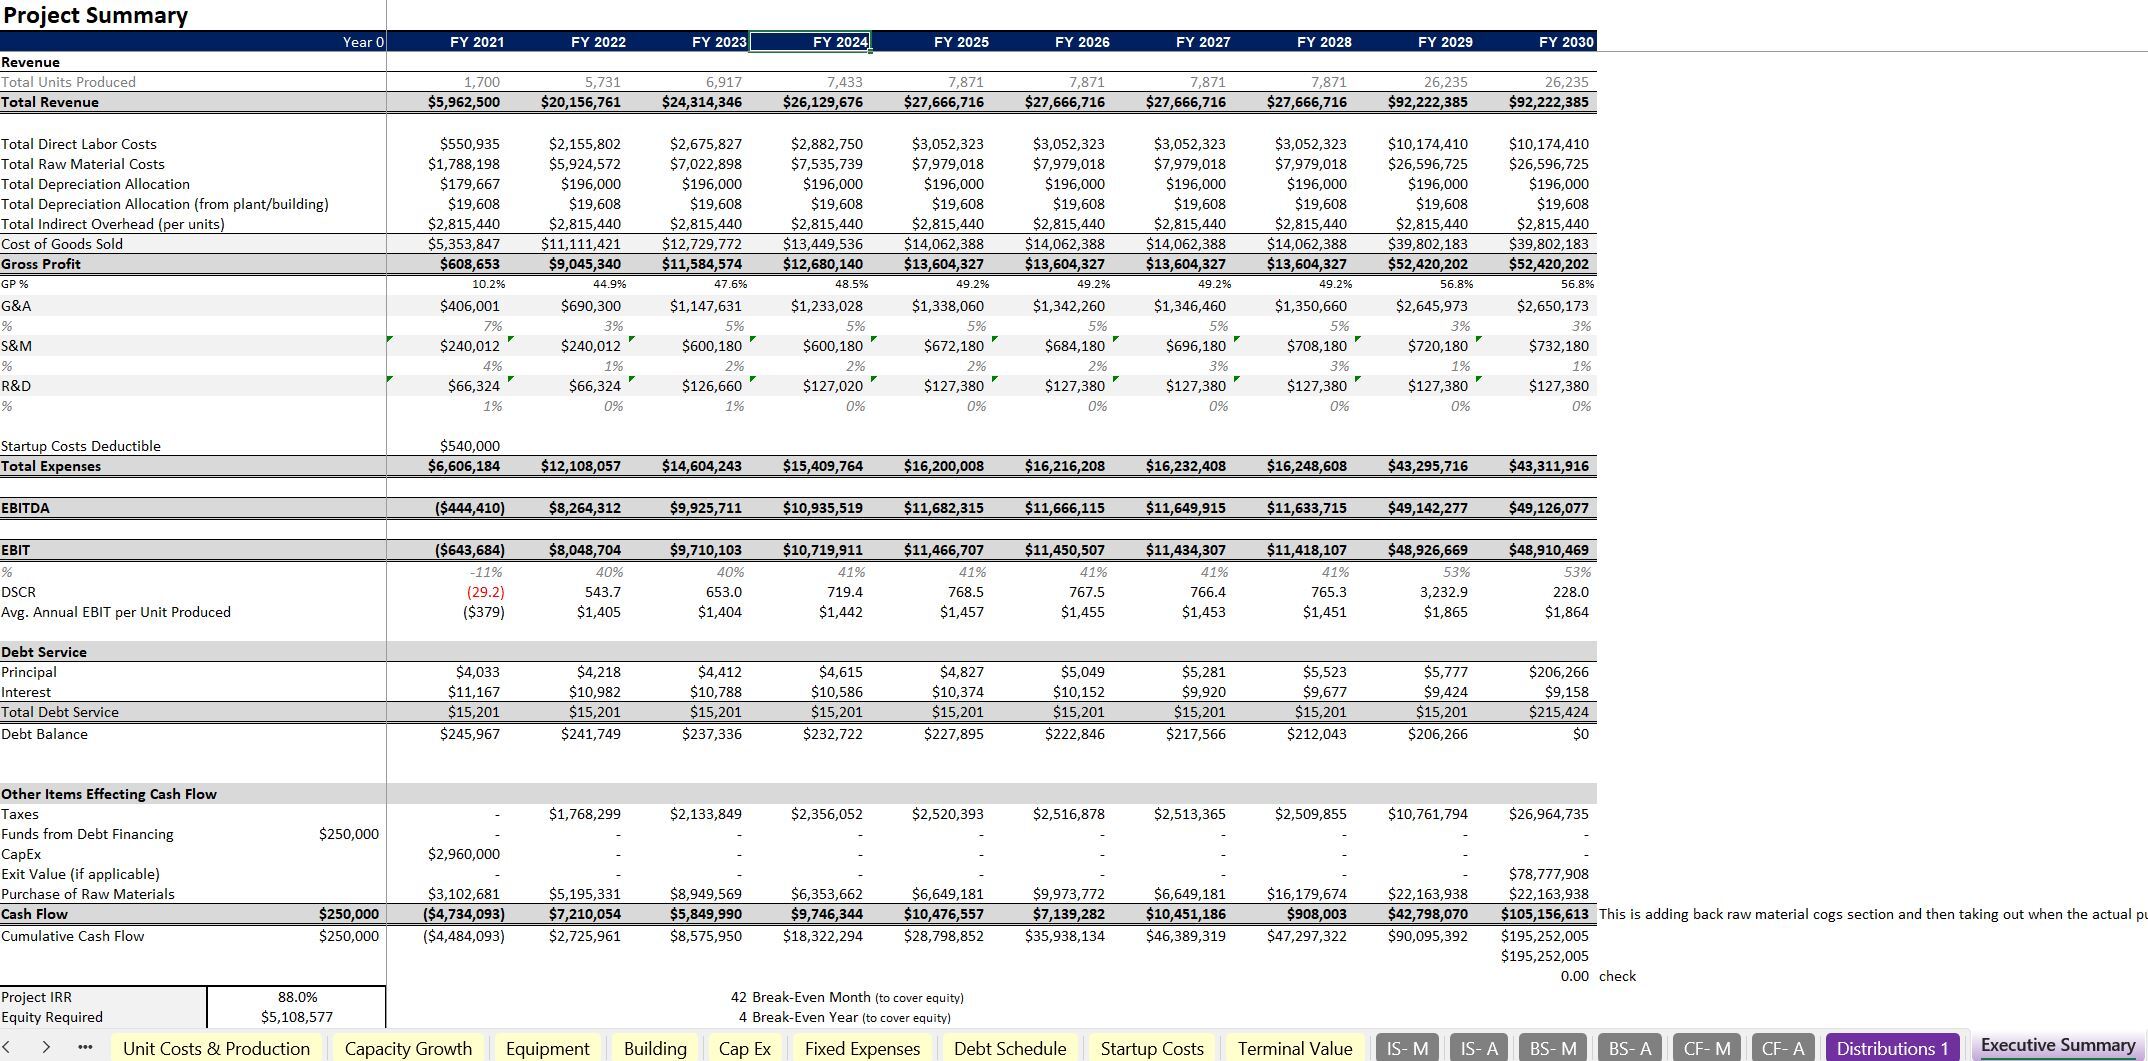
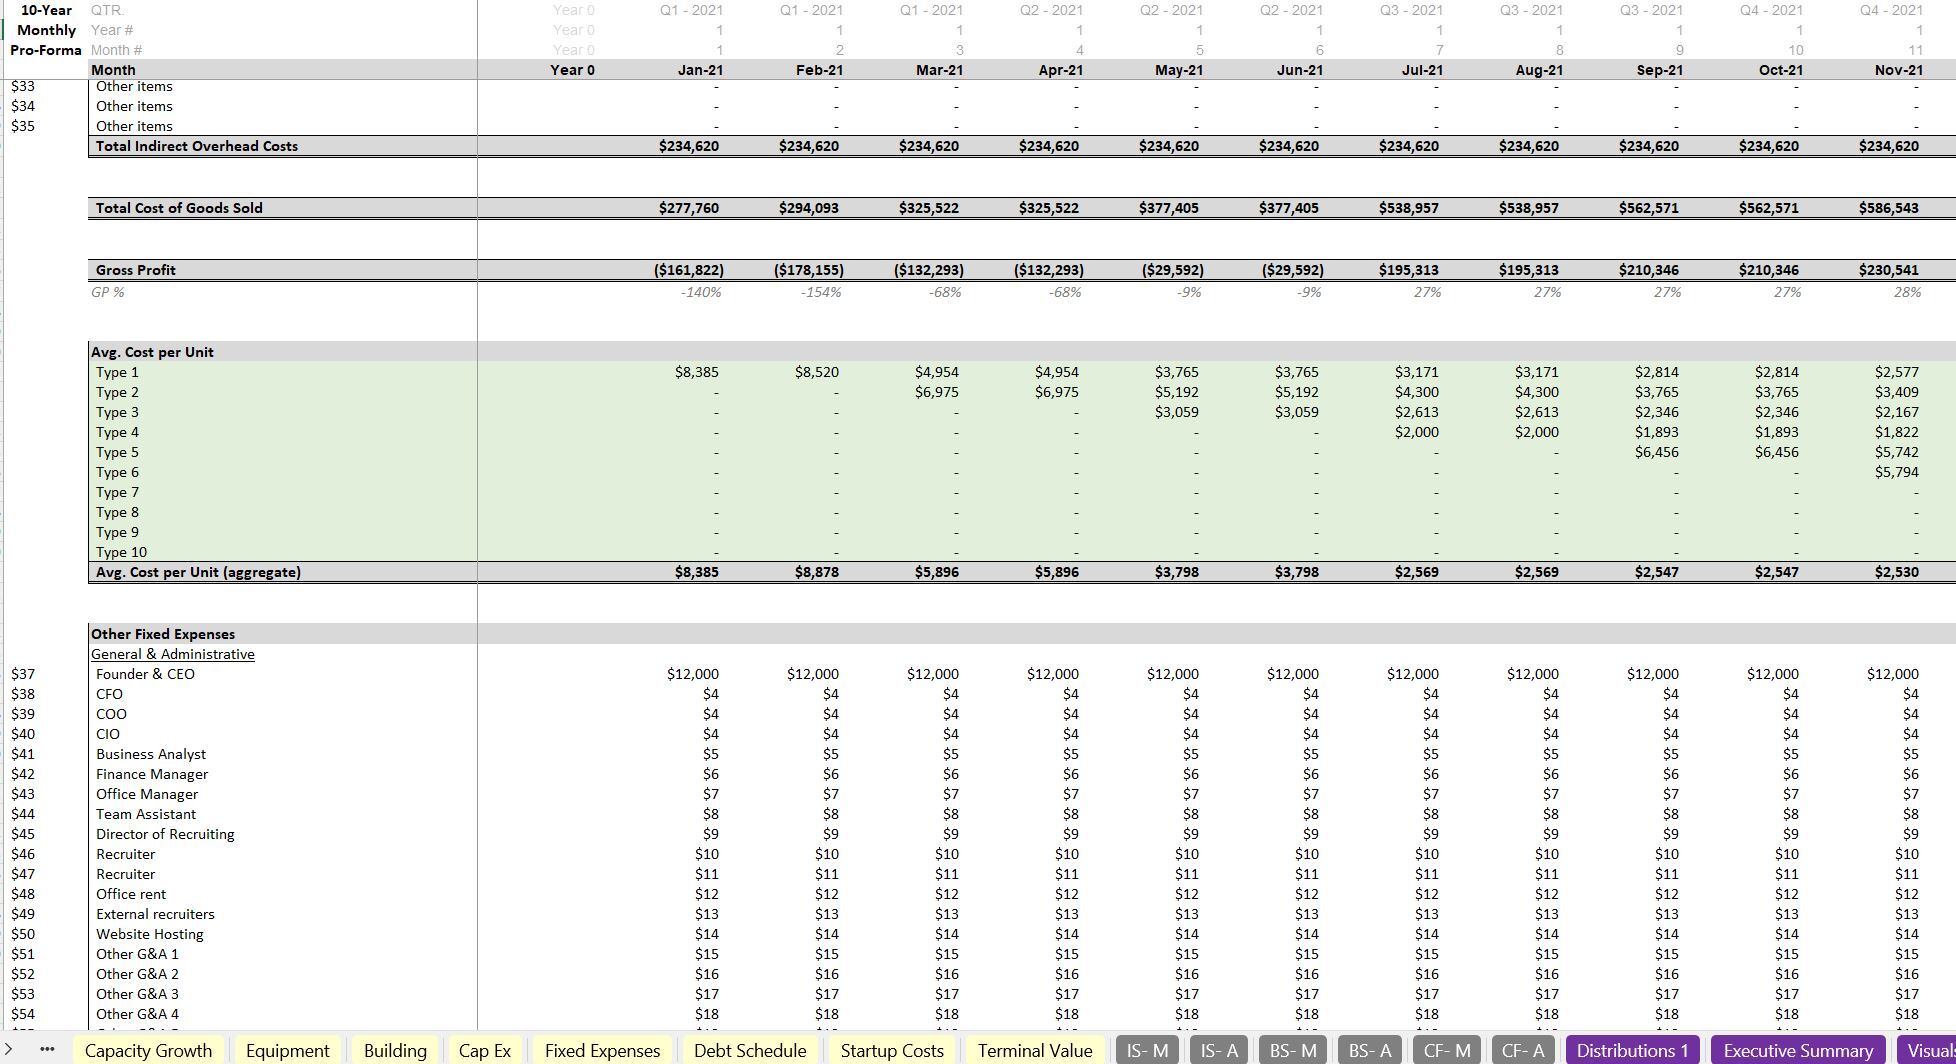
It is important to understand an accurate cost of goods sold within a manufacturing plant because it informs the potential selling prices for each of the different types of widgets being produced.
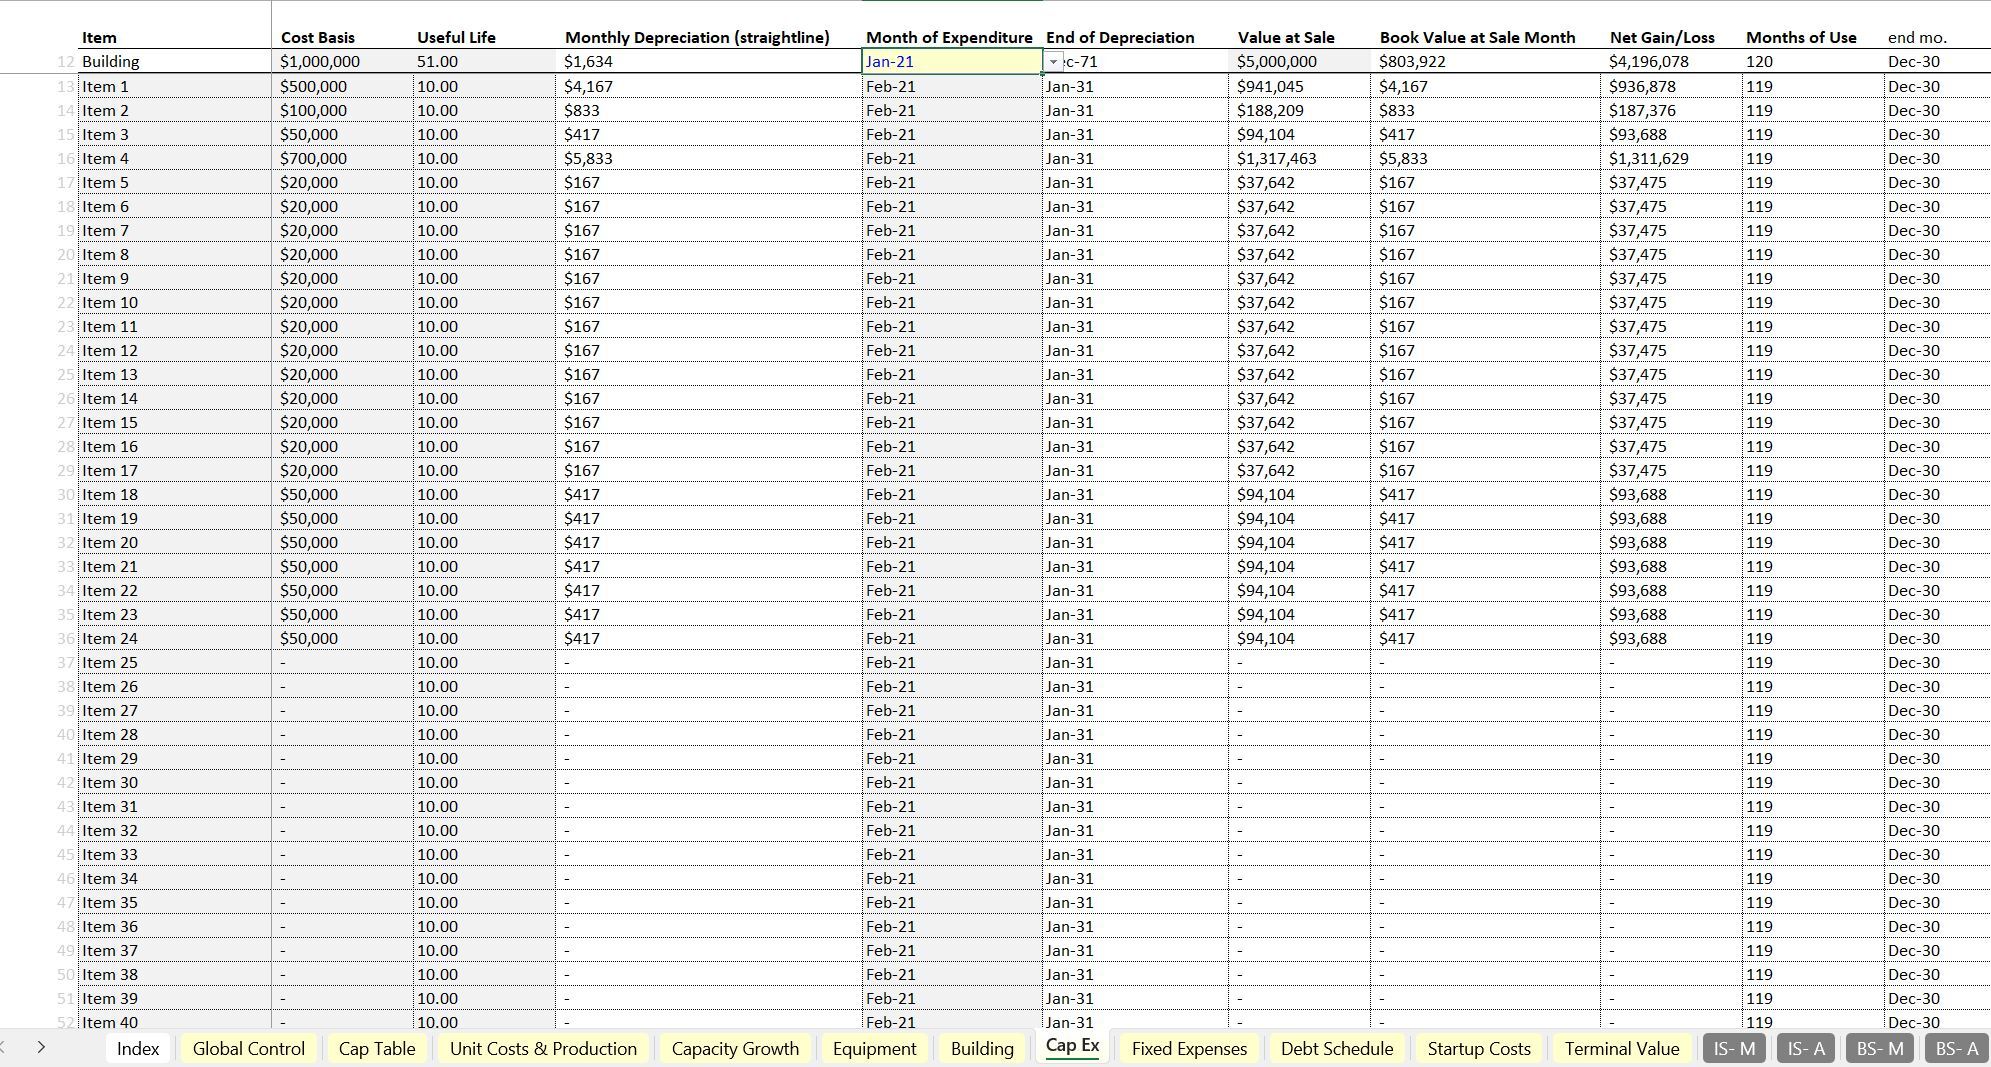
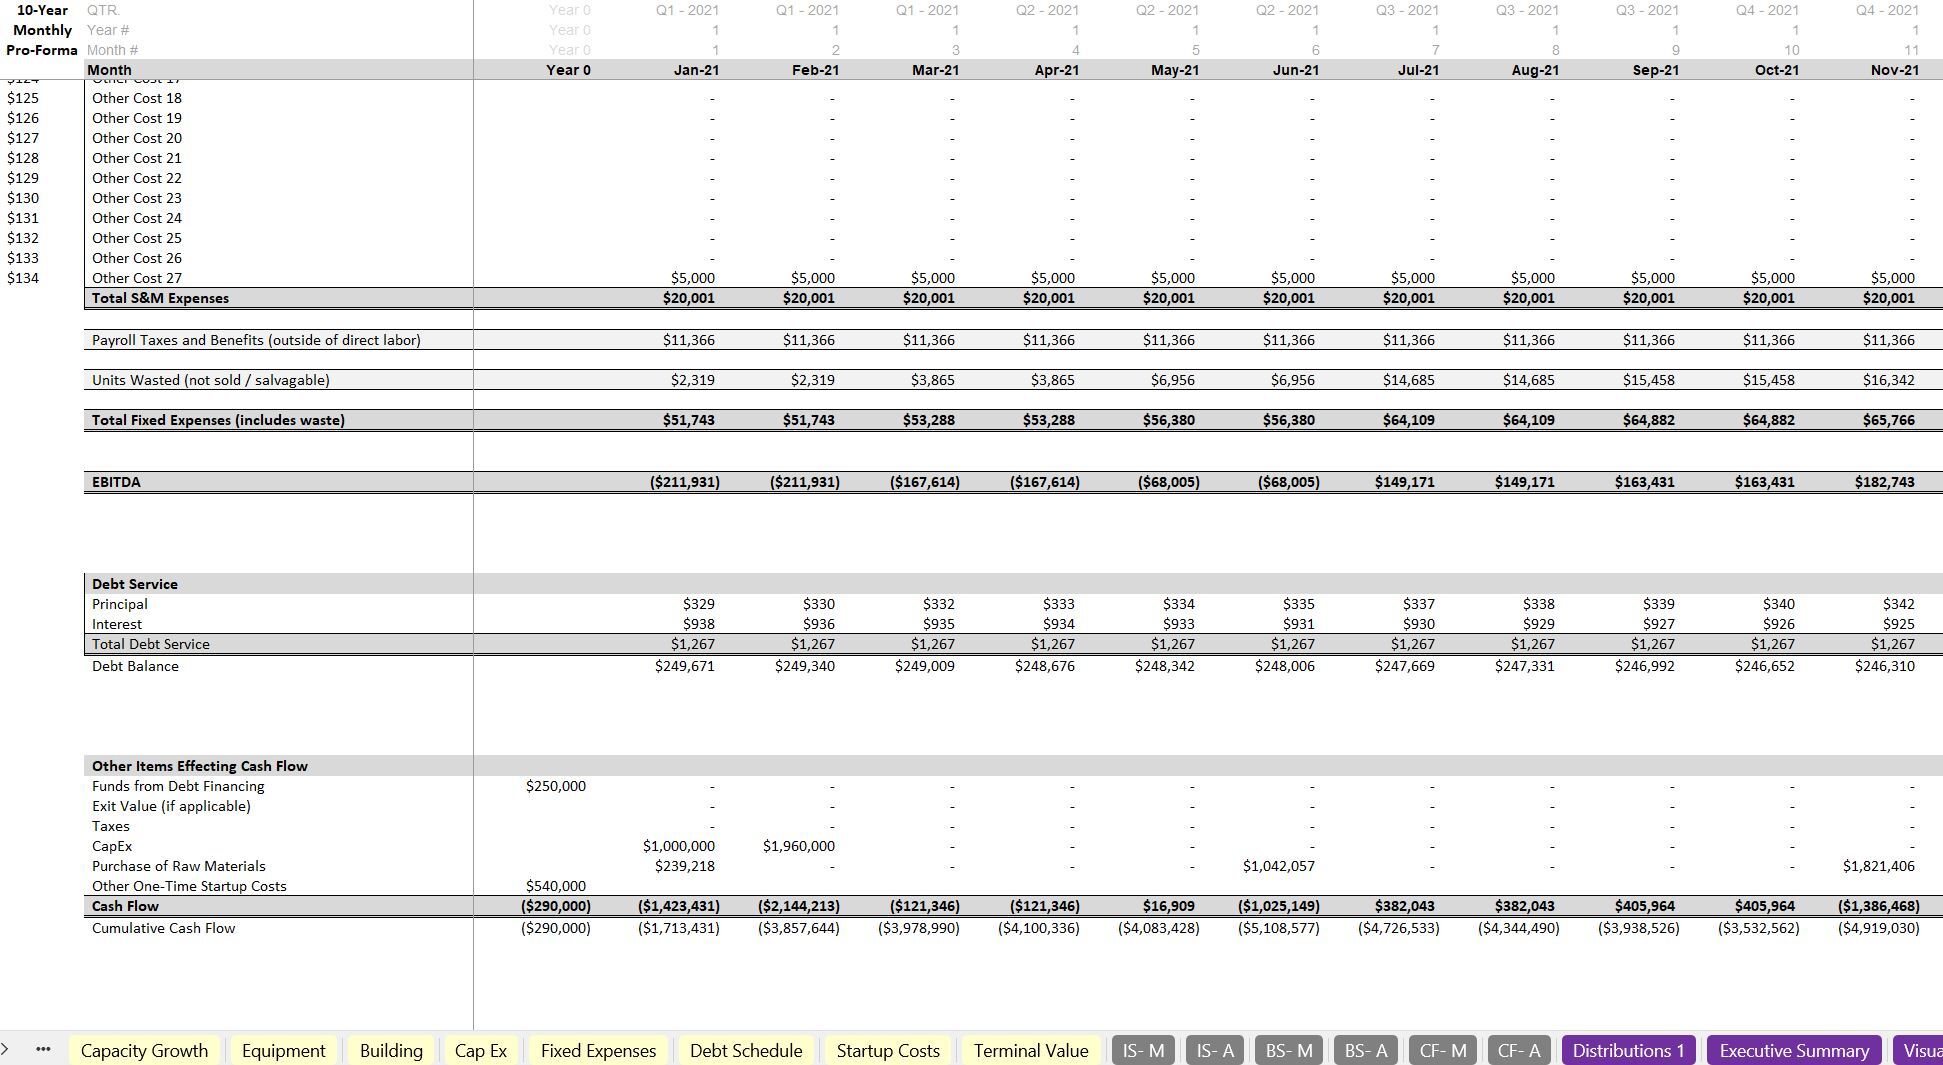
This is one of the only types of business that actually have depreciation as one of the items ahead of contribution margin (gross profit) so when you get down to EBITDA, you are adding that back as it is a non-cash item. It is also why the next line item is so important (EBIT). EBIT is a better reflection of activities since depreciation plays such a big role in figuring out the operations' feasibility. For that reason, the exit value (if chosen to have an exit) is configurable as a multiple of EBIT rather than EBITDA. Also, all equipment purchases are tracked over time and the user can choose to have the depreciated value of the fixed assets count toward exit proceeds or not (yes/no box).
One of the more complicated aspects of this model is assigning equipment costs to the different widget types. I felt it was necessary to give this flexibility. The way it works is you can define the % of a given piece of equipment that is attributed to each widget type. So, when depreciation gets attributed to each type for equipment, it does so based on those percentages.
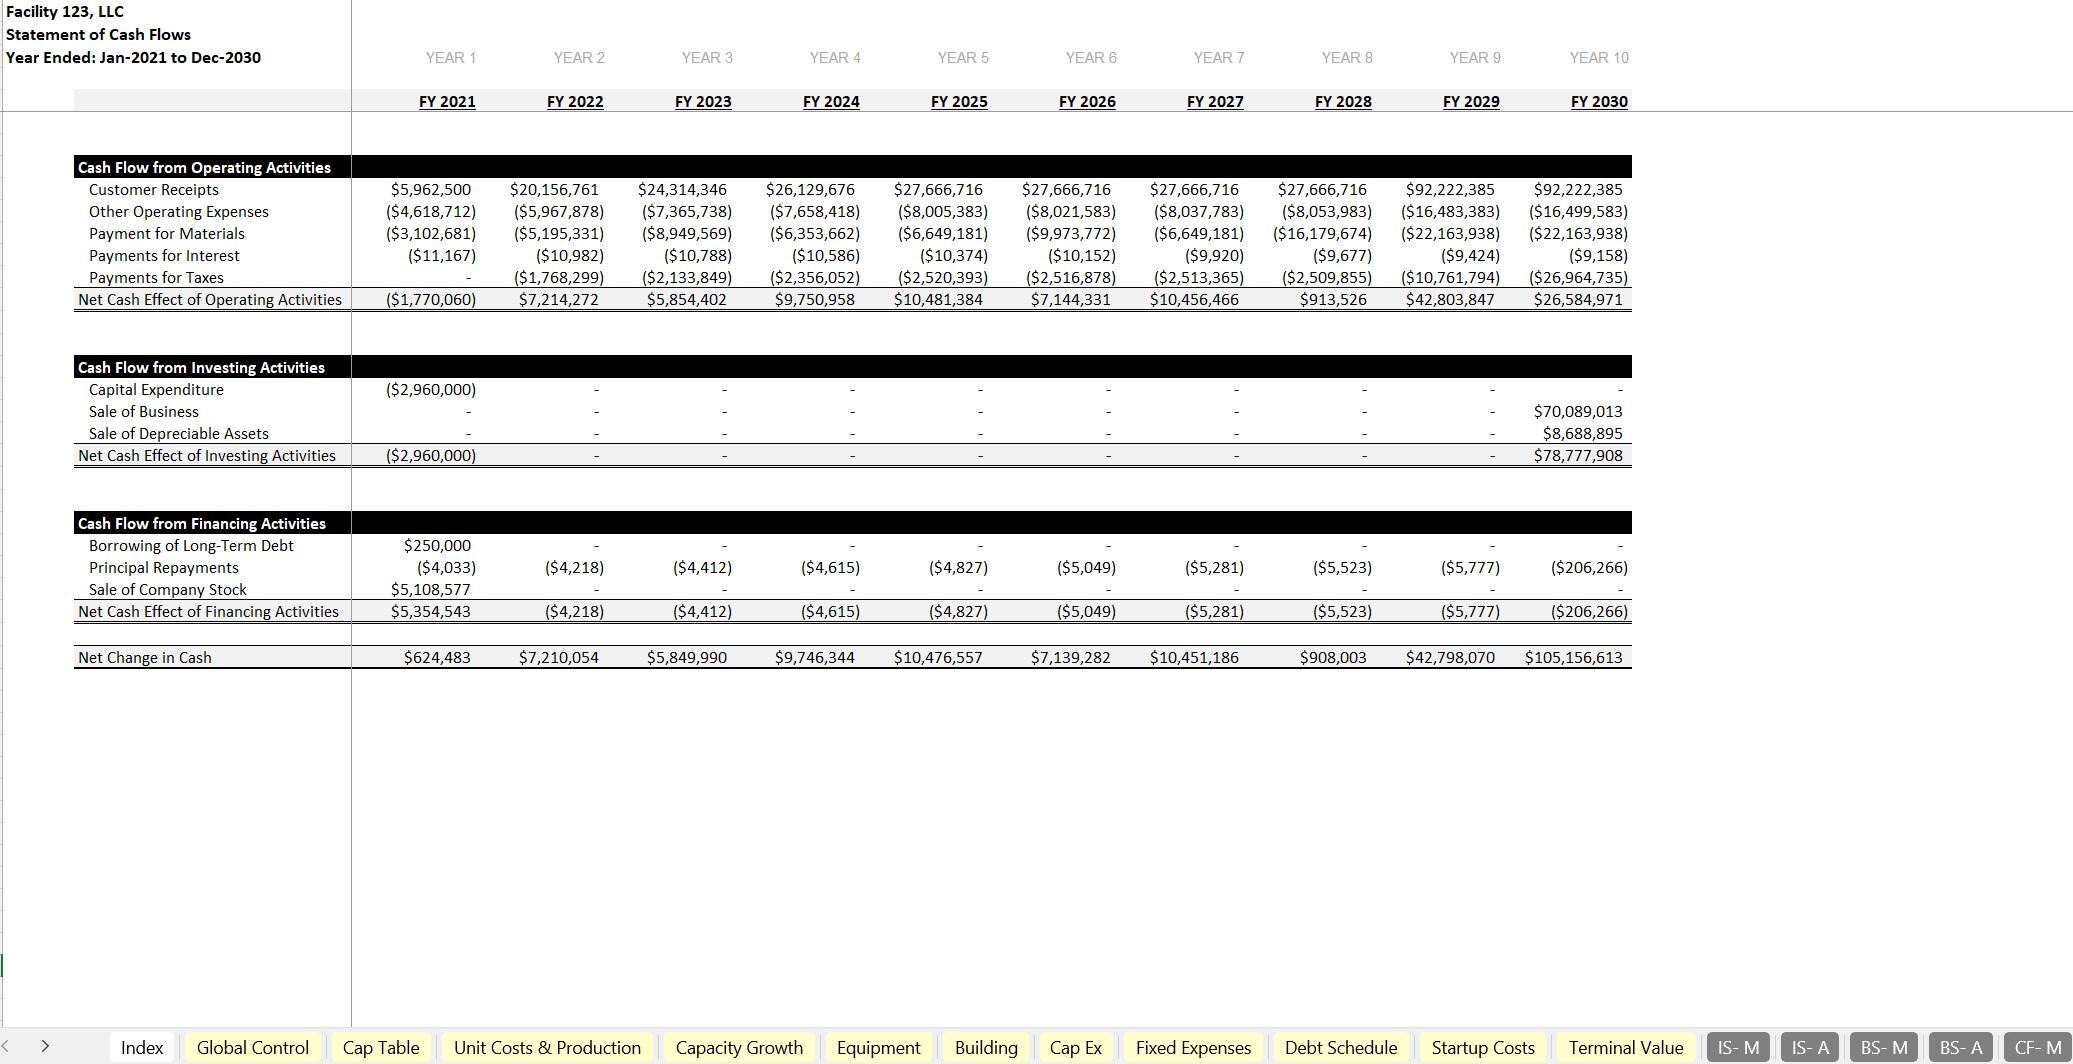
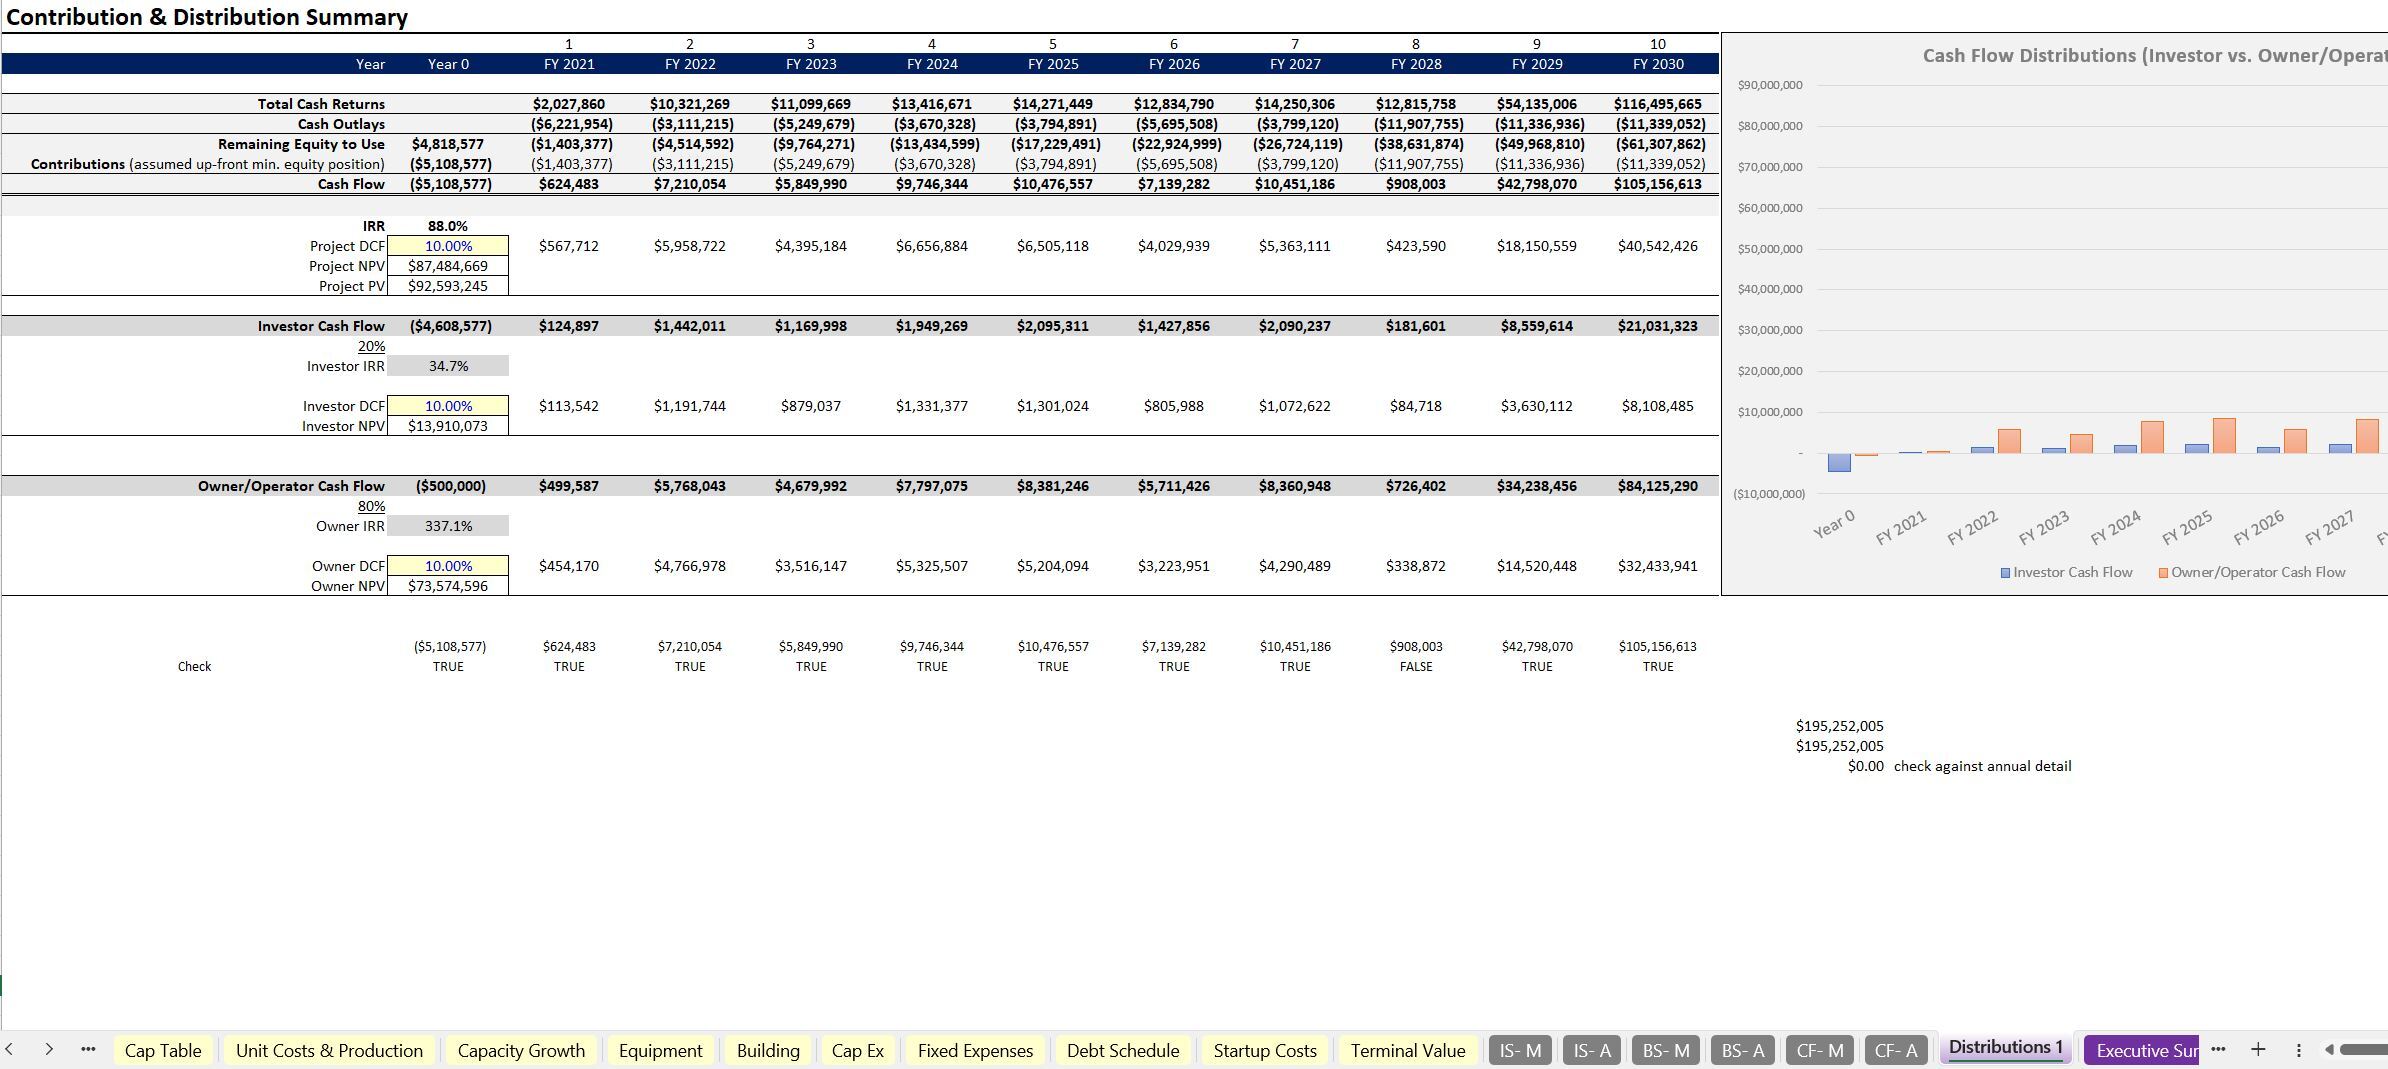
There is a schedule for raw materials purchases so that the user can see the real effect of cash flow over time (since it is possible the expected raw materials used are likely to be bought before the month they are assigned as a cost). This model drills all the way down to earnings after taxes and distributed cash flow in order to calculate distributions to investors (if applicable) and the owner / operator. The user defines the % that investors receive from their contributions. There is a resulting IRR, DCF analysis, and ROI result based on all of the above.
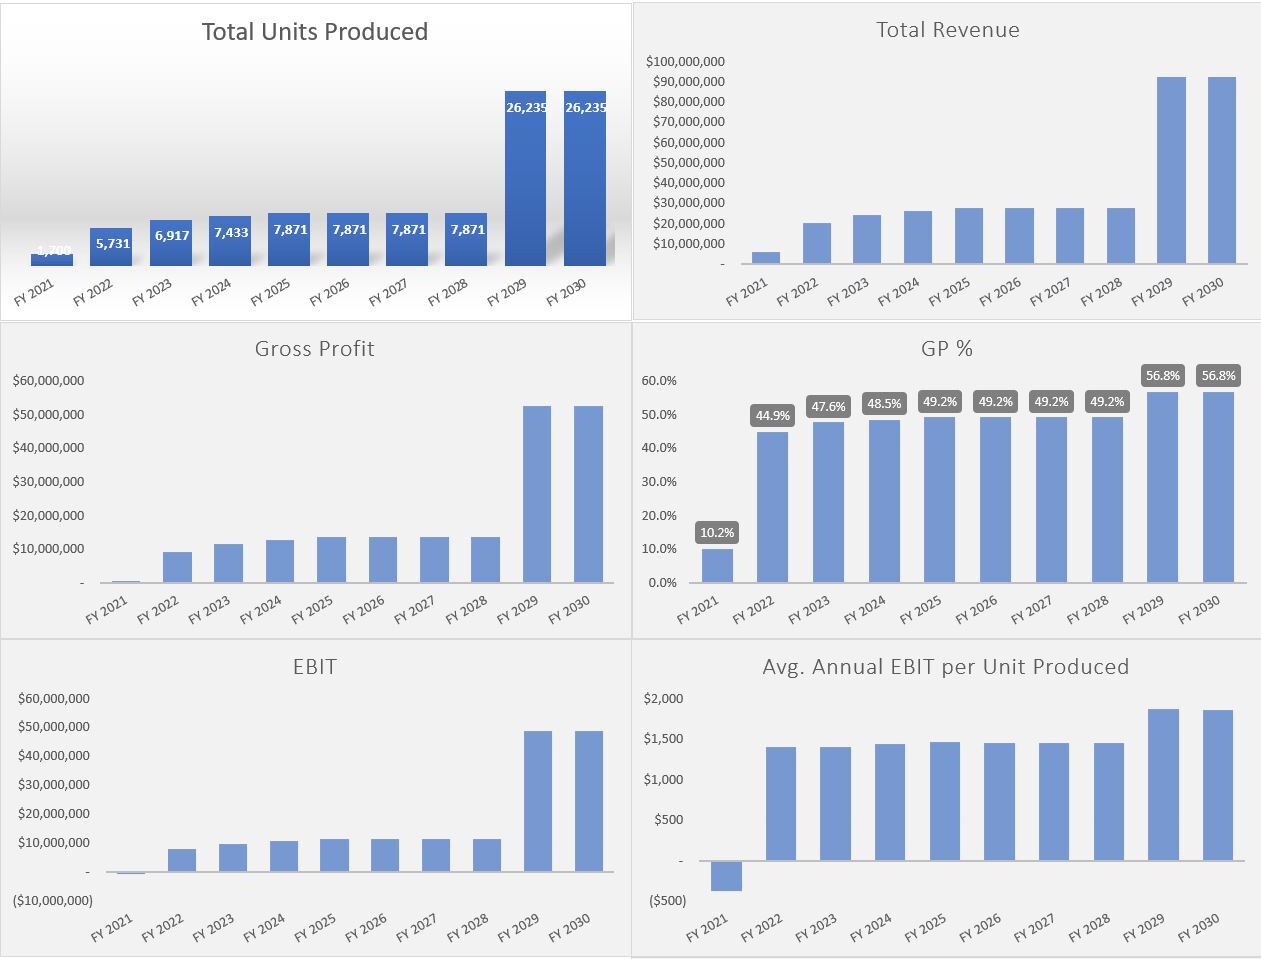
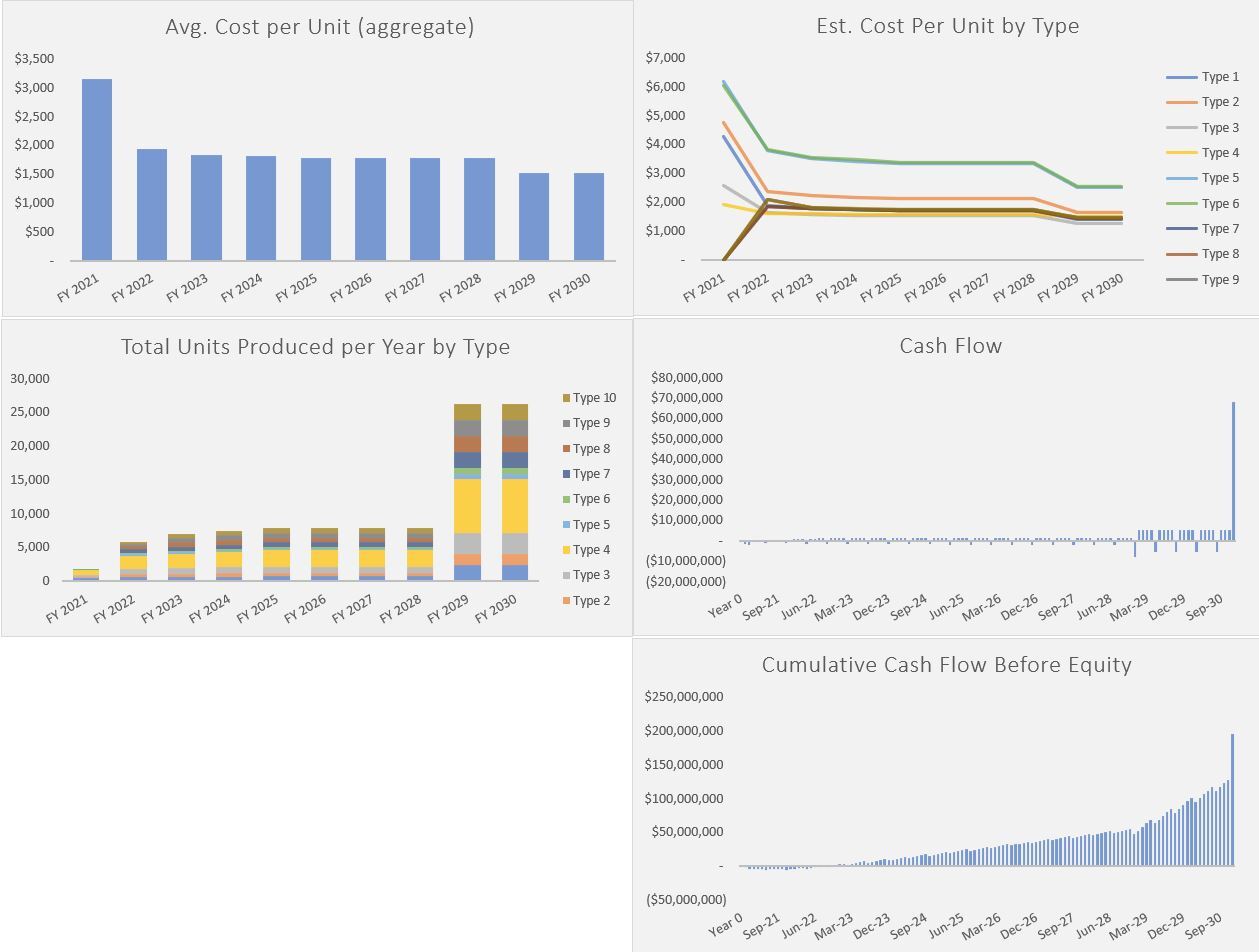
I put in a wide range of financial charts/visuals so the production performance and financial performance can be easily summarized.
This template is also included in two bundles:
- All Models Bundle: https://www.eloquens.com/tool/P8Y4TX4v/finance/financial-forecasting-models/financial-models-120-useful-and-usable-logic
- Industry-Specific Financial Models Bundle: https://www.eloquens.com/tool/lrNGt2jL/strategy/business-plans/business-sector-bundle-35-bottom-up-financial-models
Recent Update: Added a fully integrated 3-statement model (Income Statement, Balance Sheet, and Cash Flow Statement) and cap table.
This is a highly robust template that offers a 10-year monthly and annual forecast. It is driven by a wide range of key assumptions directly related to the operations of a manufacturing plant.
This kind of business has a few different unique aspects to it that pose challenging dilemmas when trying to build proper levers and variables.
The biggest challenge is correctly assigning costs to each unit type. This model has the ability to drive production based on up to 10 different types of widgets and over 80 different slots for equipment types. The month that each widget type goes into production can be variable as well as when equipment is put into service. The resulting depreciation is dynamically assigned to widgets over time.
The other primary components include a bottoms up build out of direct labor costs per widget type as well as raw material costs. The user can define the max production (# of units produced per day, working days per year) as well as max direct labor costs per number of laborers required, their hours per day, and their average hourly rate. This is all configurable for each of the 10 widget types. There are capacity percentages to input for each year to show how close to 'max production' a given type of widget achieves since it is not likely production starts at 100% capacity in year 1.
The last piece of cost of goods sold would be the depreciation from the plant itself (if it is not being rented out) and any fixed expenses (overheads) directly related to production i.e. utilities for the plant, plant manager, property taxes, and rent if the plant was not purchased as well as anything else that can be directly attributed to production. These items are all assigned an even portion of cost for all the widgets in production.
It is important to understand an accurate cost of goods sold within a manufacturing plant because it informs the potential selling prices for each of the different types of widgets being produced.
This is one of the only types of business that actually have depreciation as one of the items ahead of contribution margin (gross profit) so when you get down to EBITDA, you are adding that back as it is a non-cash item. It is also why the next line item is so important (EBIT). EBIT is a better reflection of activities since depreciation plays such a big role in figuring out the operations' feasibility. For that reason, the exit value (if chosen to have an exit) is configurable as a multiple of EBIT rather than EBITDA. Also, all equipment purchases are tracked over time and the user can choose to have the depreciated value of the fixed assets count toward exit proceeds or not (yes/no box).
One of the more complicated aspects of this model is assigning equipment costs to the different widget types. I felt it was necessary to give this flexibility. The way it works is you can define the % of a given piece of equipment that is attributed to each widget type. So, when depreciation gets attributed to each type for equipment, it does so based on those percentages.
There is a schedule for raw materials purchases so that the user can see the real effect of cash flow over time (since it is possible the expected raw materials used are likely to be bought before the month they are assigned as a cost). This model drills all the way down to earnings after taxes and distributed cash flow in order to calculate distributions to investors (if applicable) and the owner / operator. The user defines the % that investors receive from their contributions. There is a resulting IRR, DCF analysis, and ROI result based on all of the above.
I put in a wide range of financial charts/visuals so the production performance and financial performance can be easily summarized.
This template is also included in two bundles:
- All Models Bundle: https://www.eloquens.com/tool/P8Y4TX4v/finance/financial-forecasting-models/financial-models-120-useful-and-usable-logic
- Industry-Specific Financial Models Bundle: https://www.eloquens.com/tool/lrNGt2jL/strategy/business-plans/business-sector-bundle-35-bottom-up-financial-models
This Best Practice includes
1 Excel template and 1 tutorial video
Further information
Provide proper assumptions and logic to forecast the financial results of operating a manufacturing plant.
Running an actual manufacturing plant with equipment, overheads, and staff.
N/A
