
Originally published: 05/03/2018 08:38
Last version published: 18/12/2023 08:27
Publication number: ELQ-18278-11
View all versions & Certificate
Last version published: 18/12/2023 08:27
Publication number: ELQ-18278-11
View all versions & Certificate

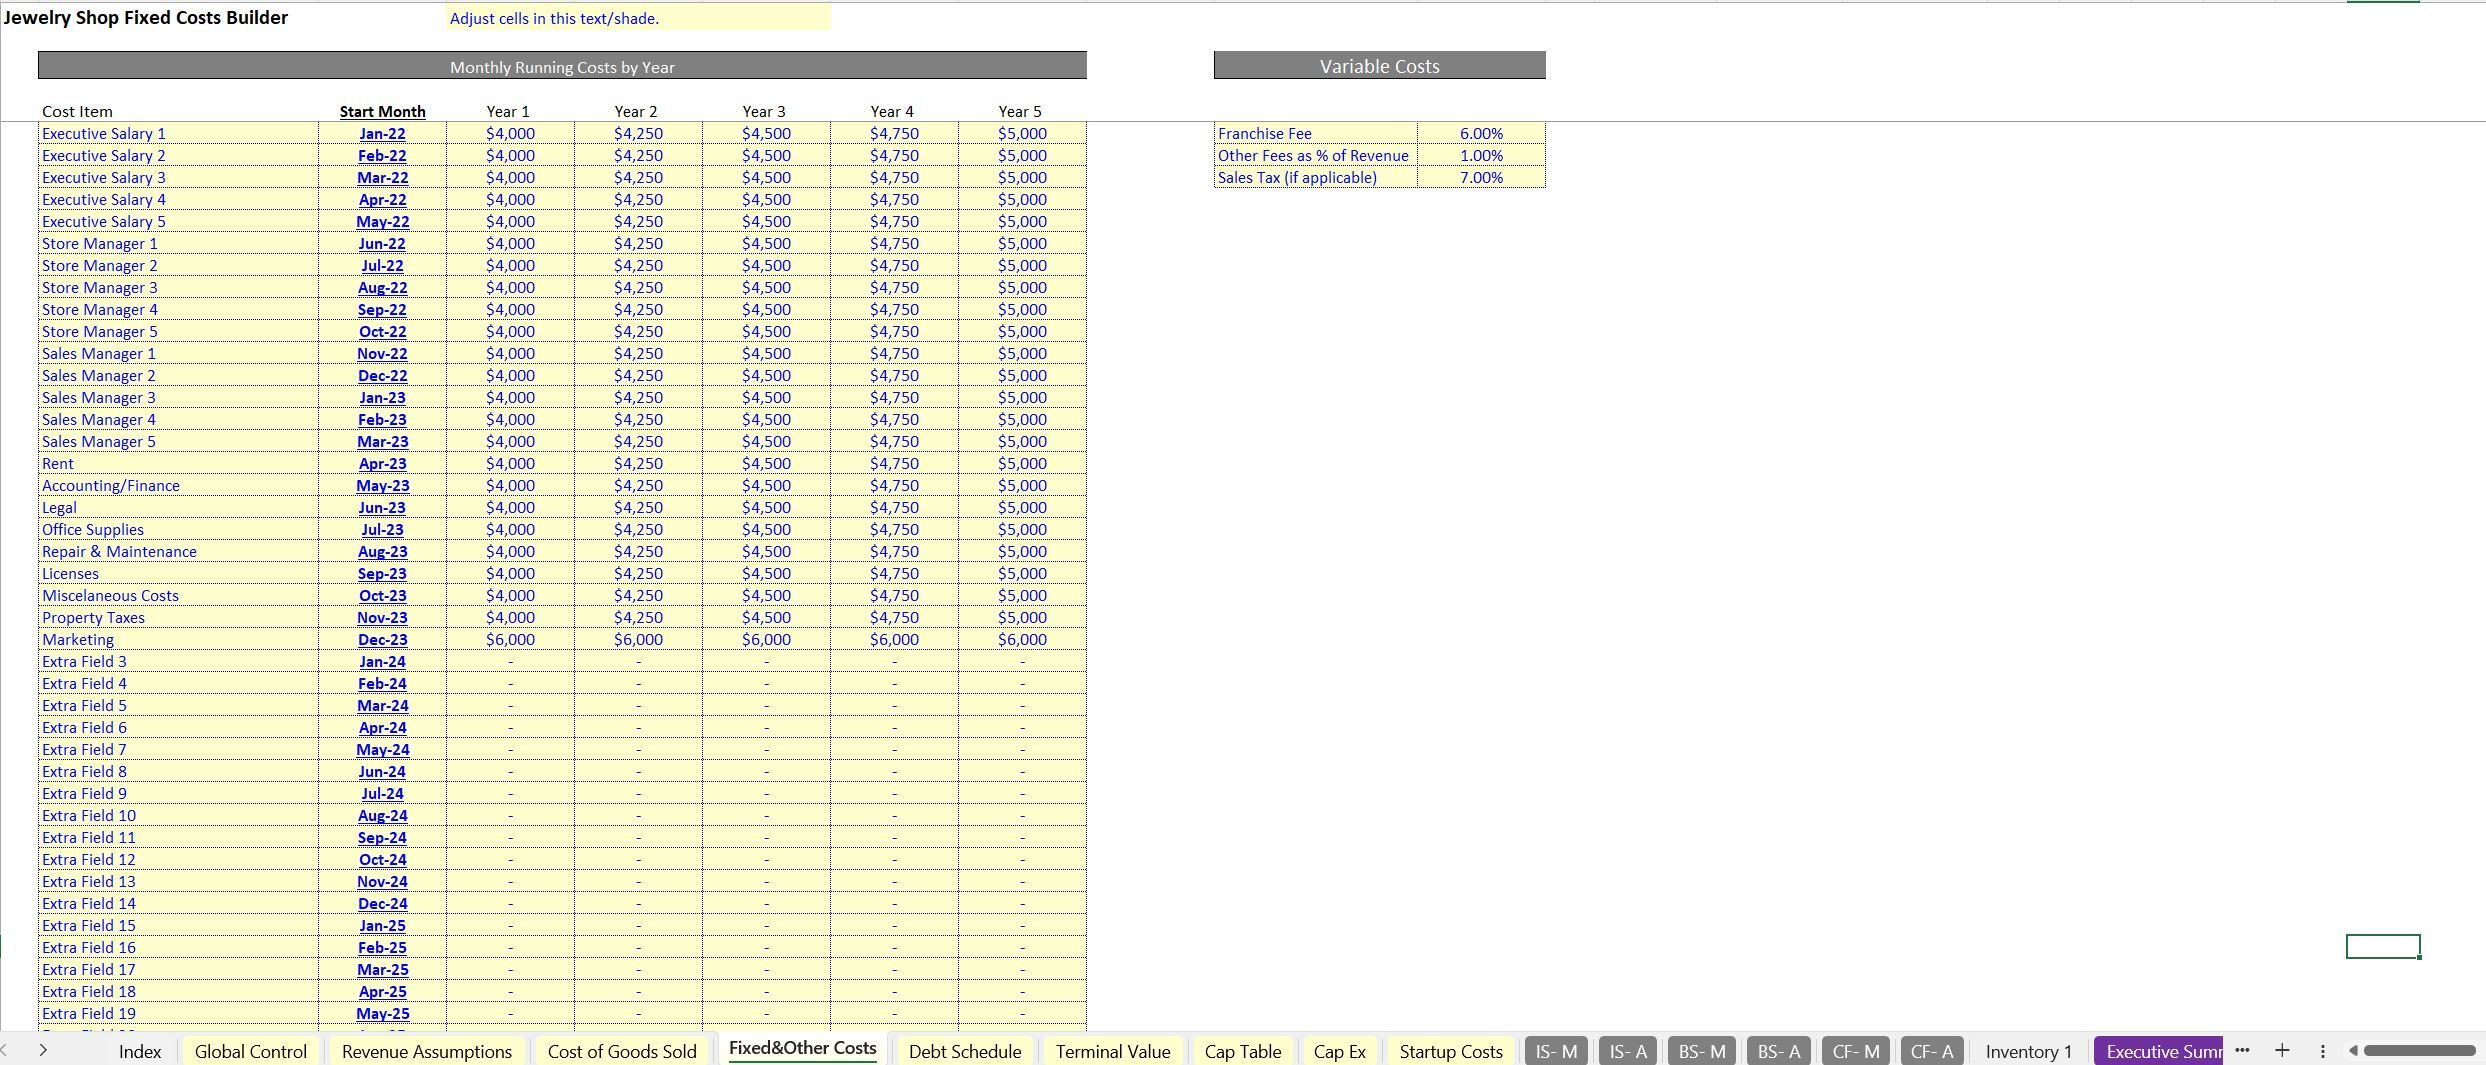
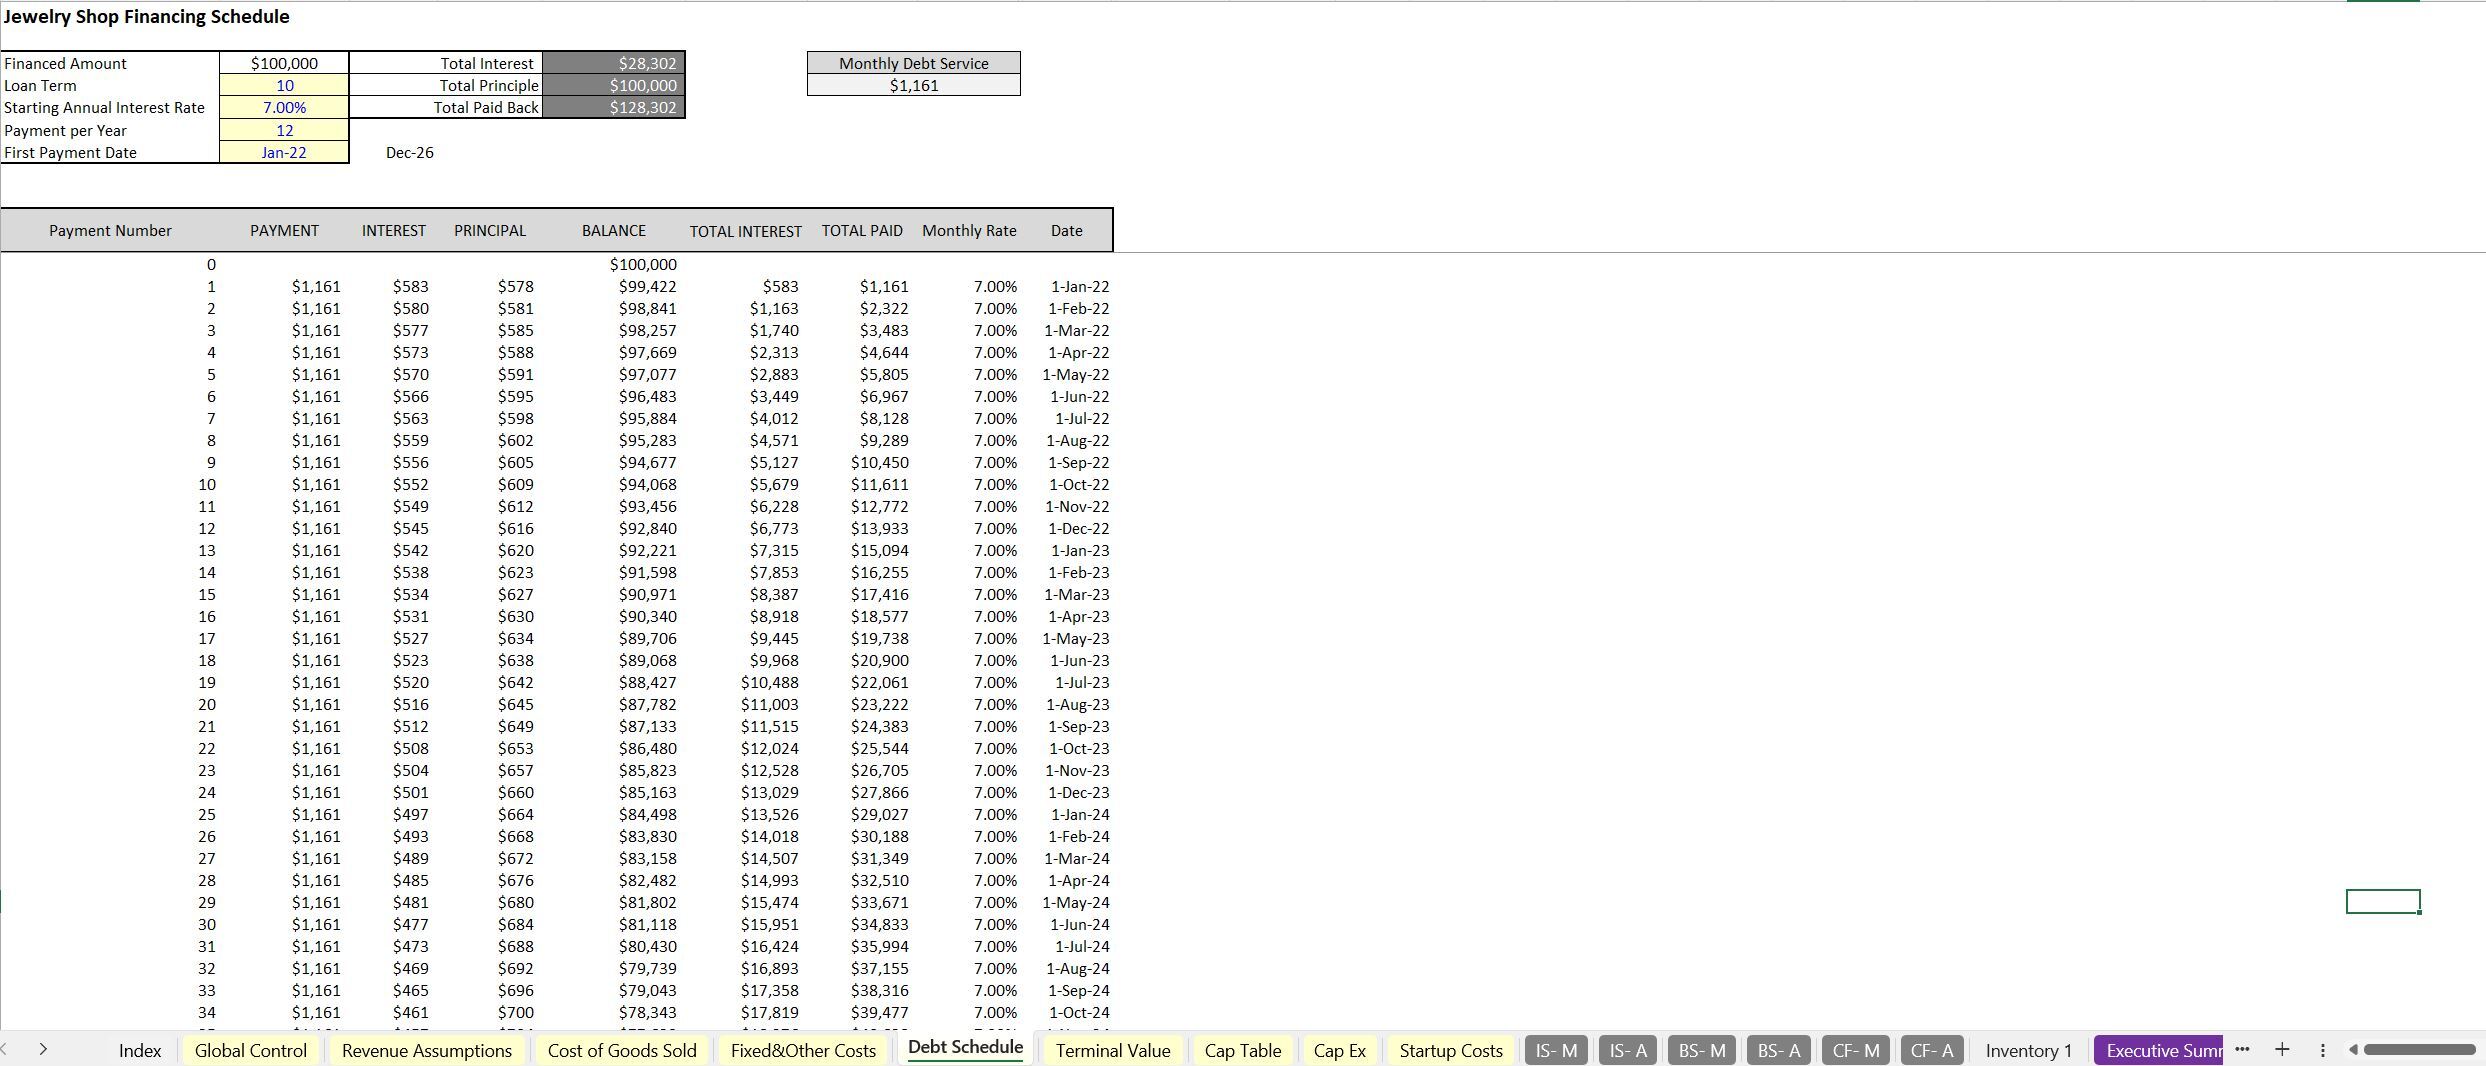
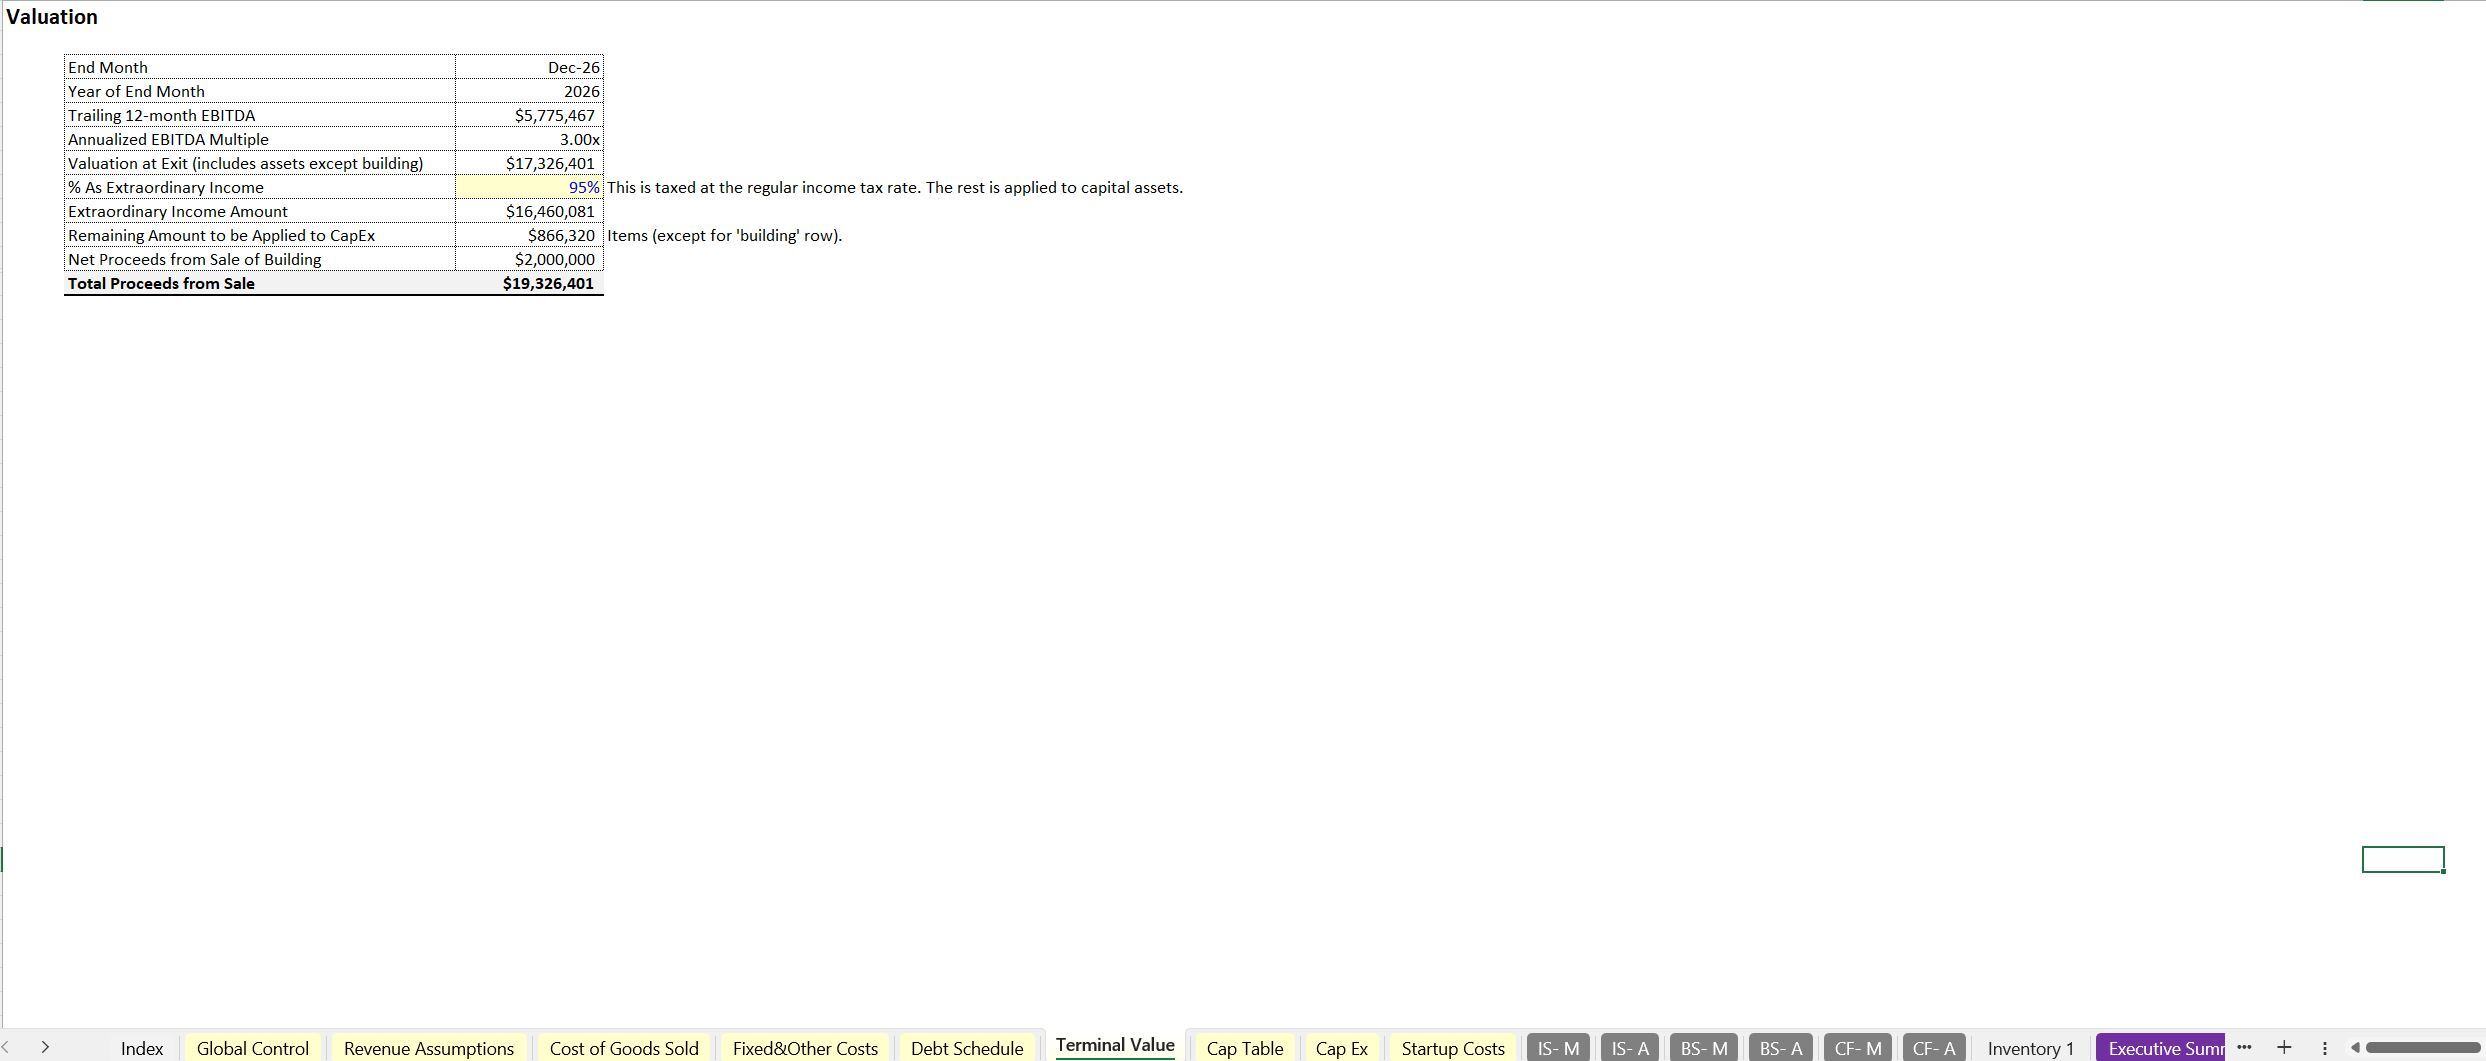
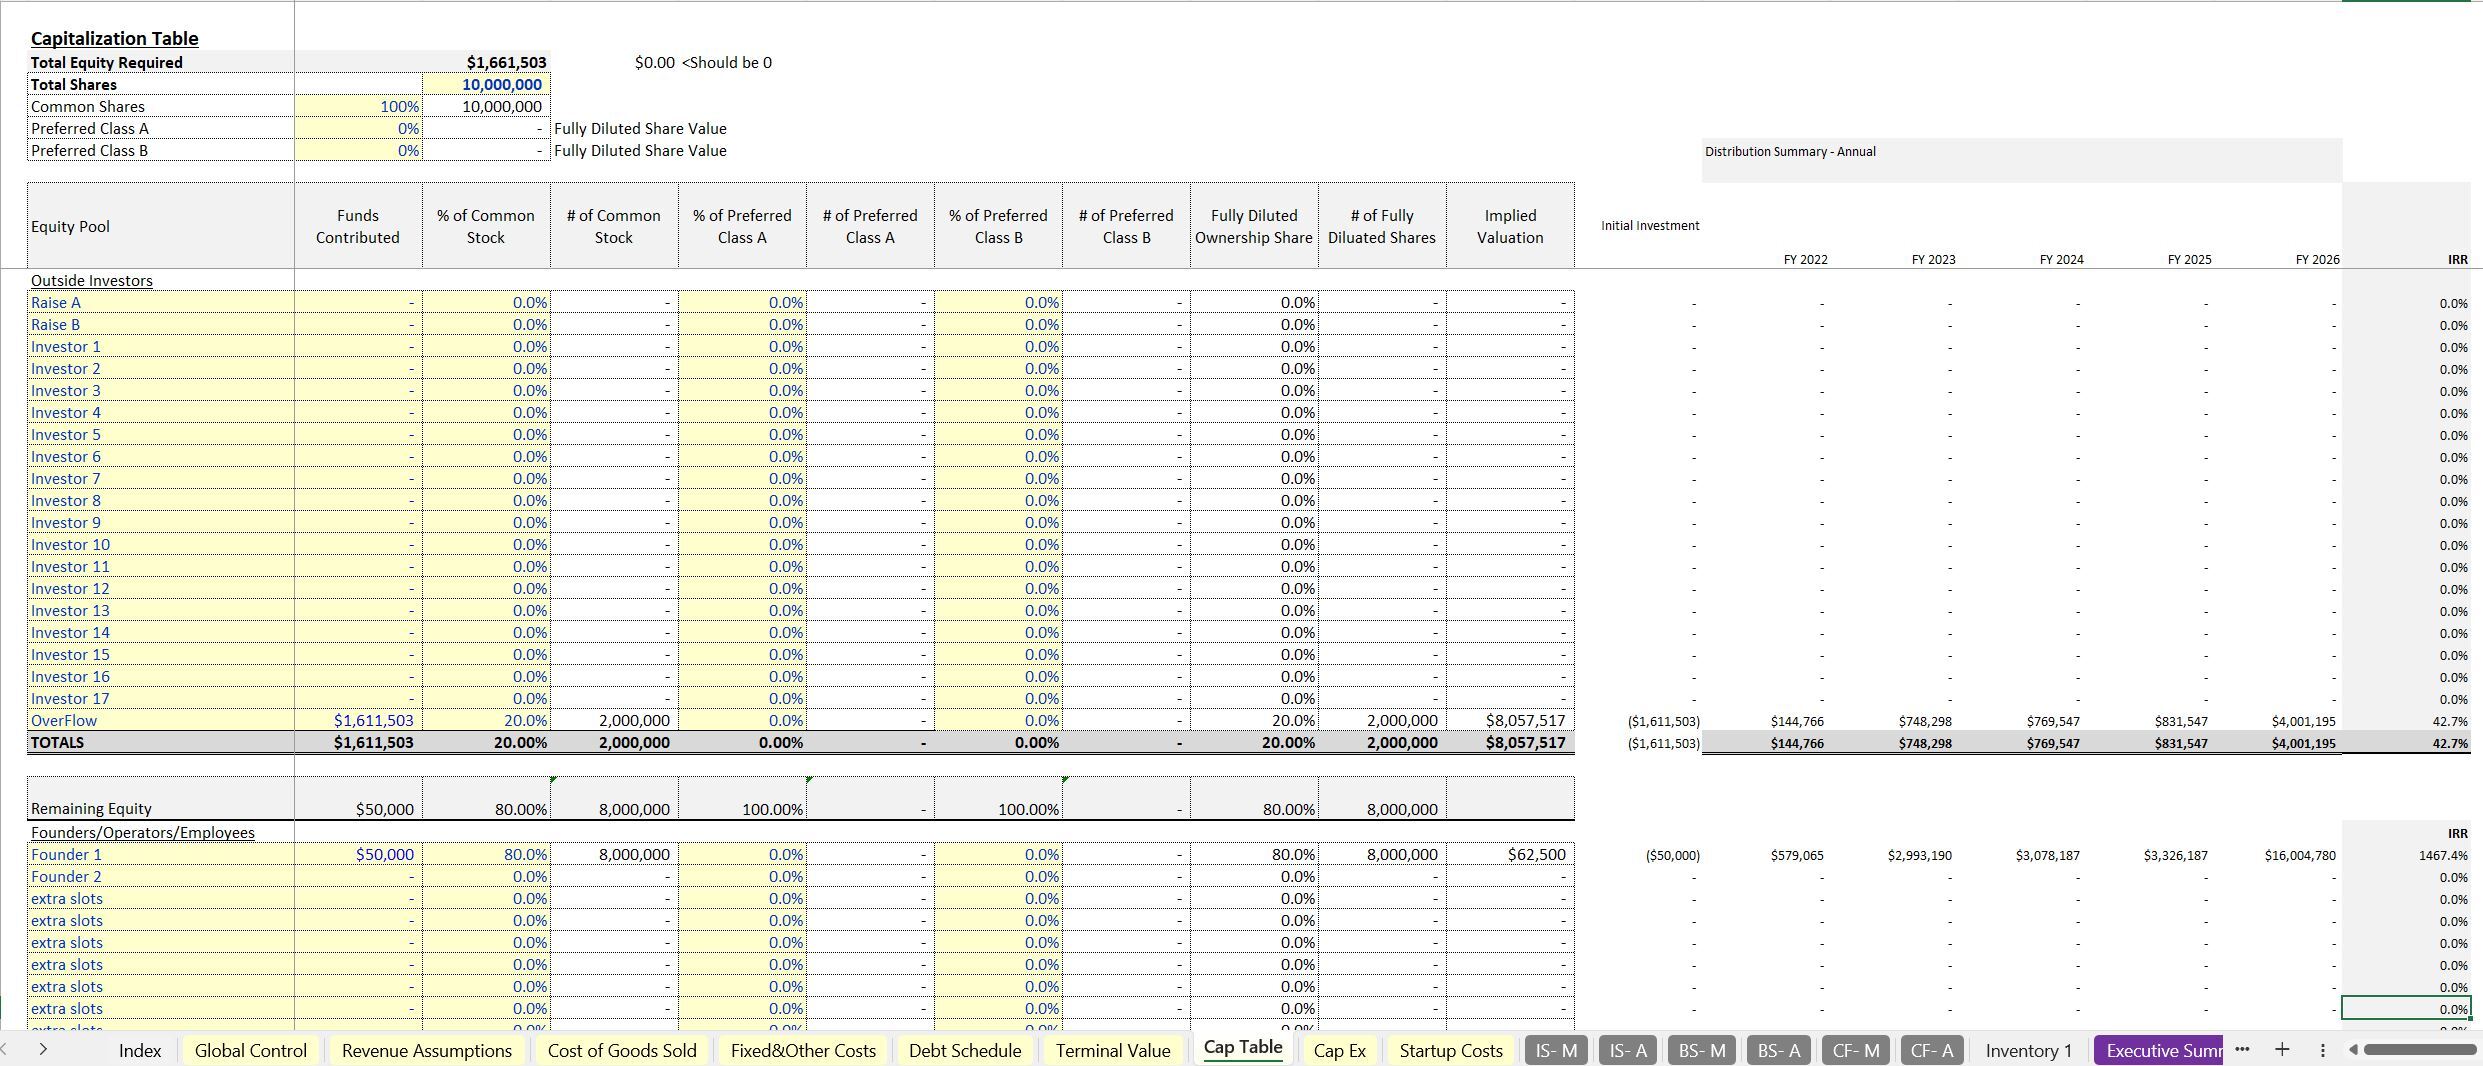
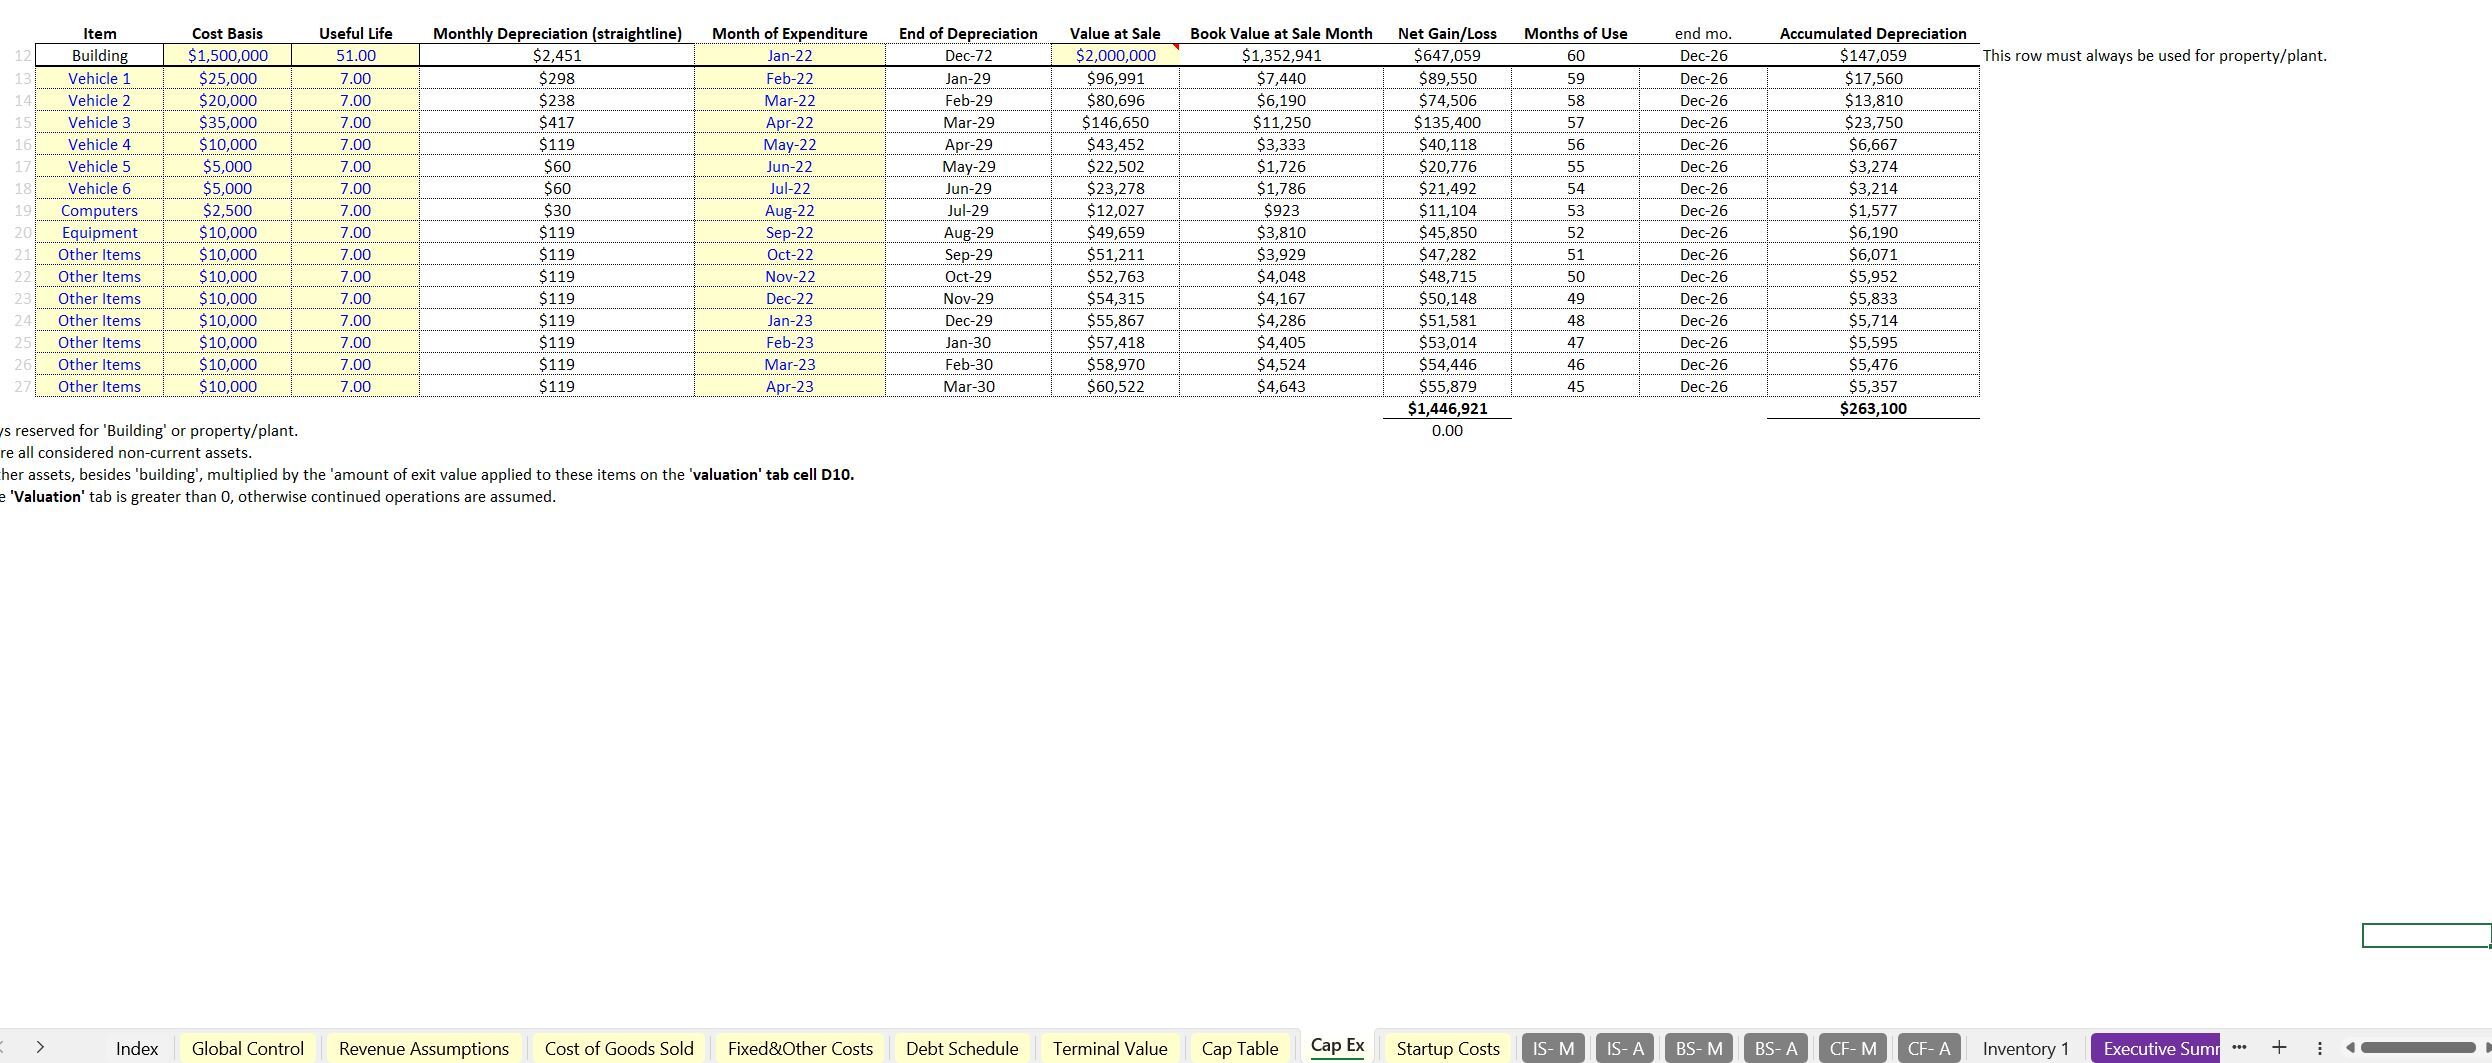
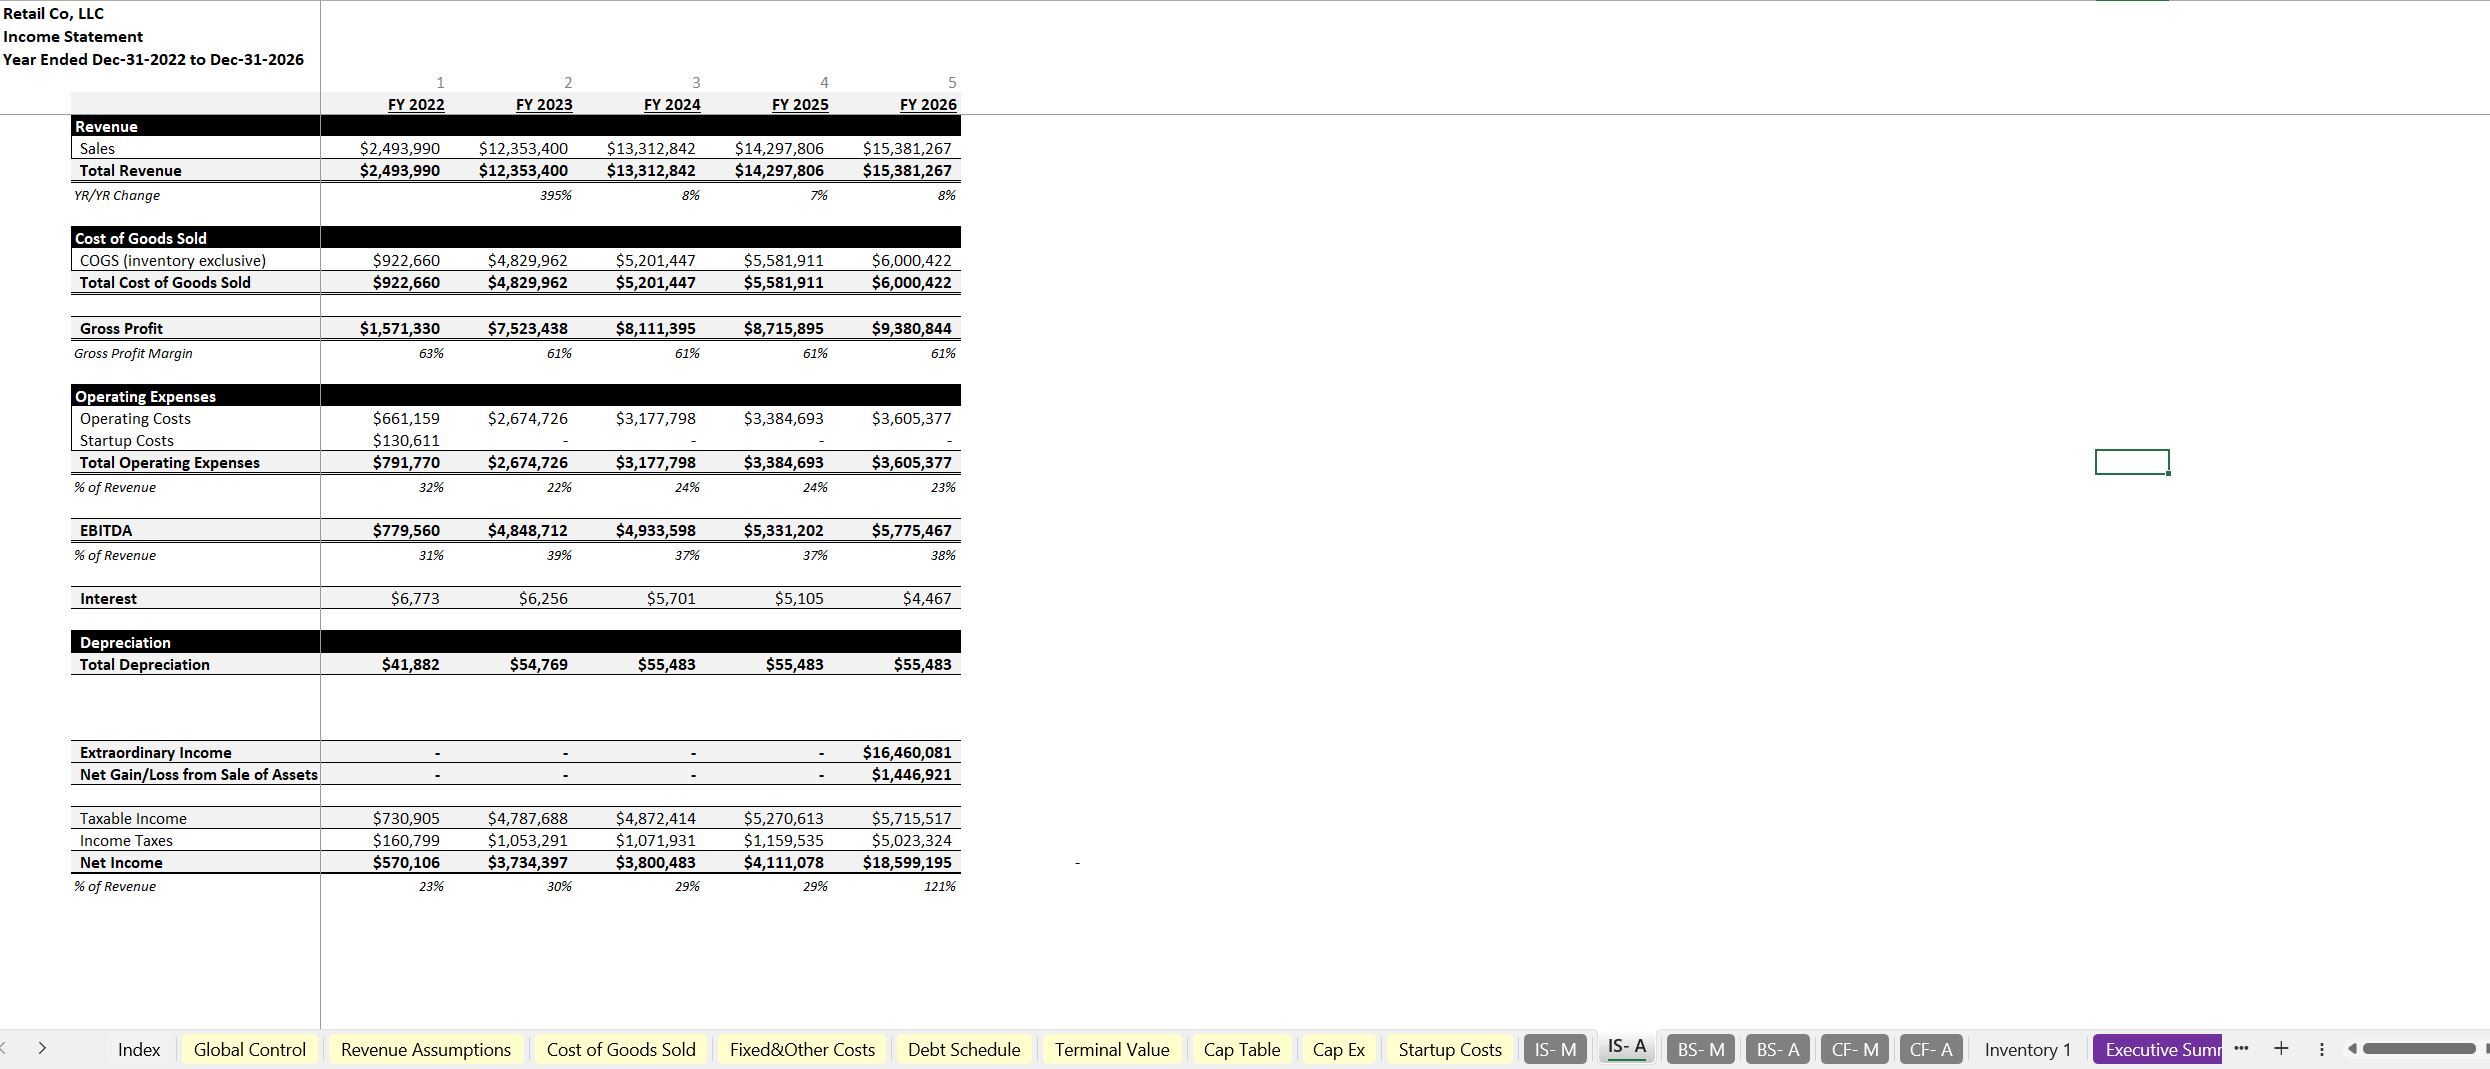
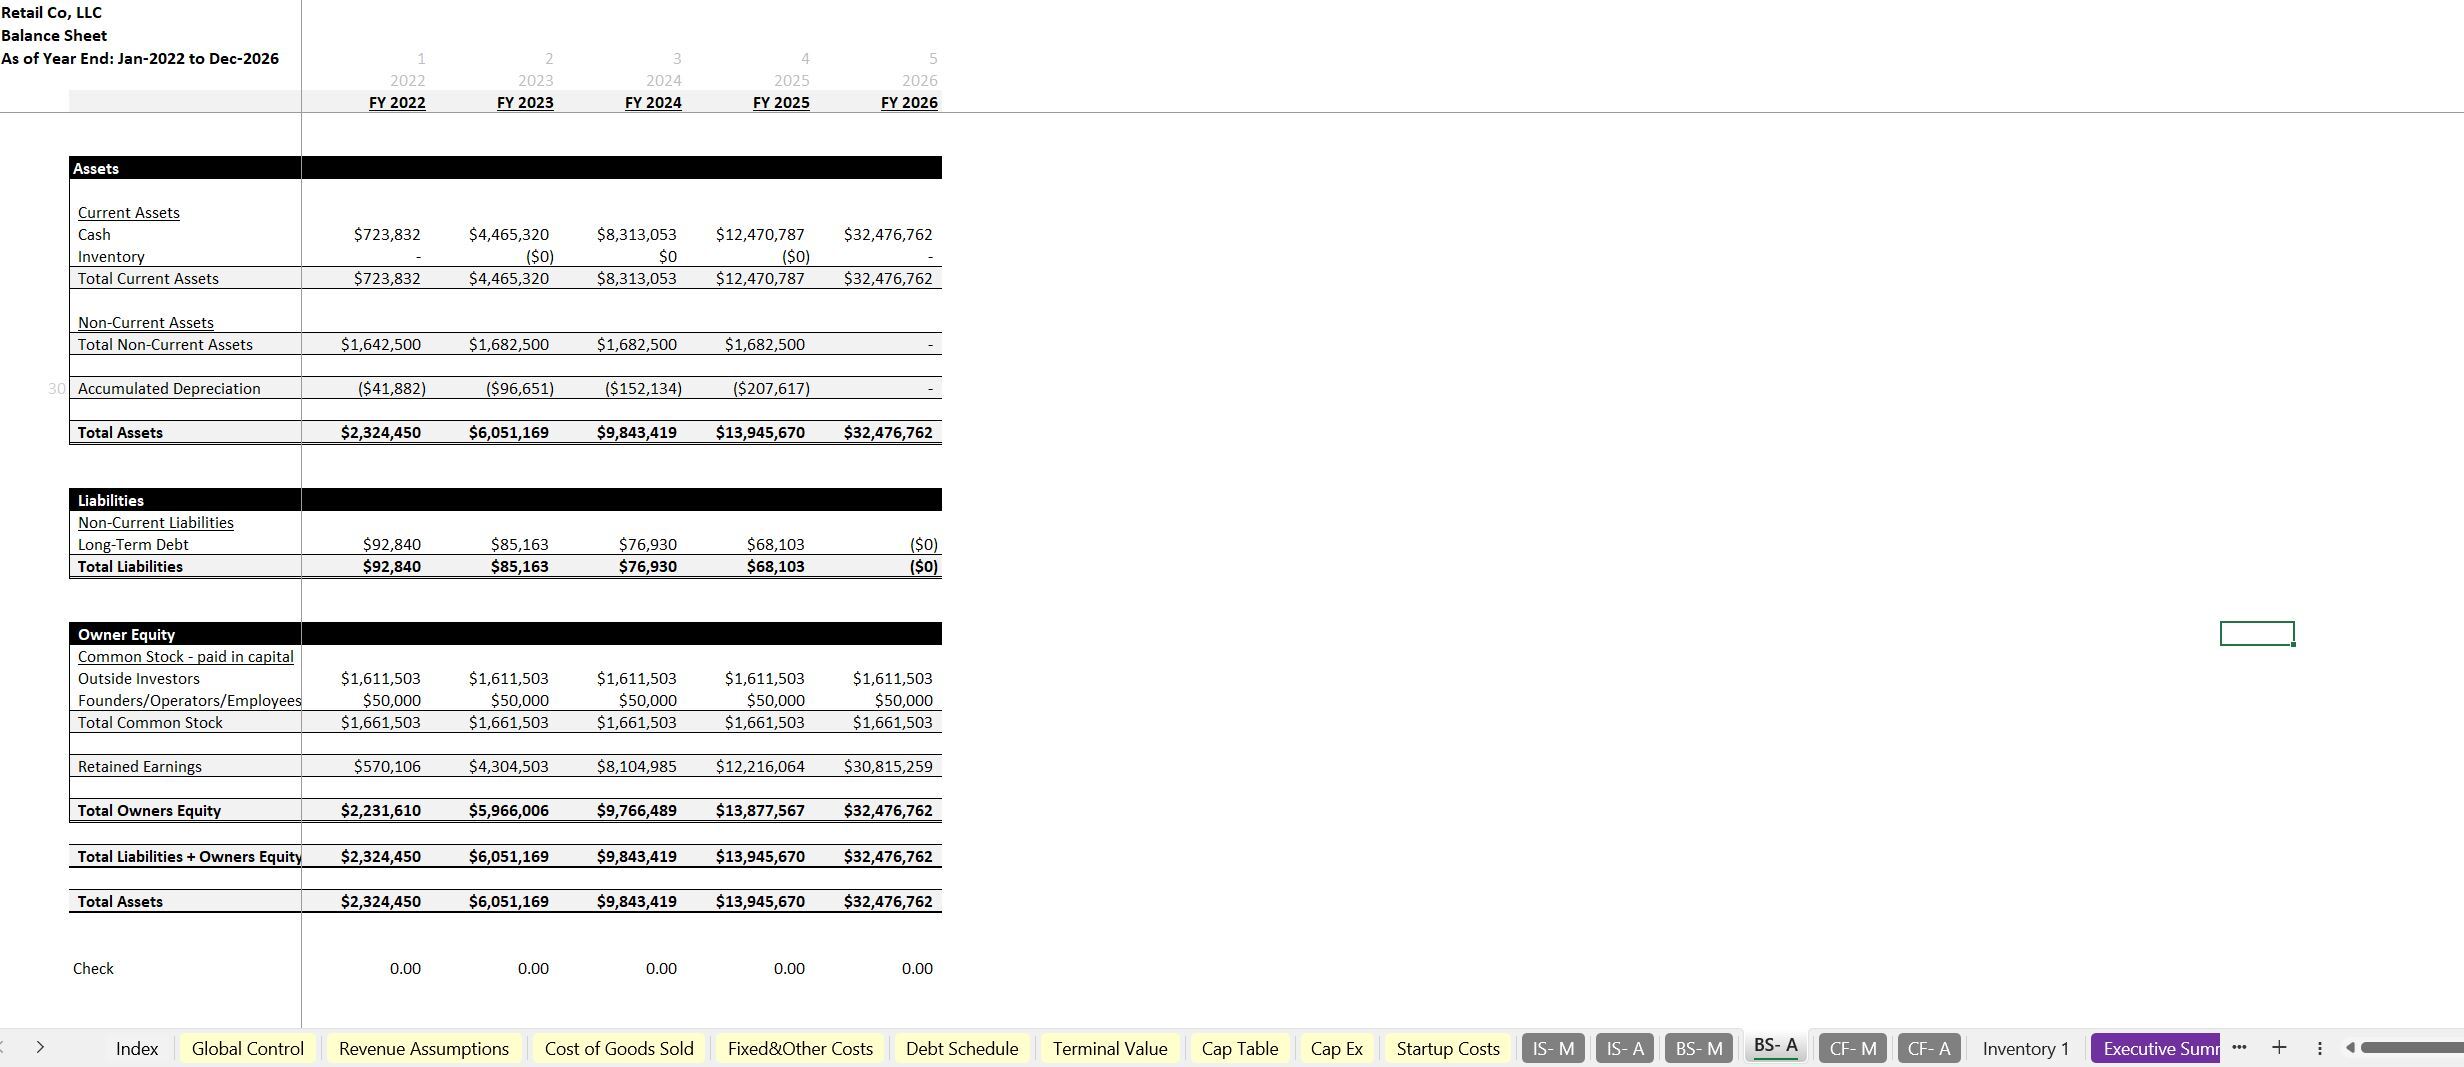
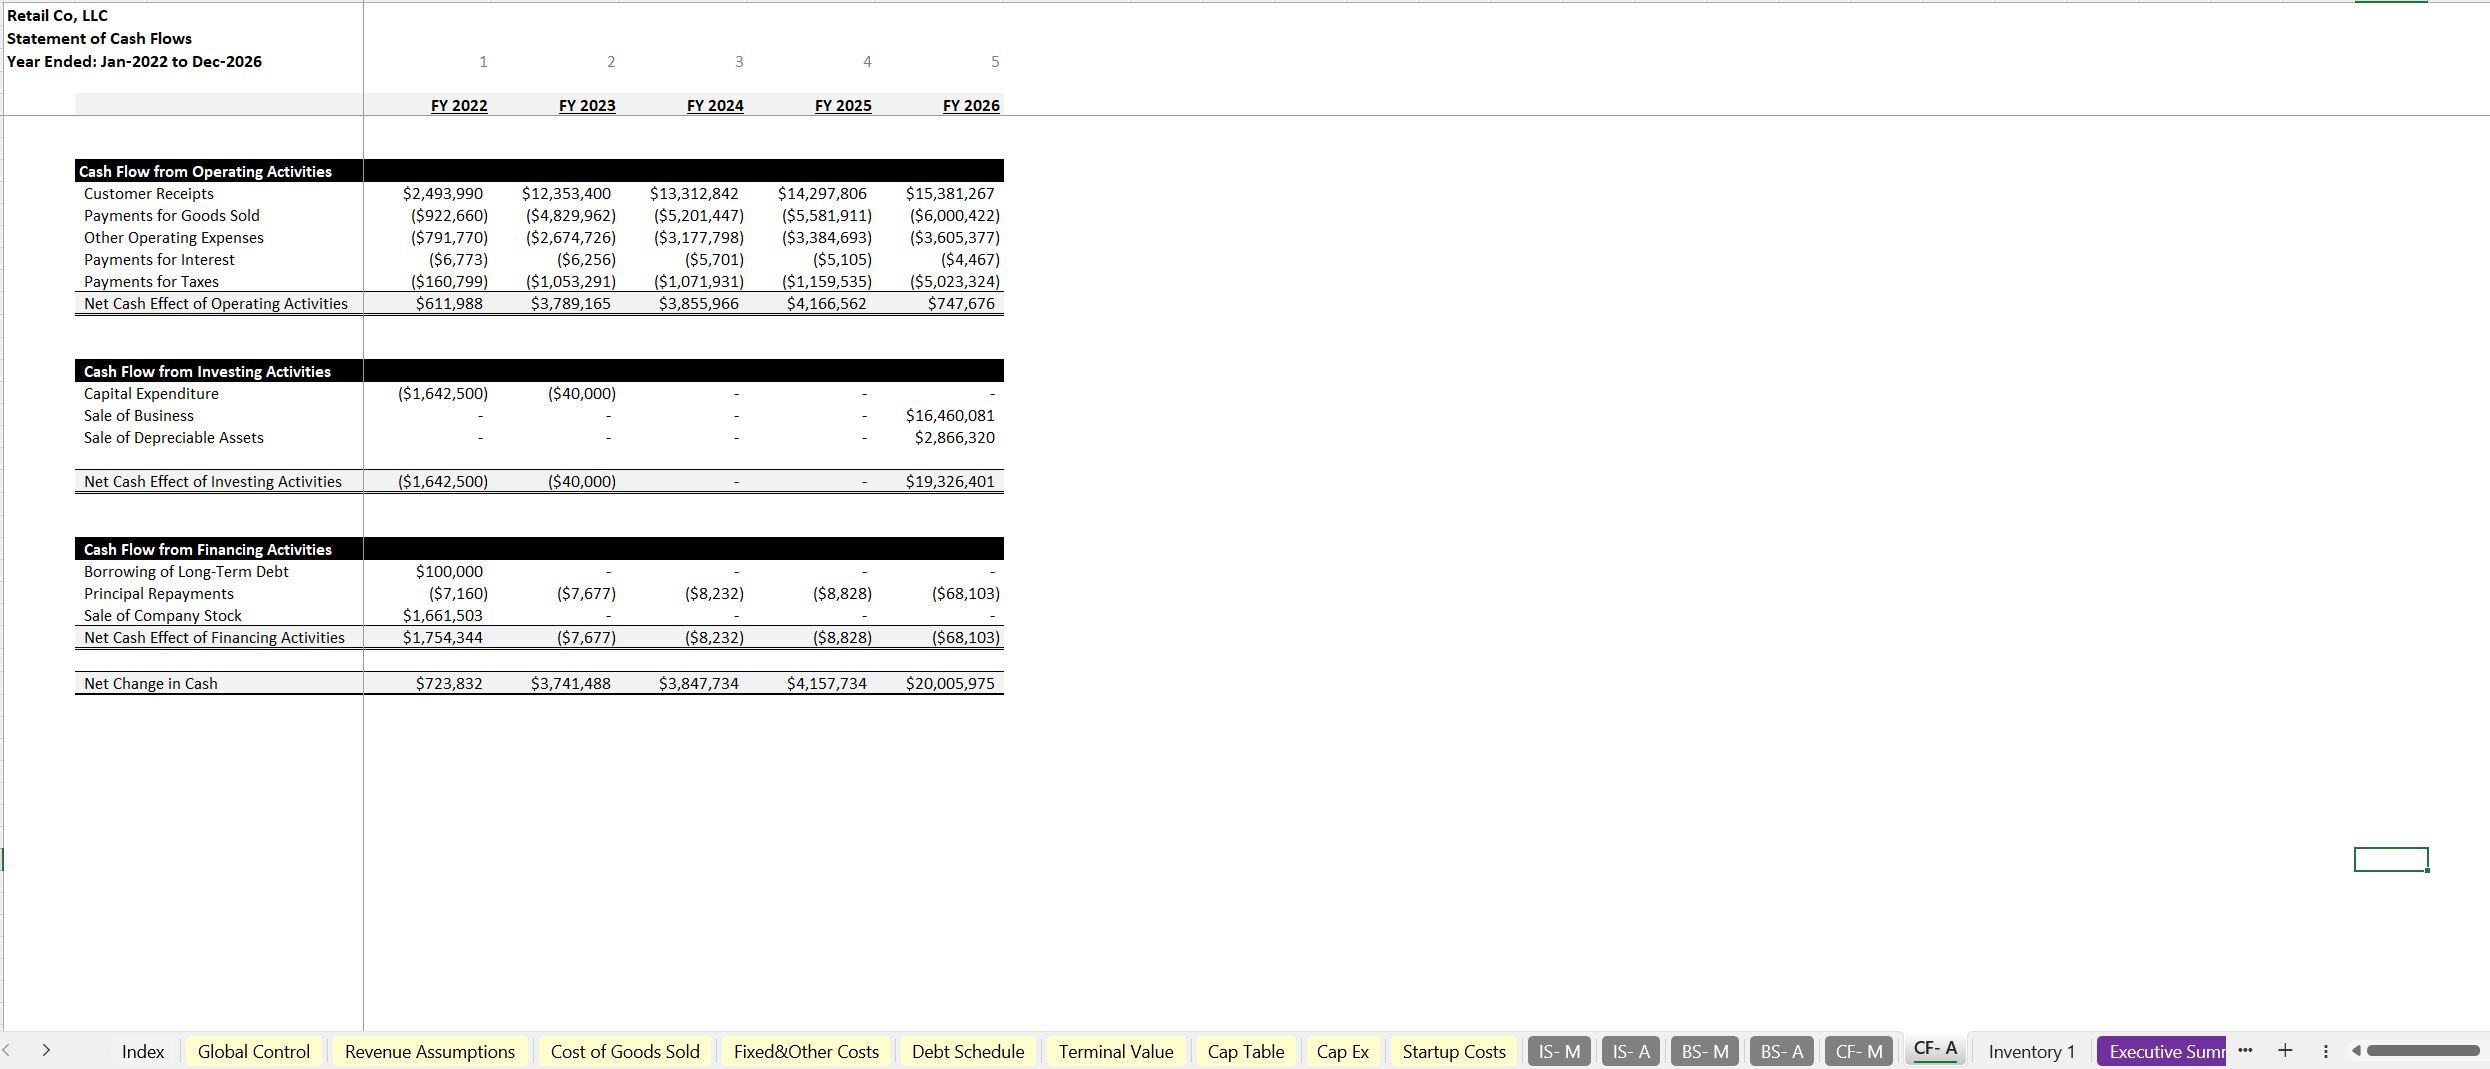
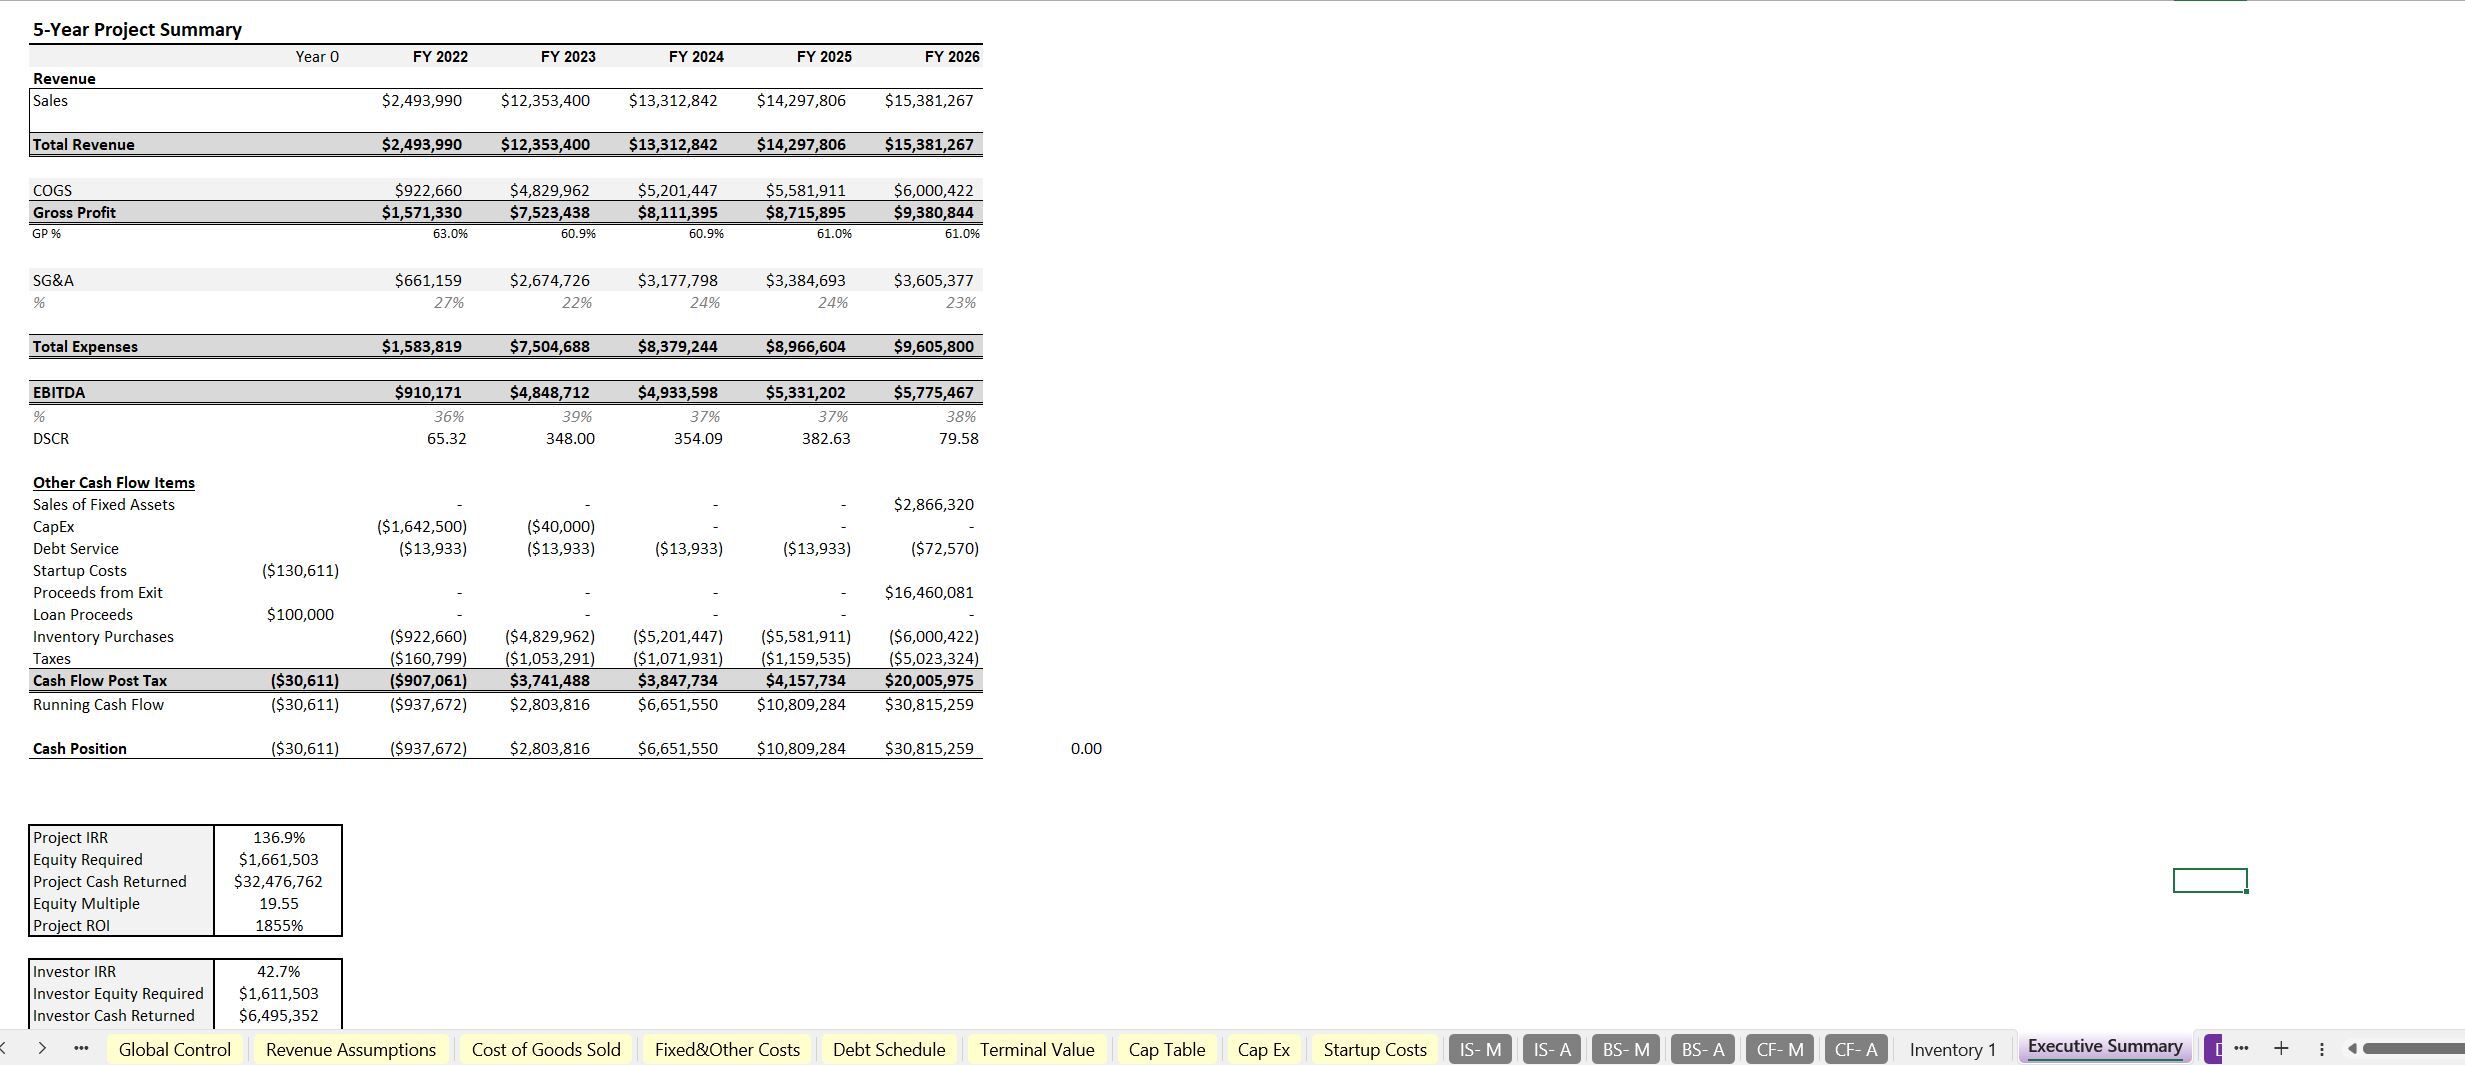
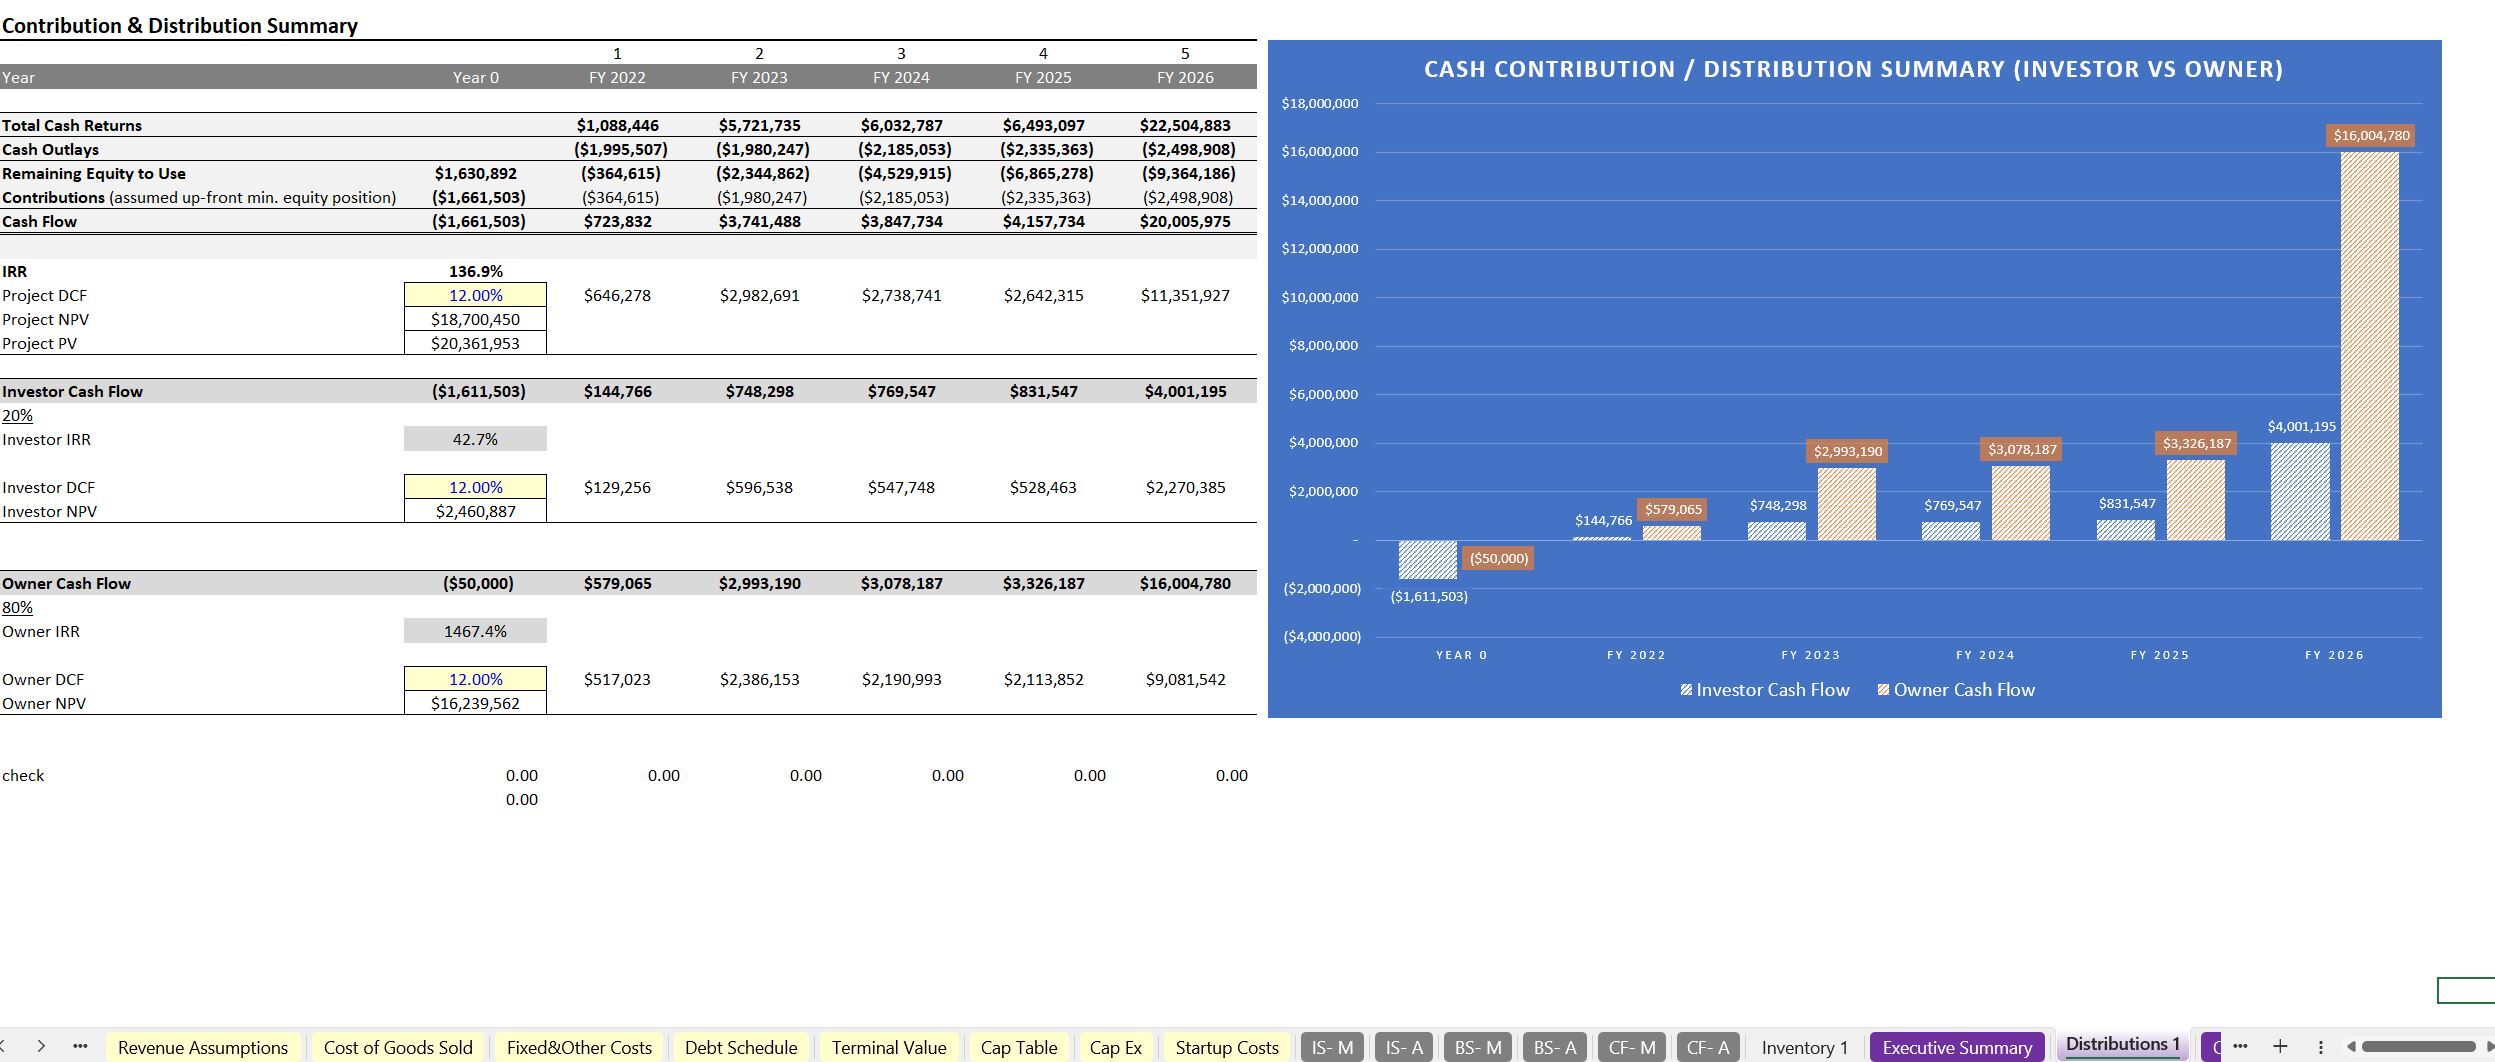
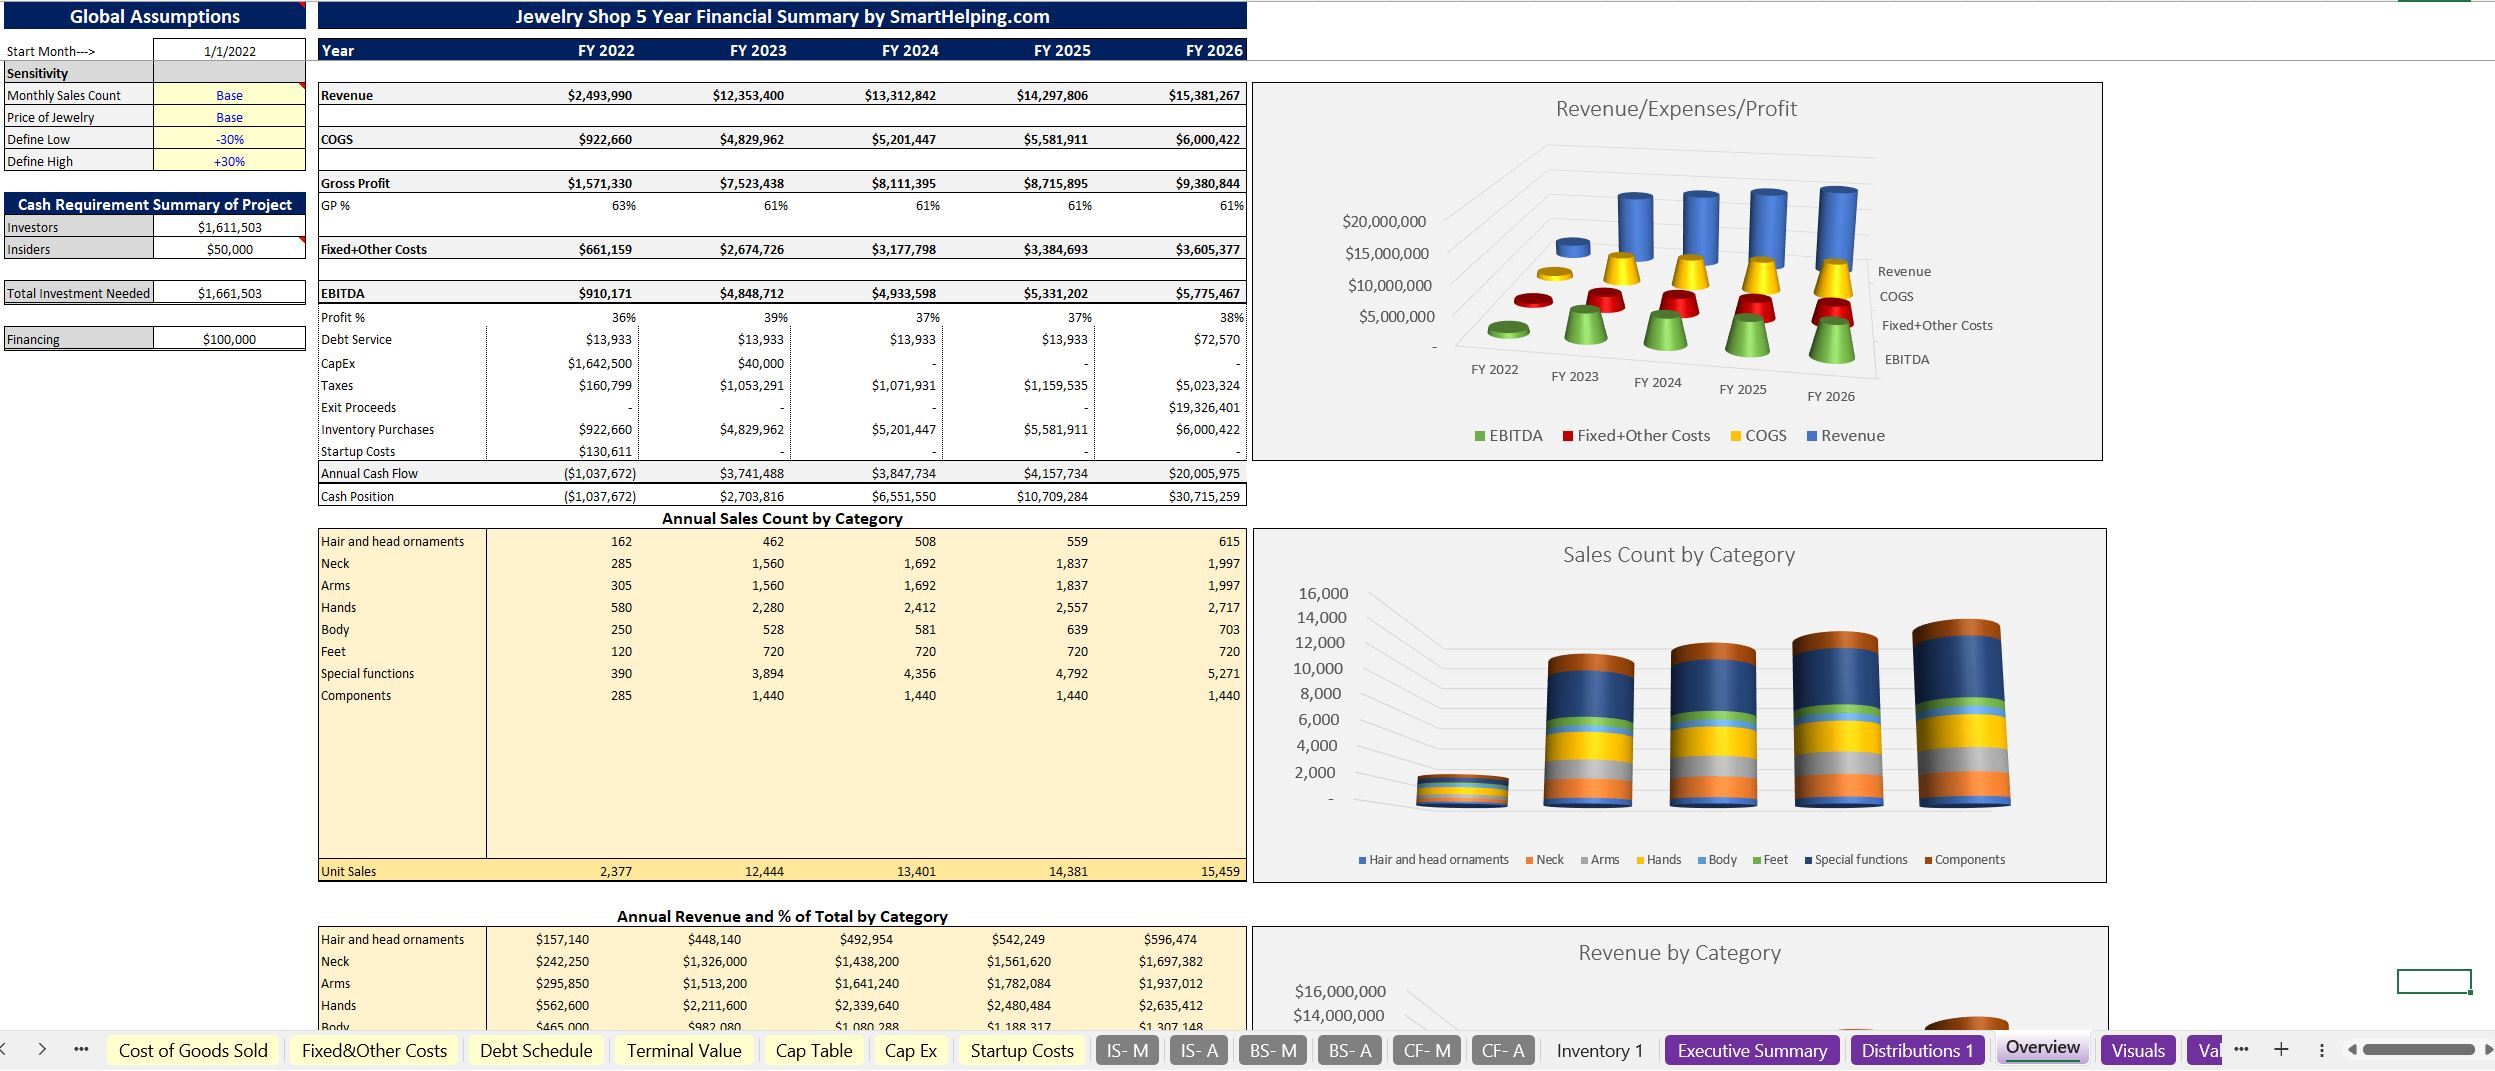
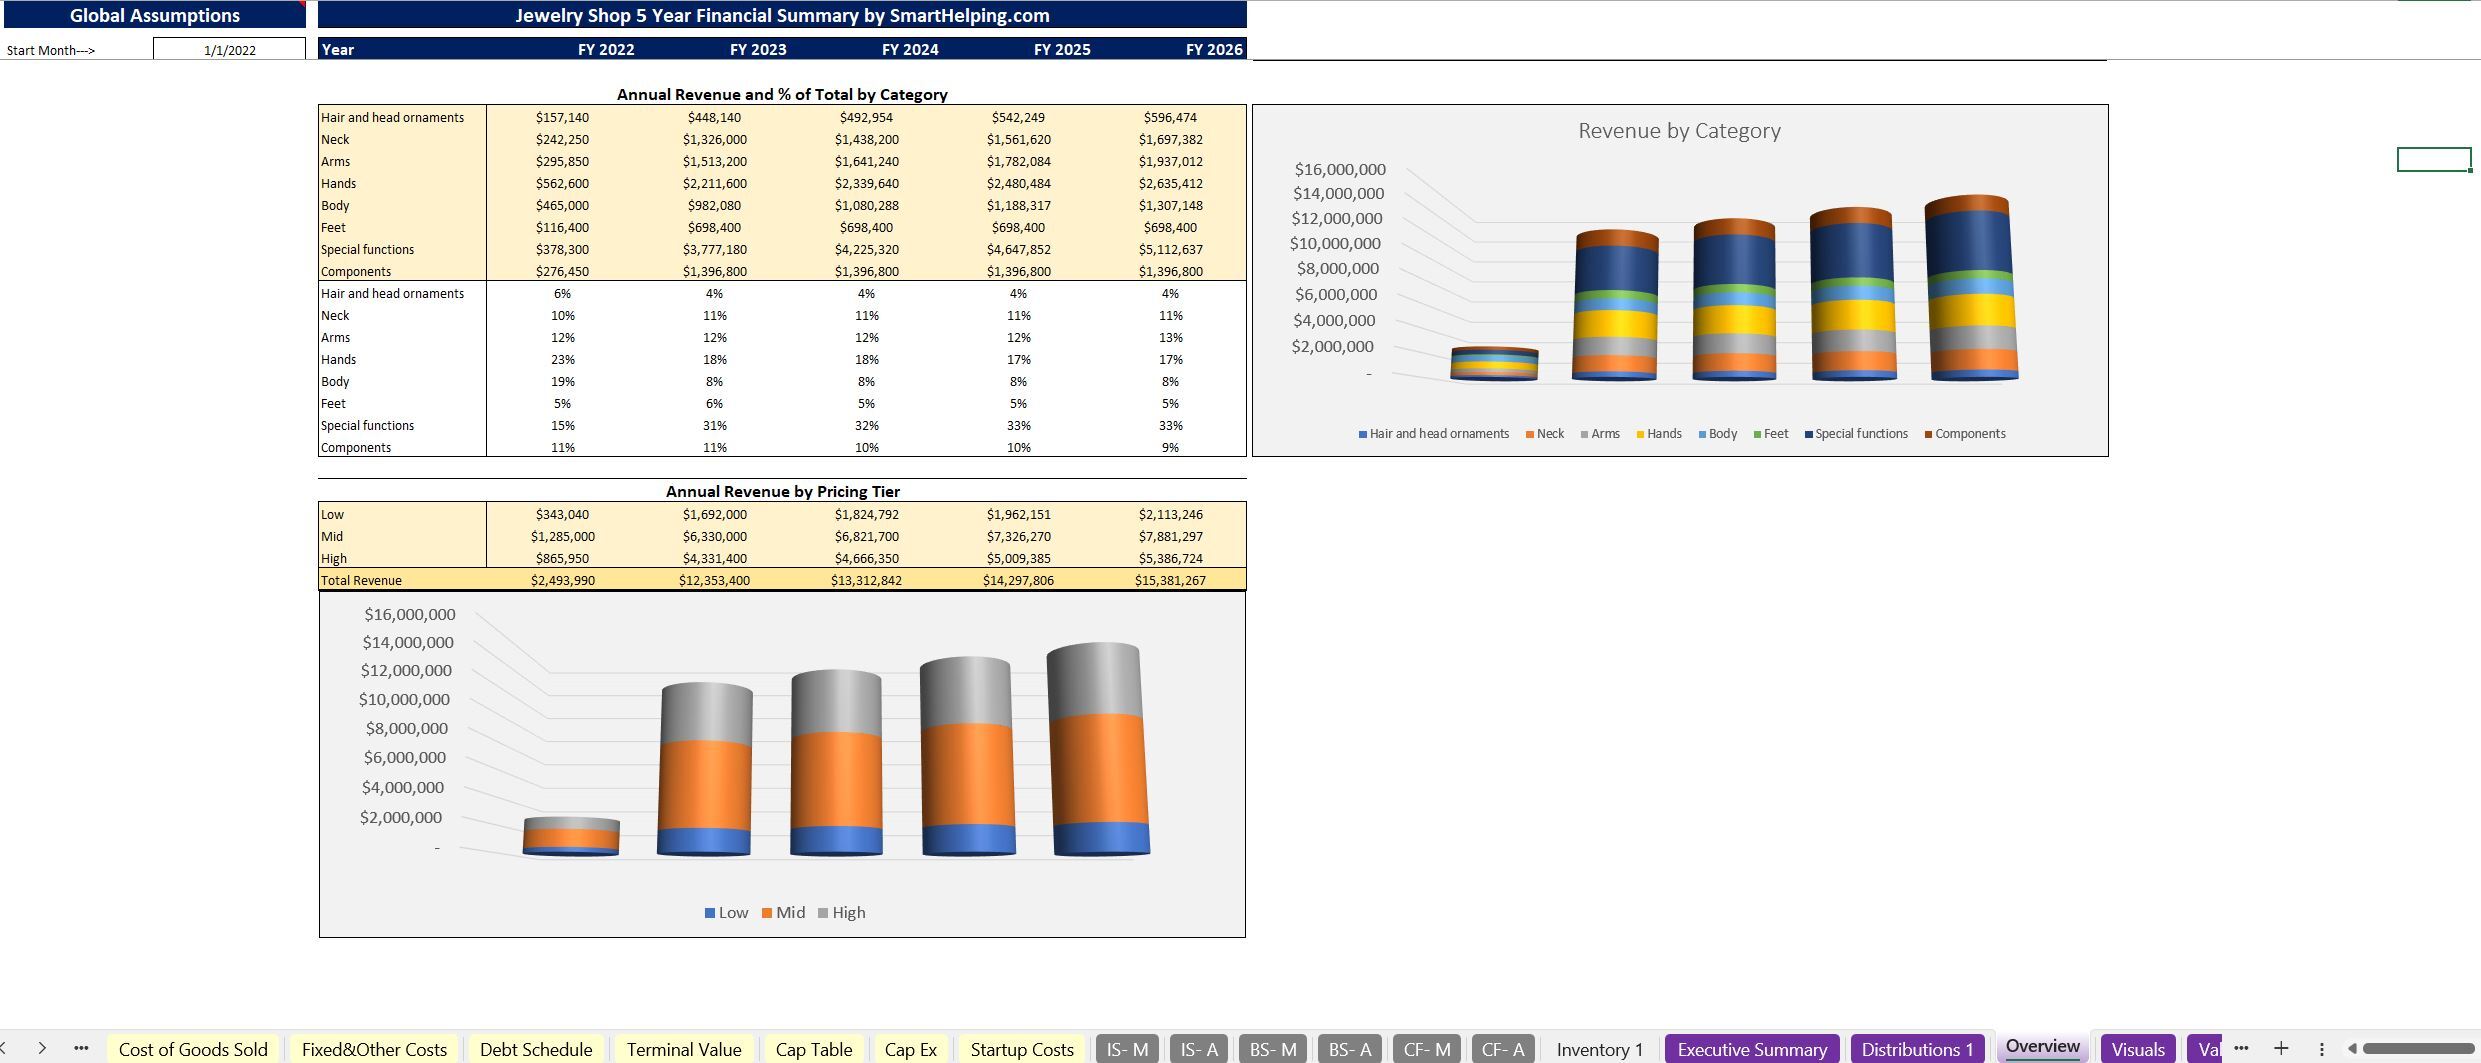
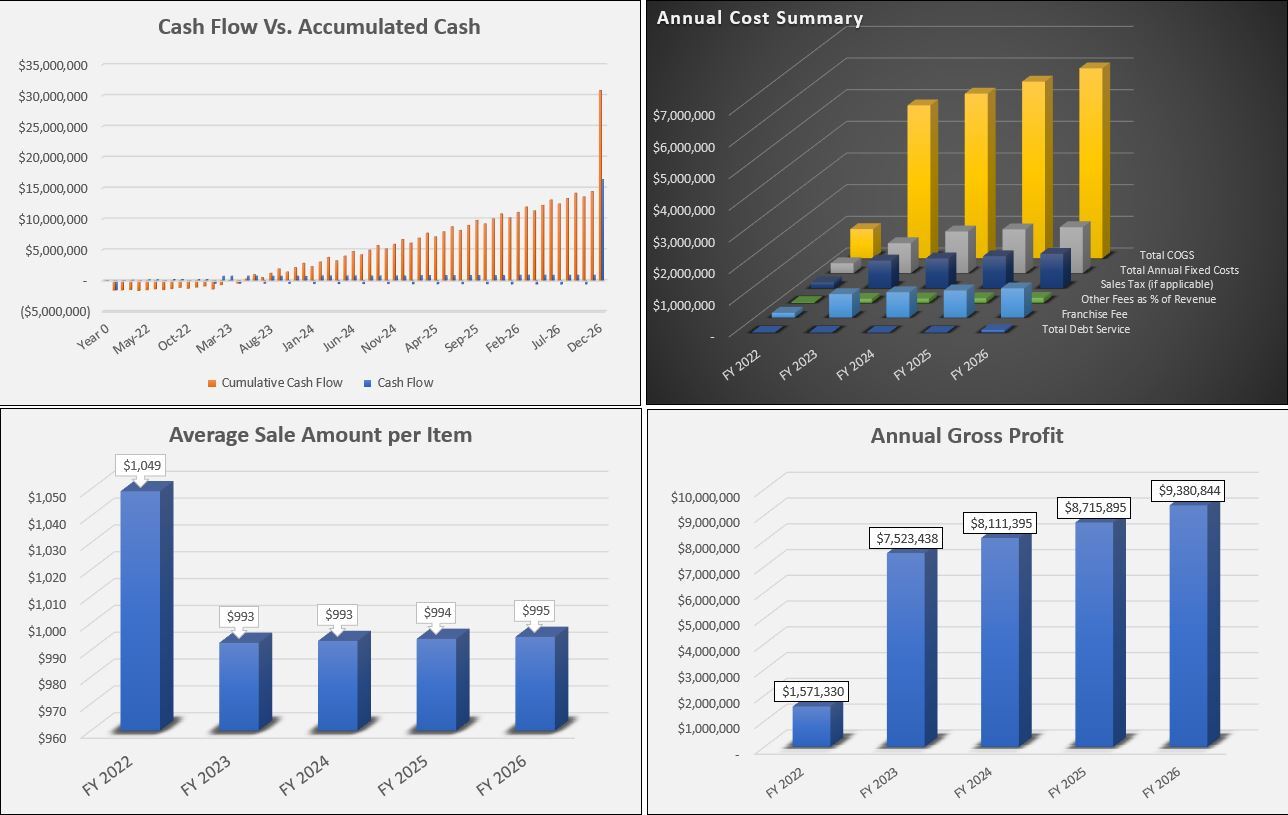
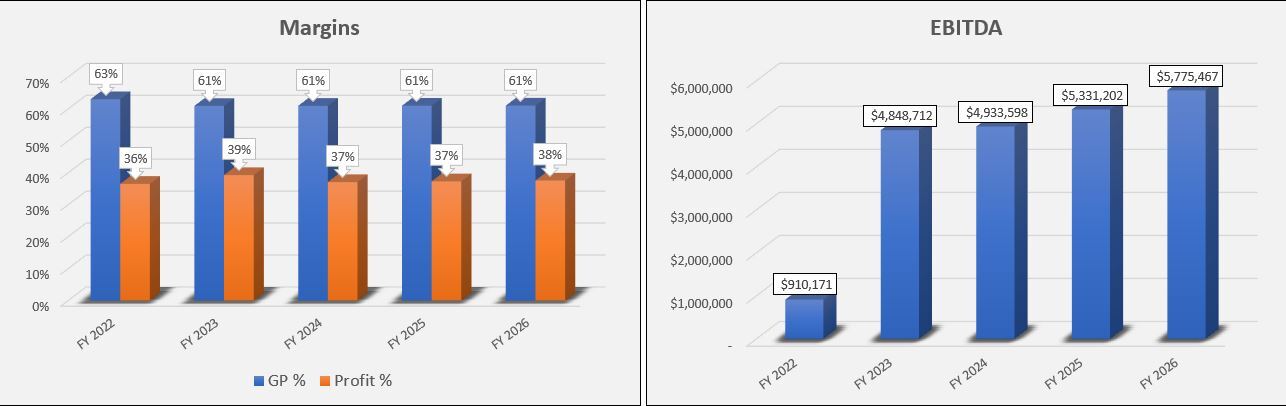
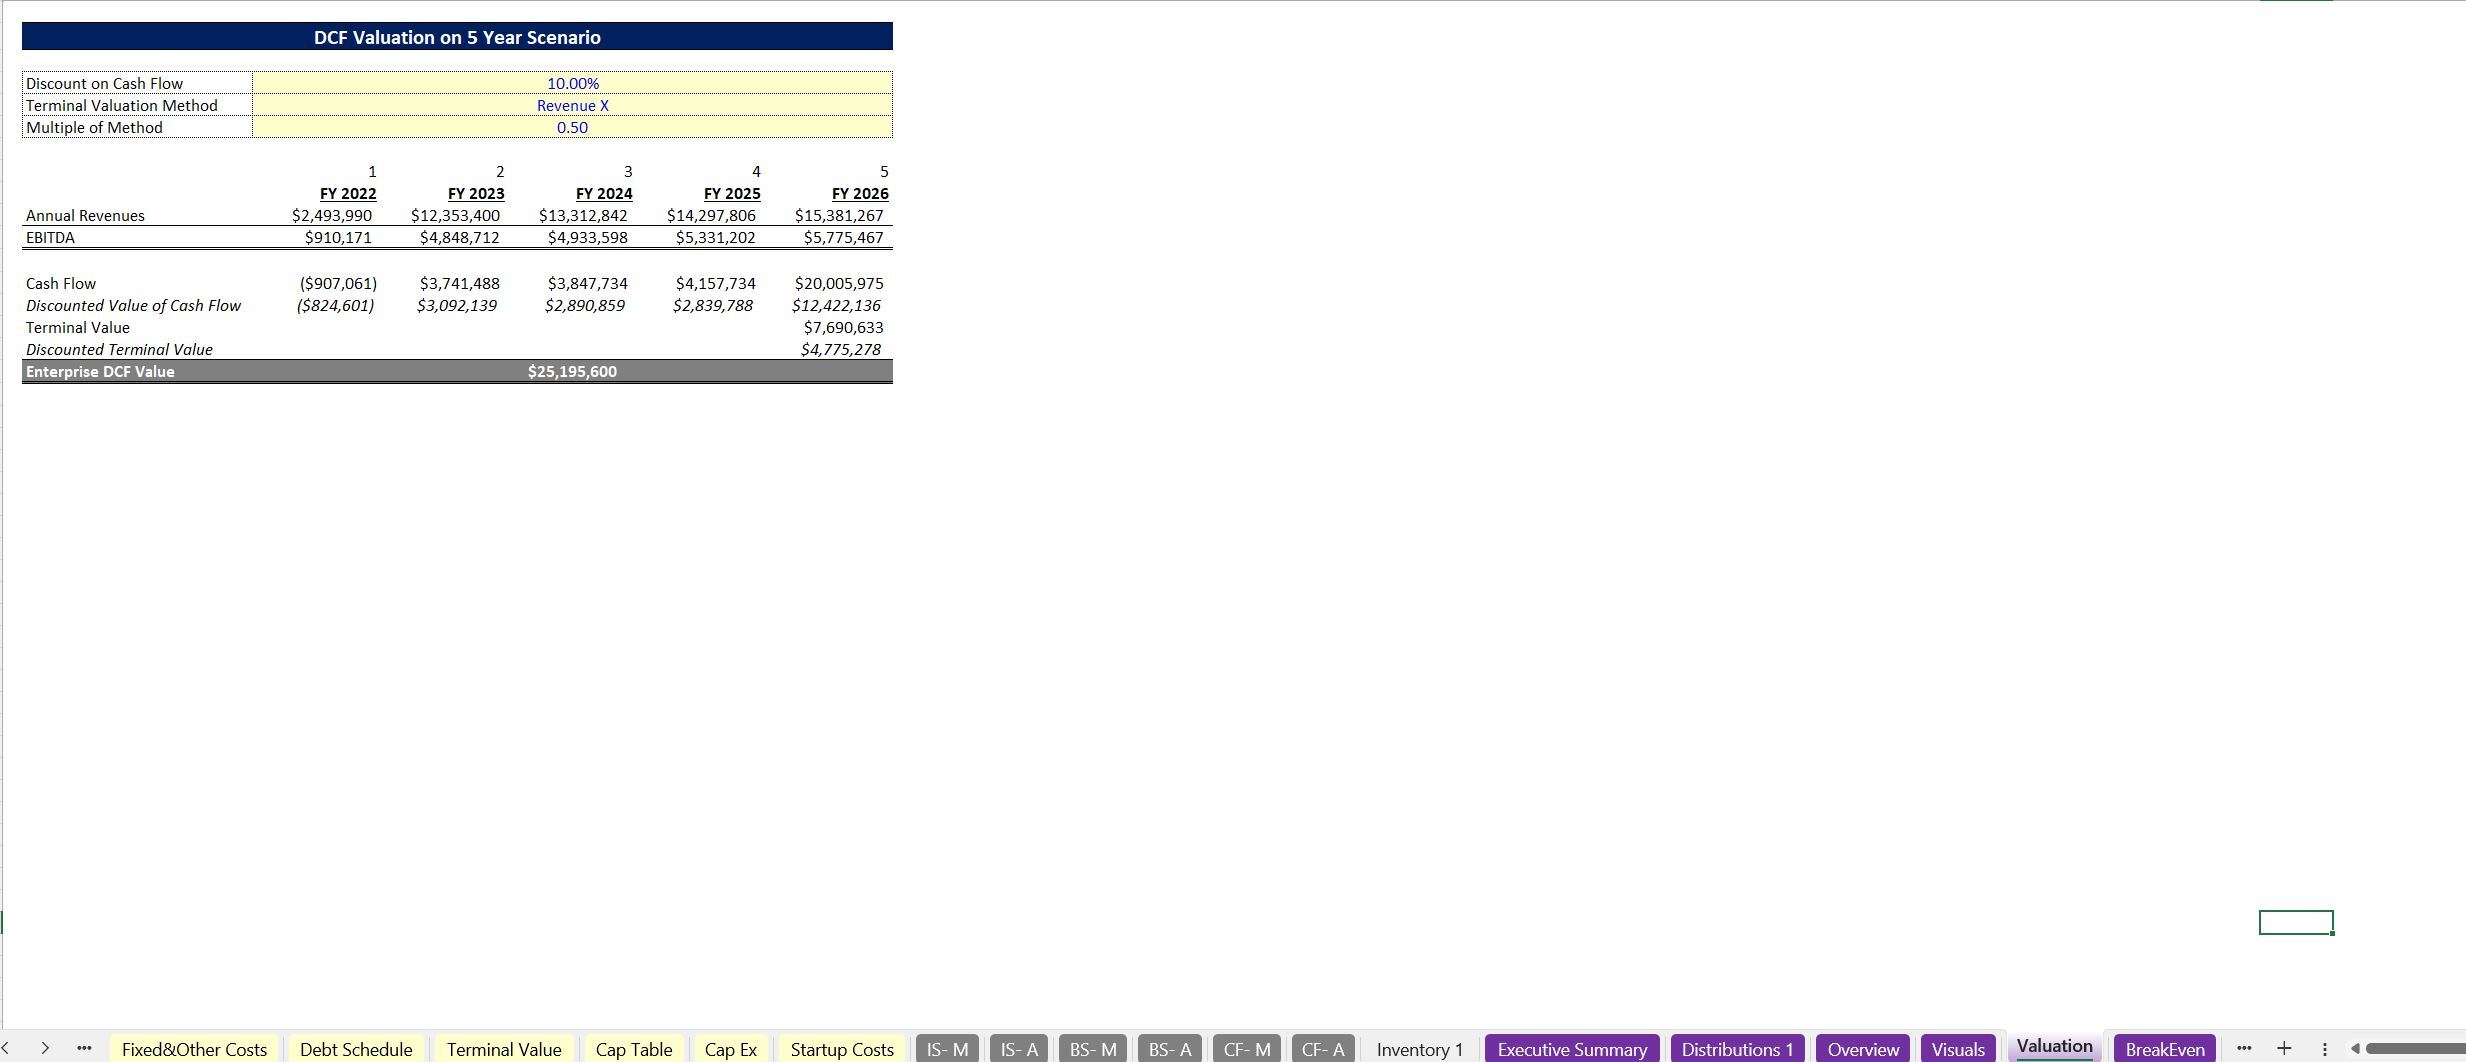
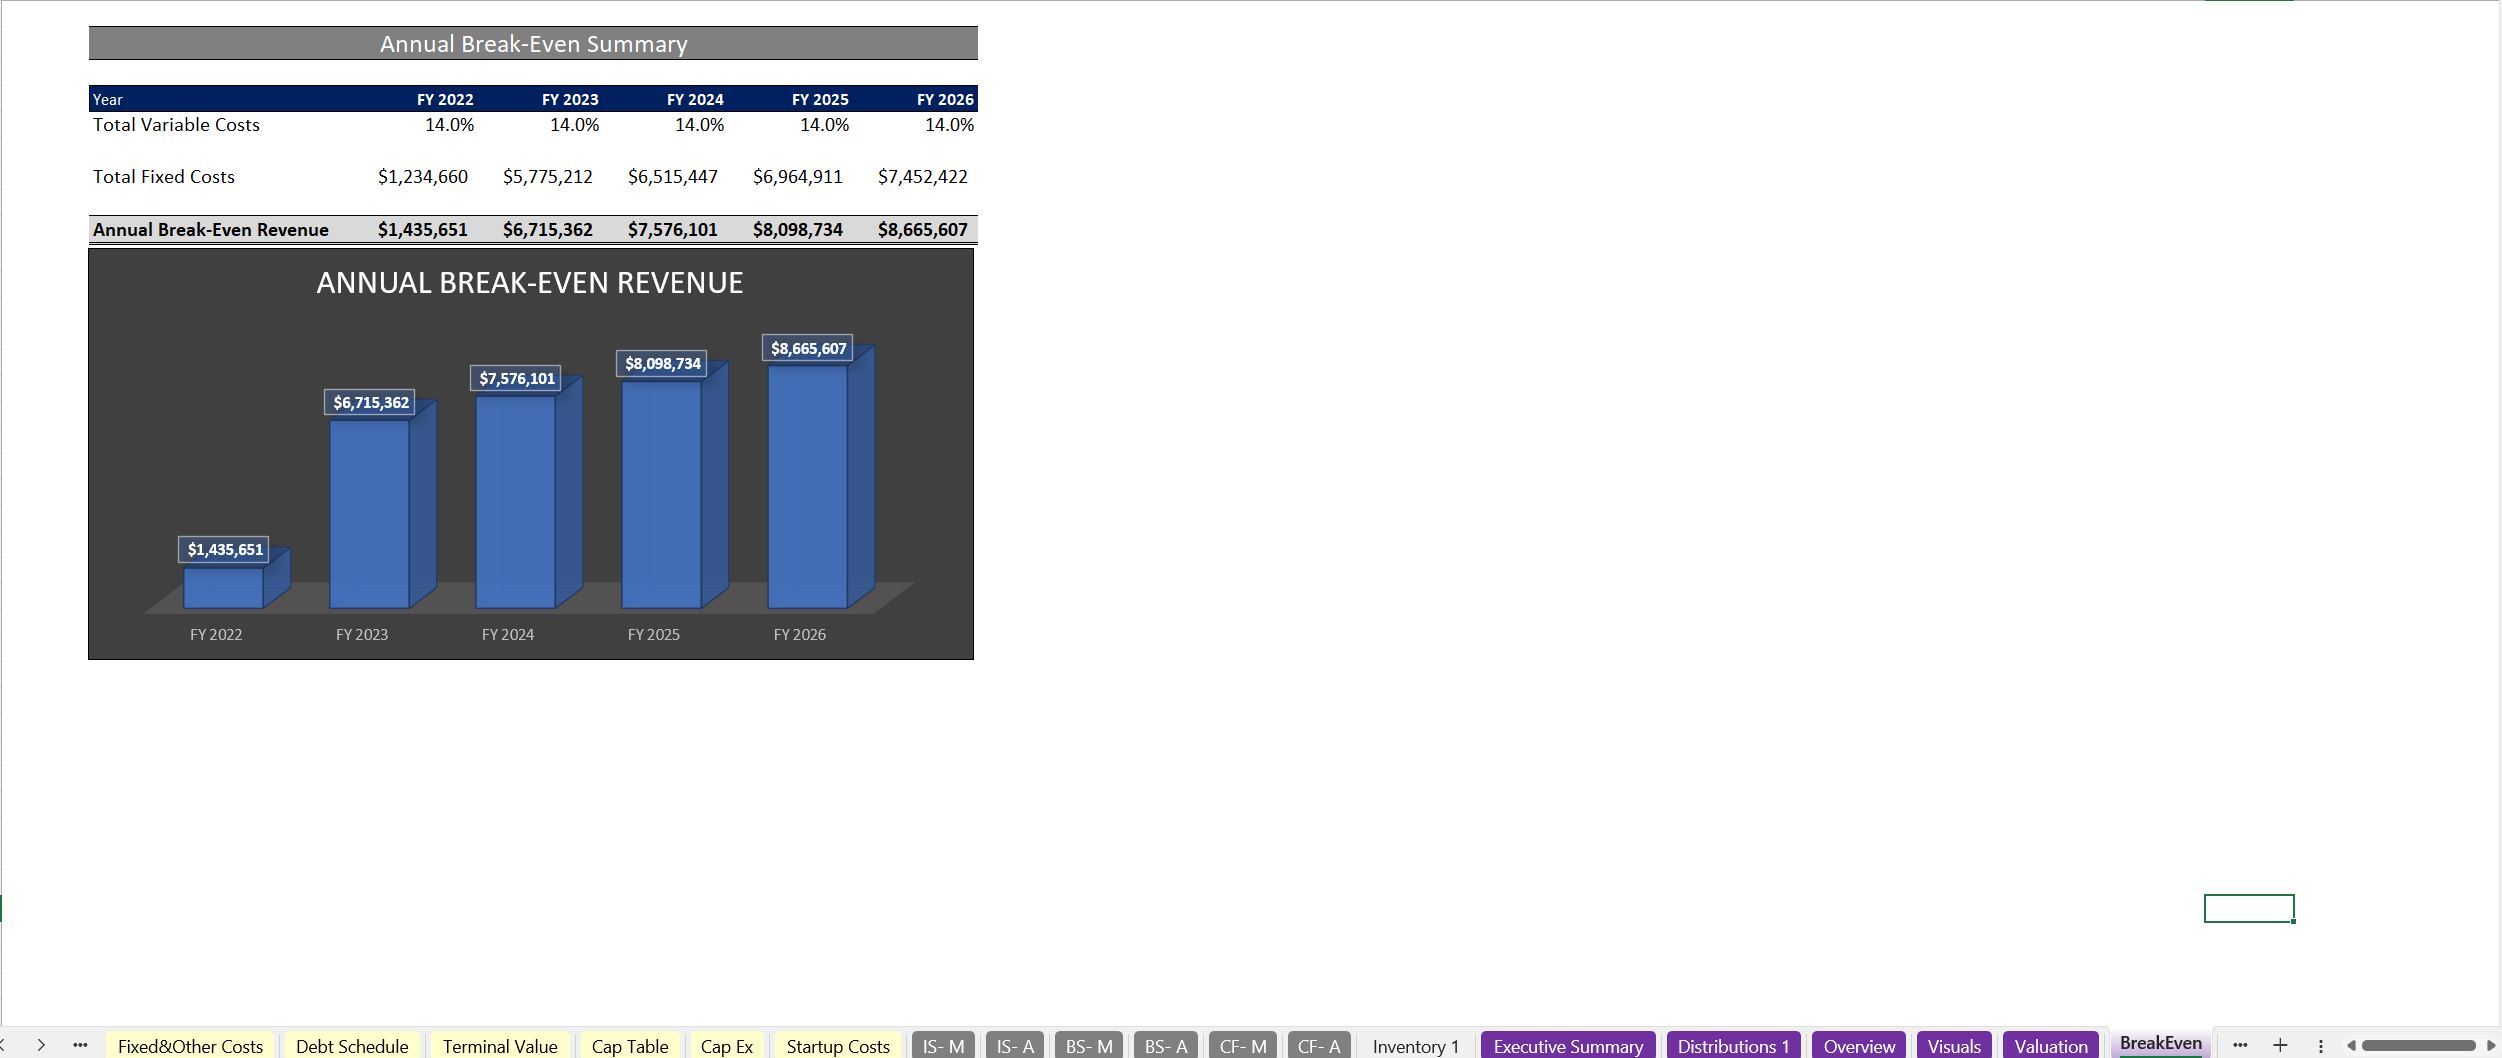
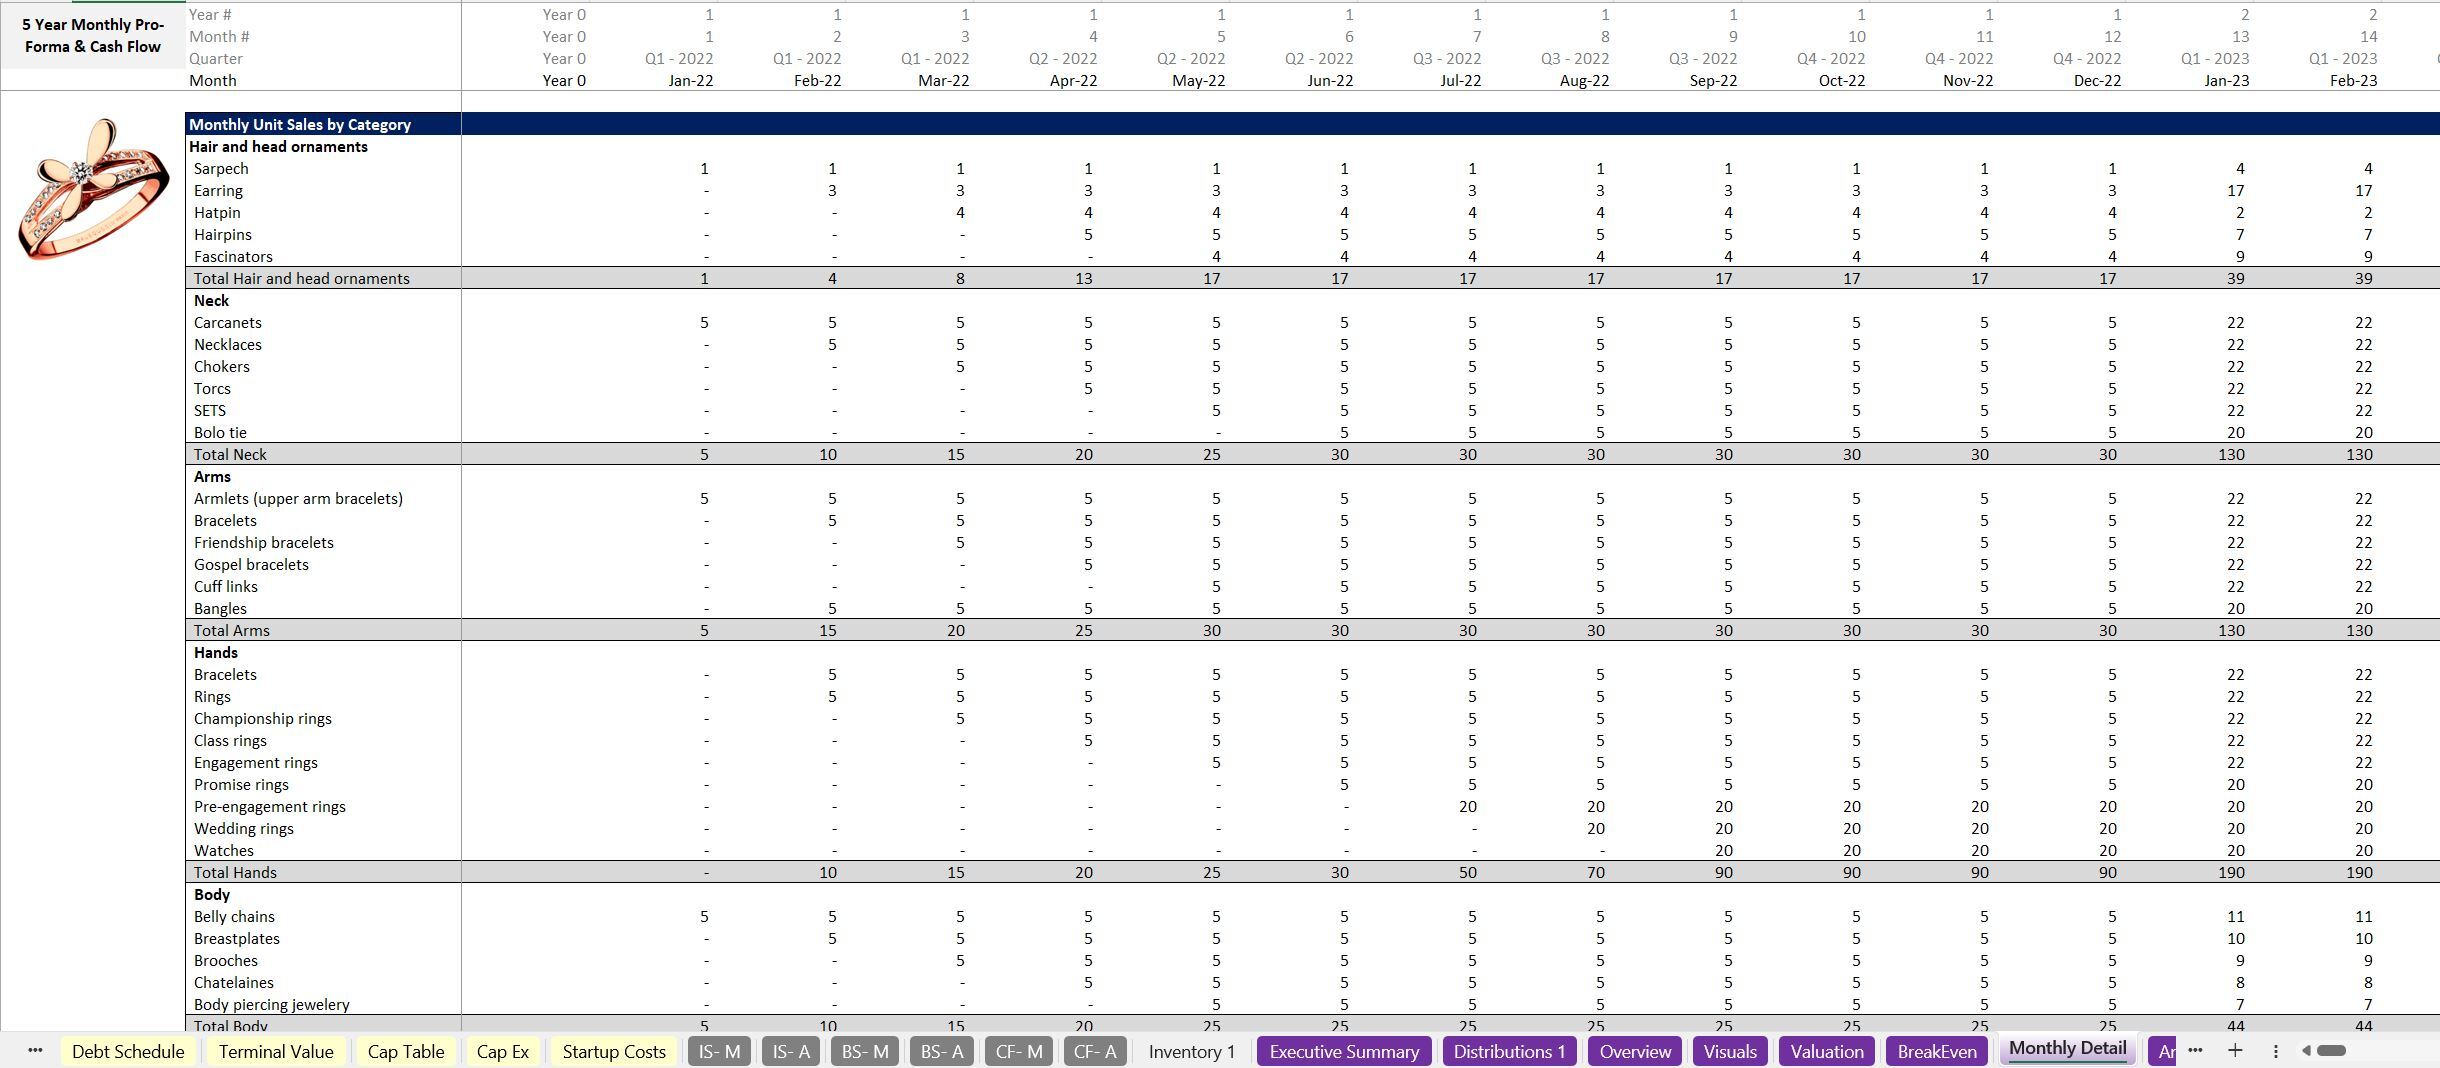
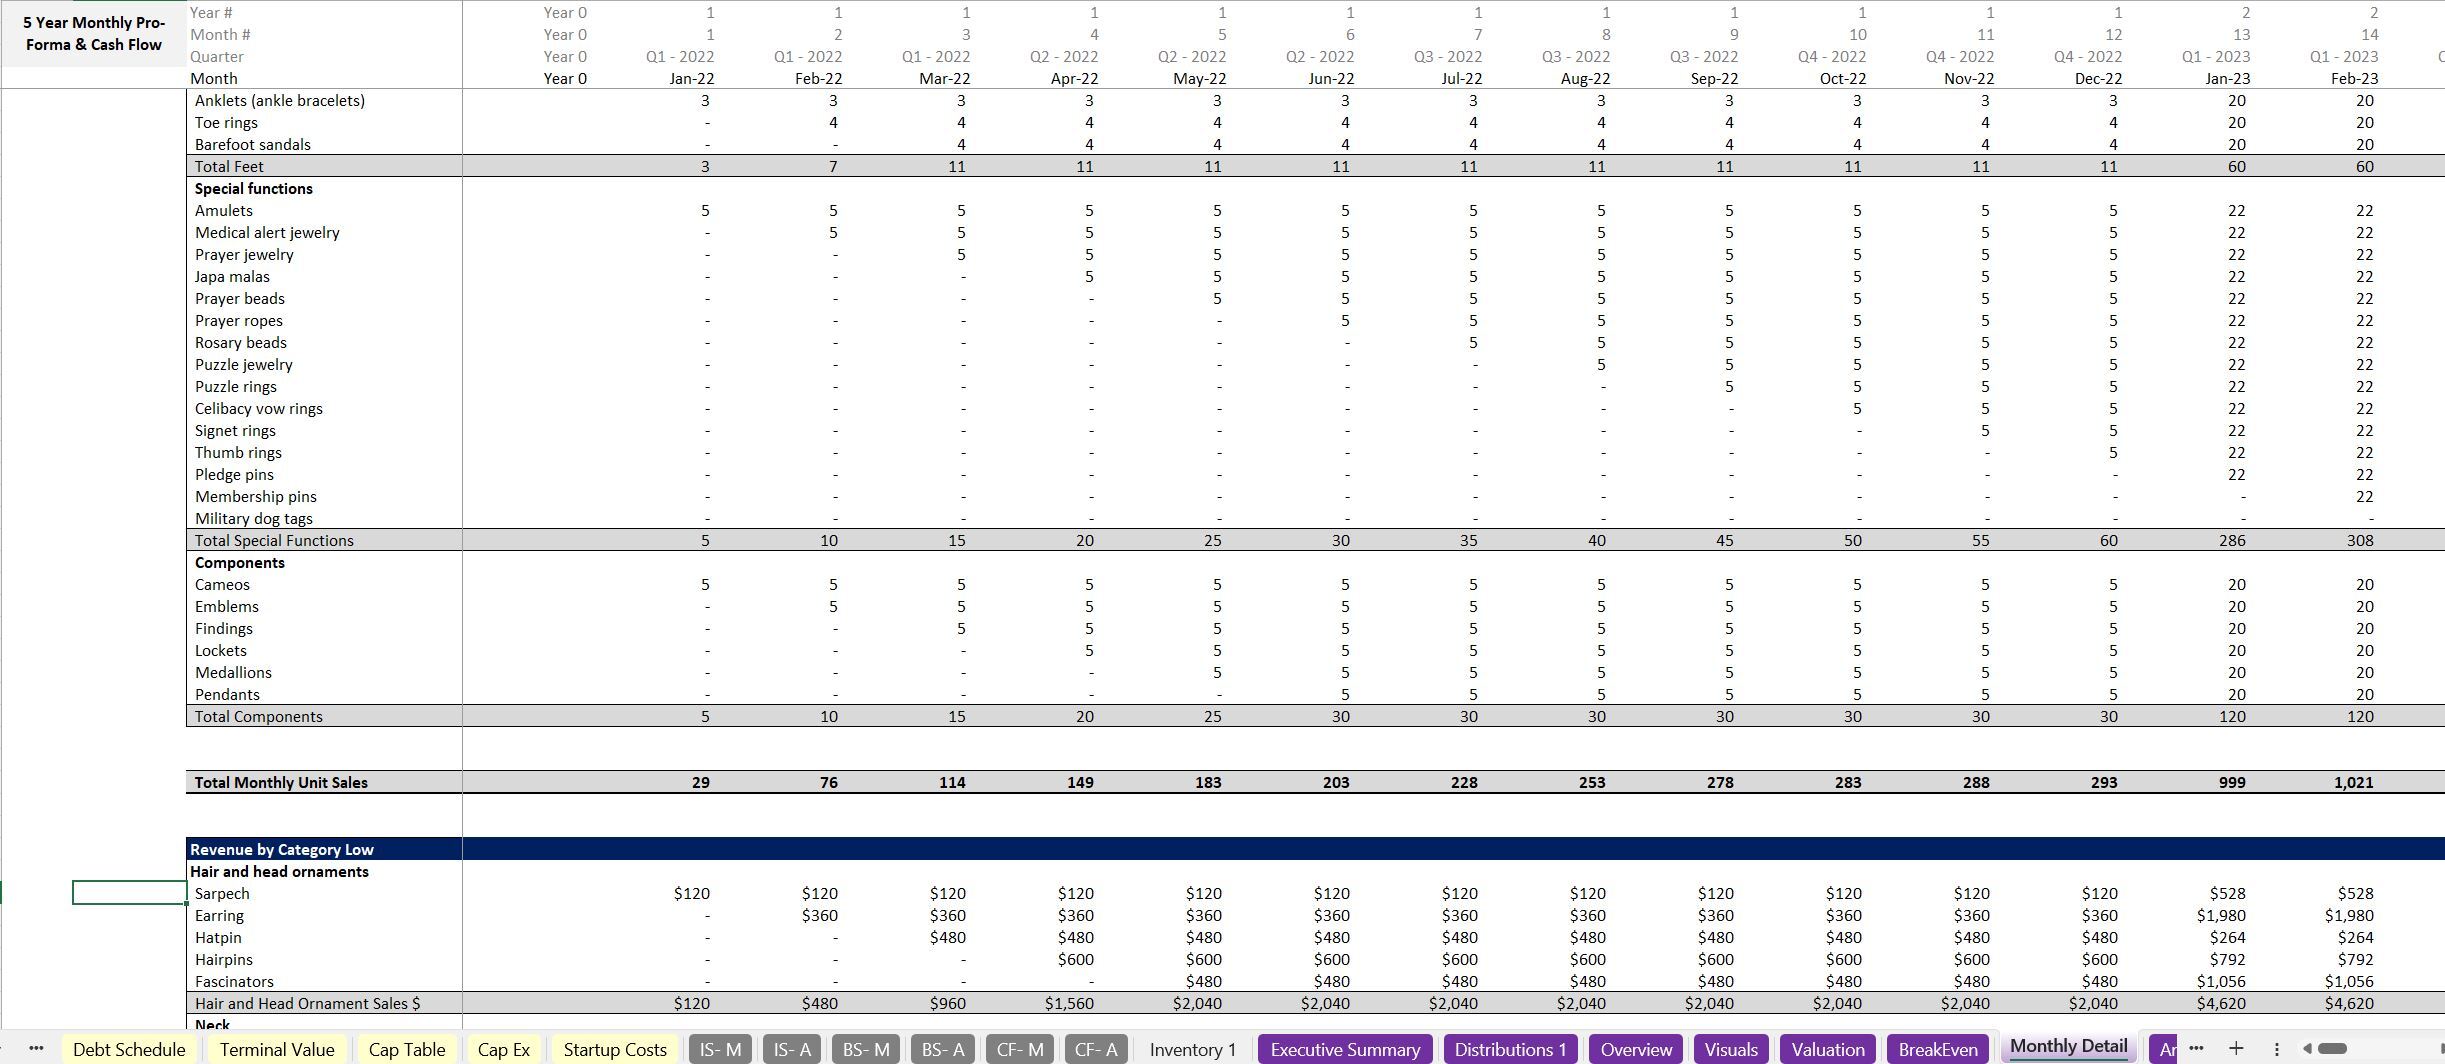
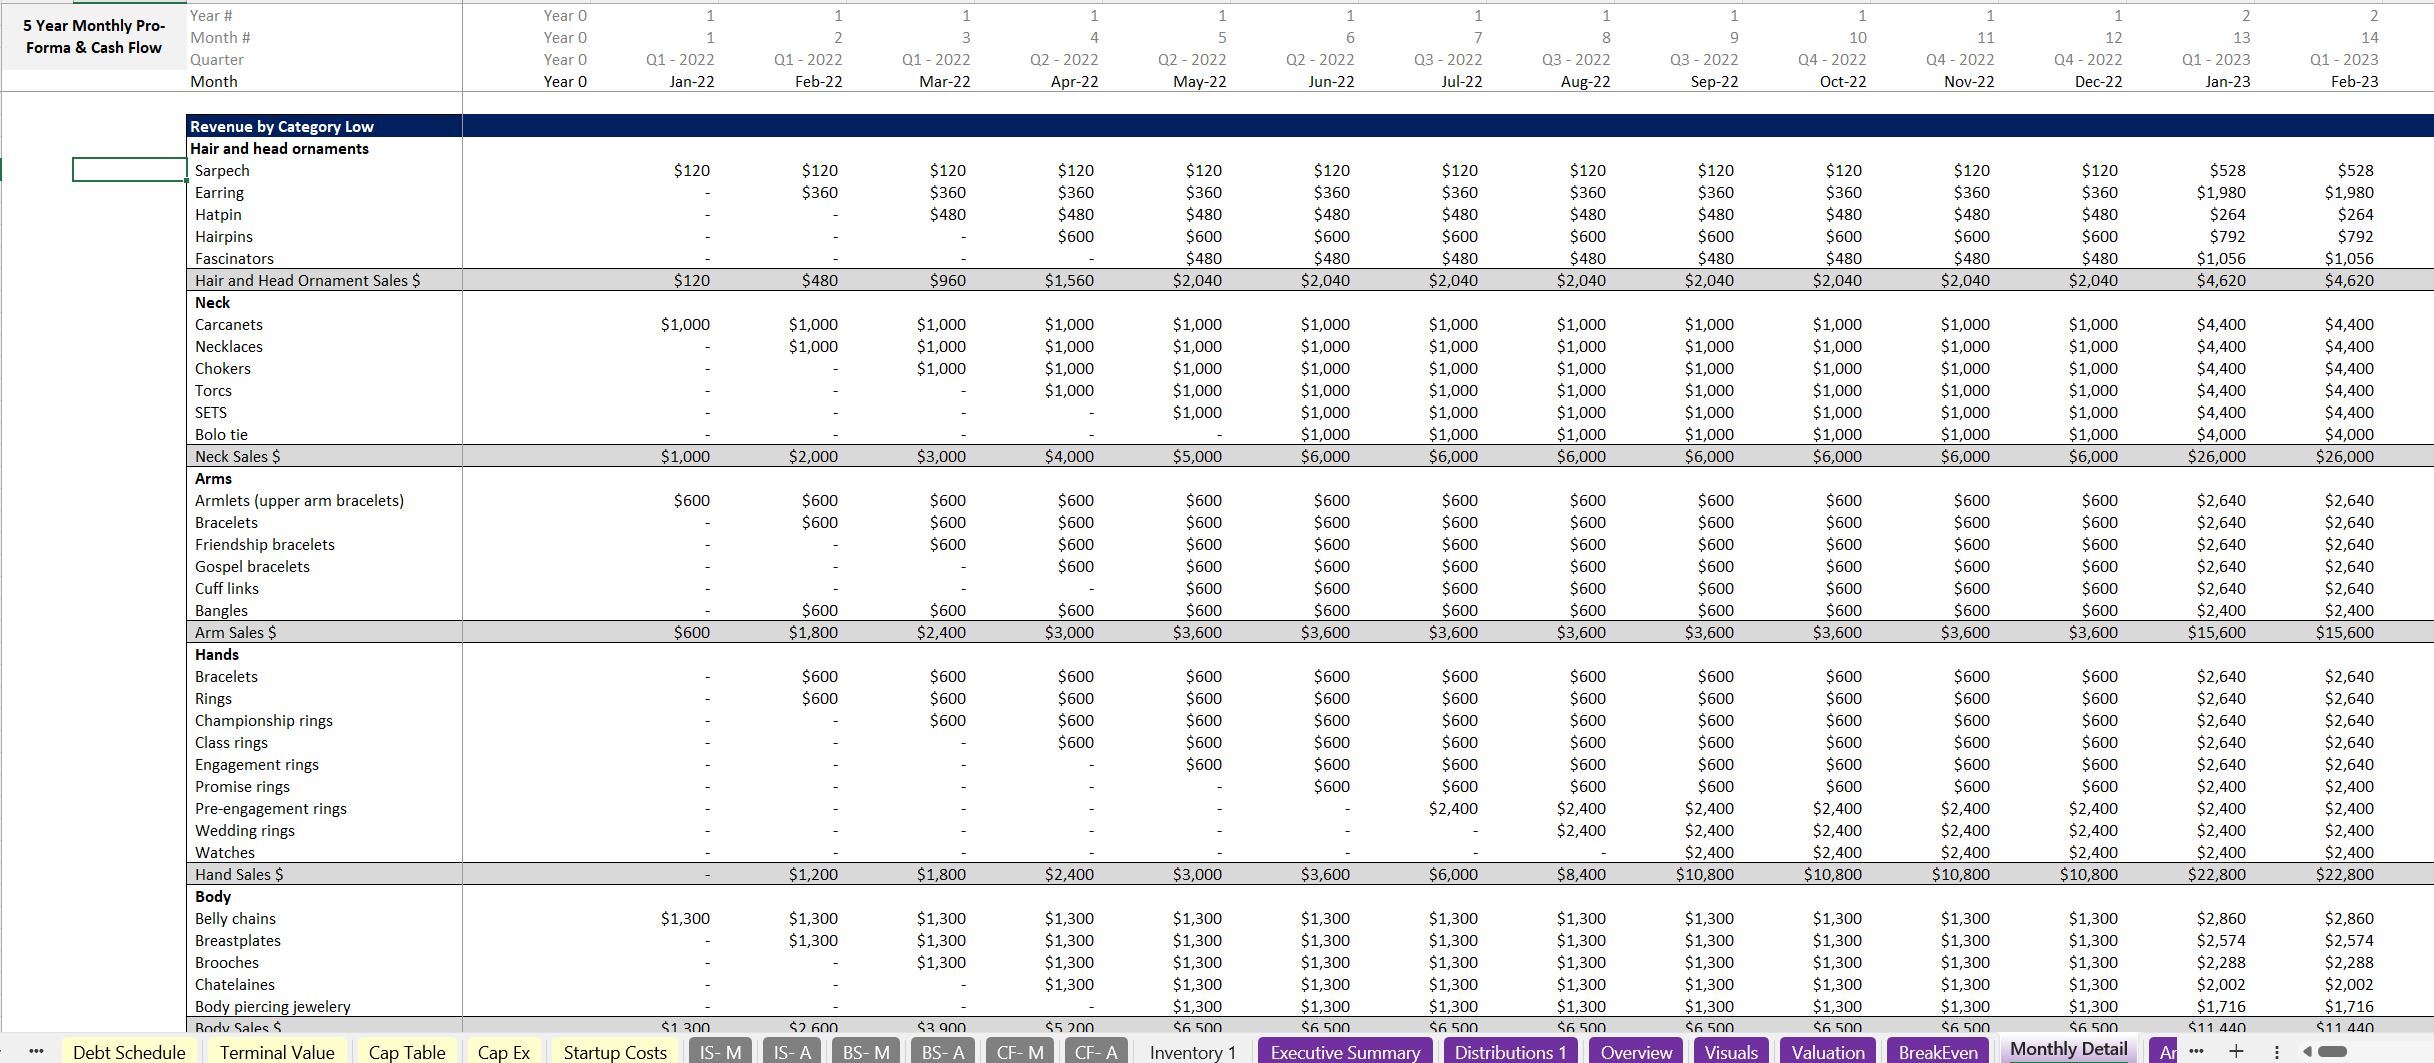
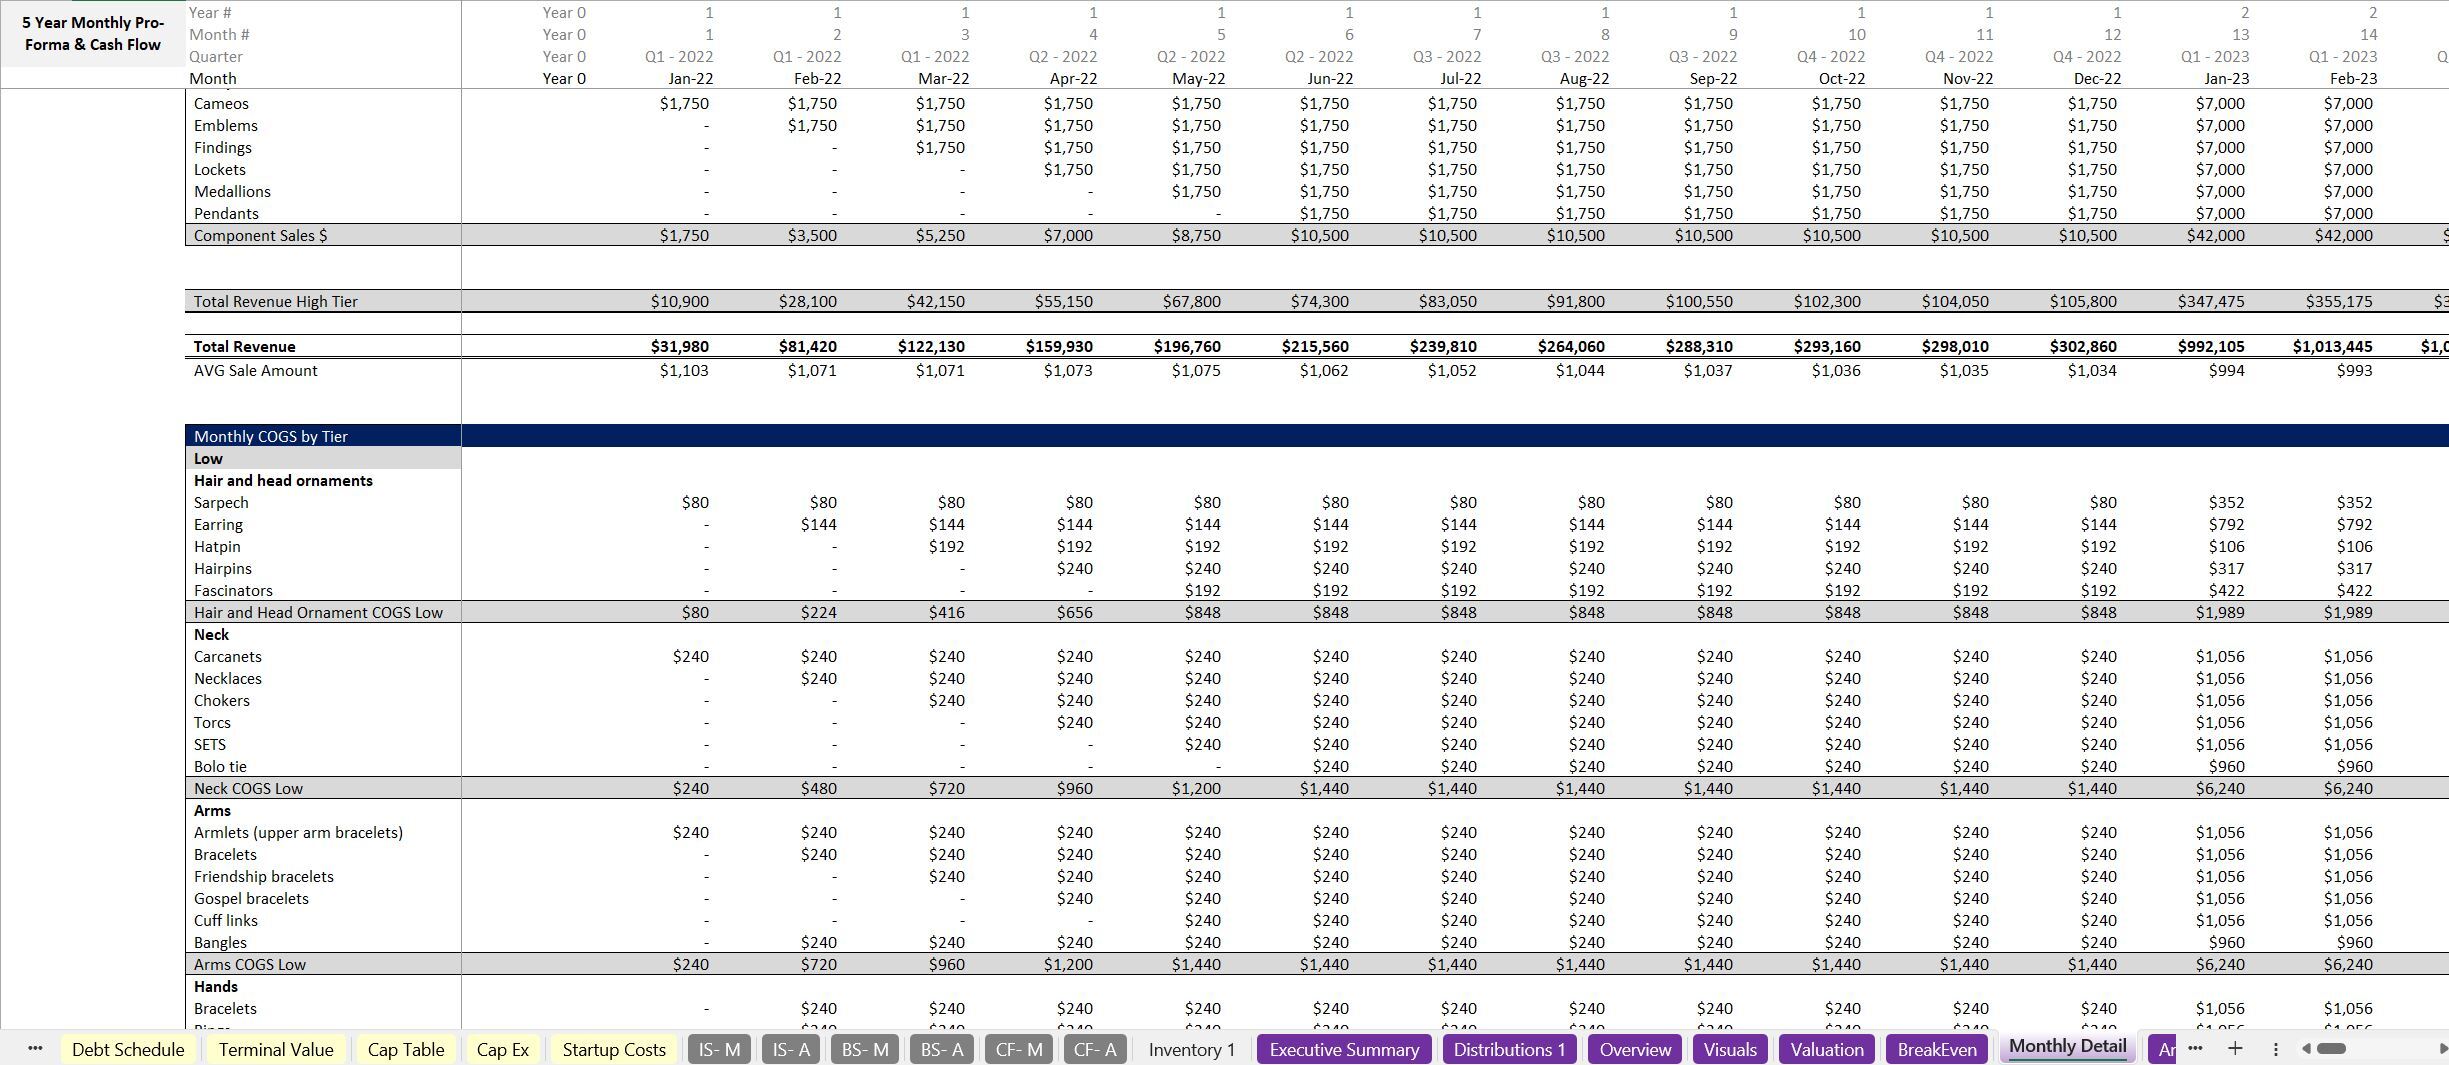
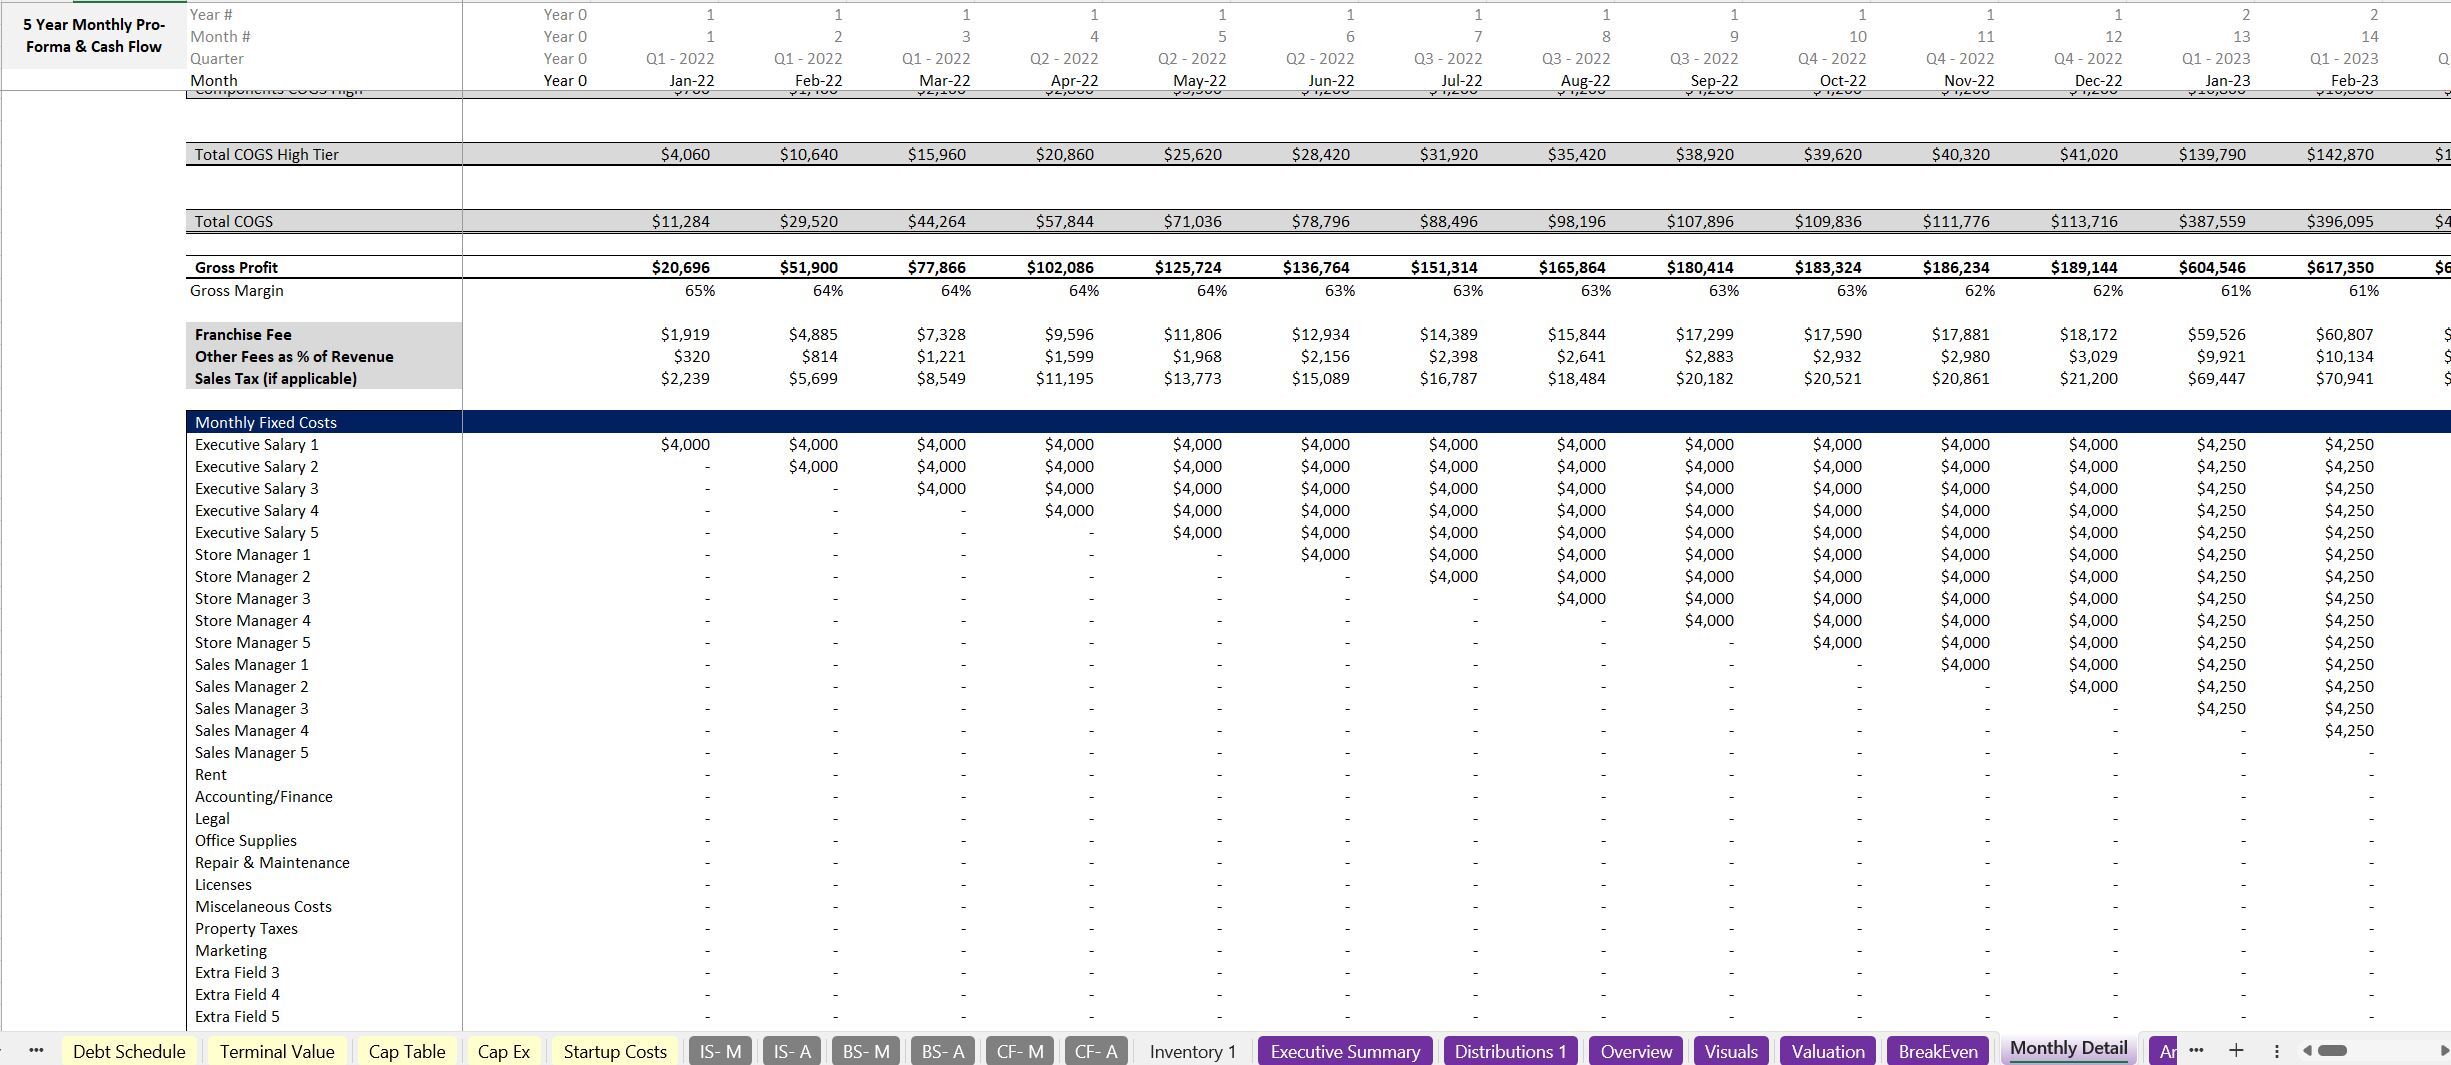
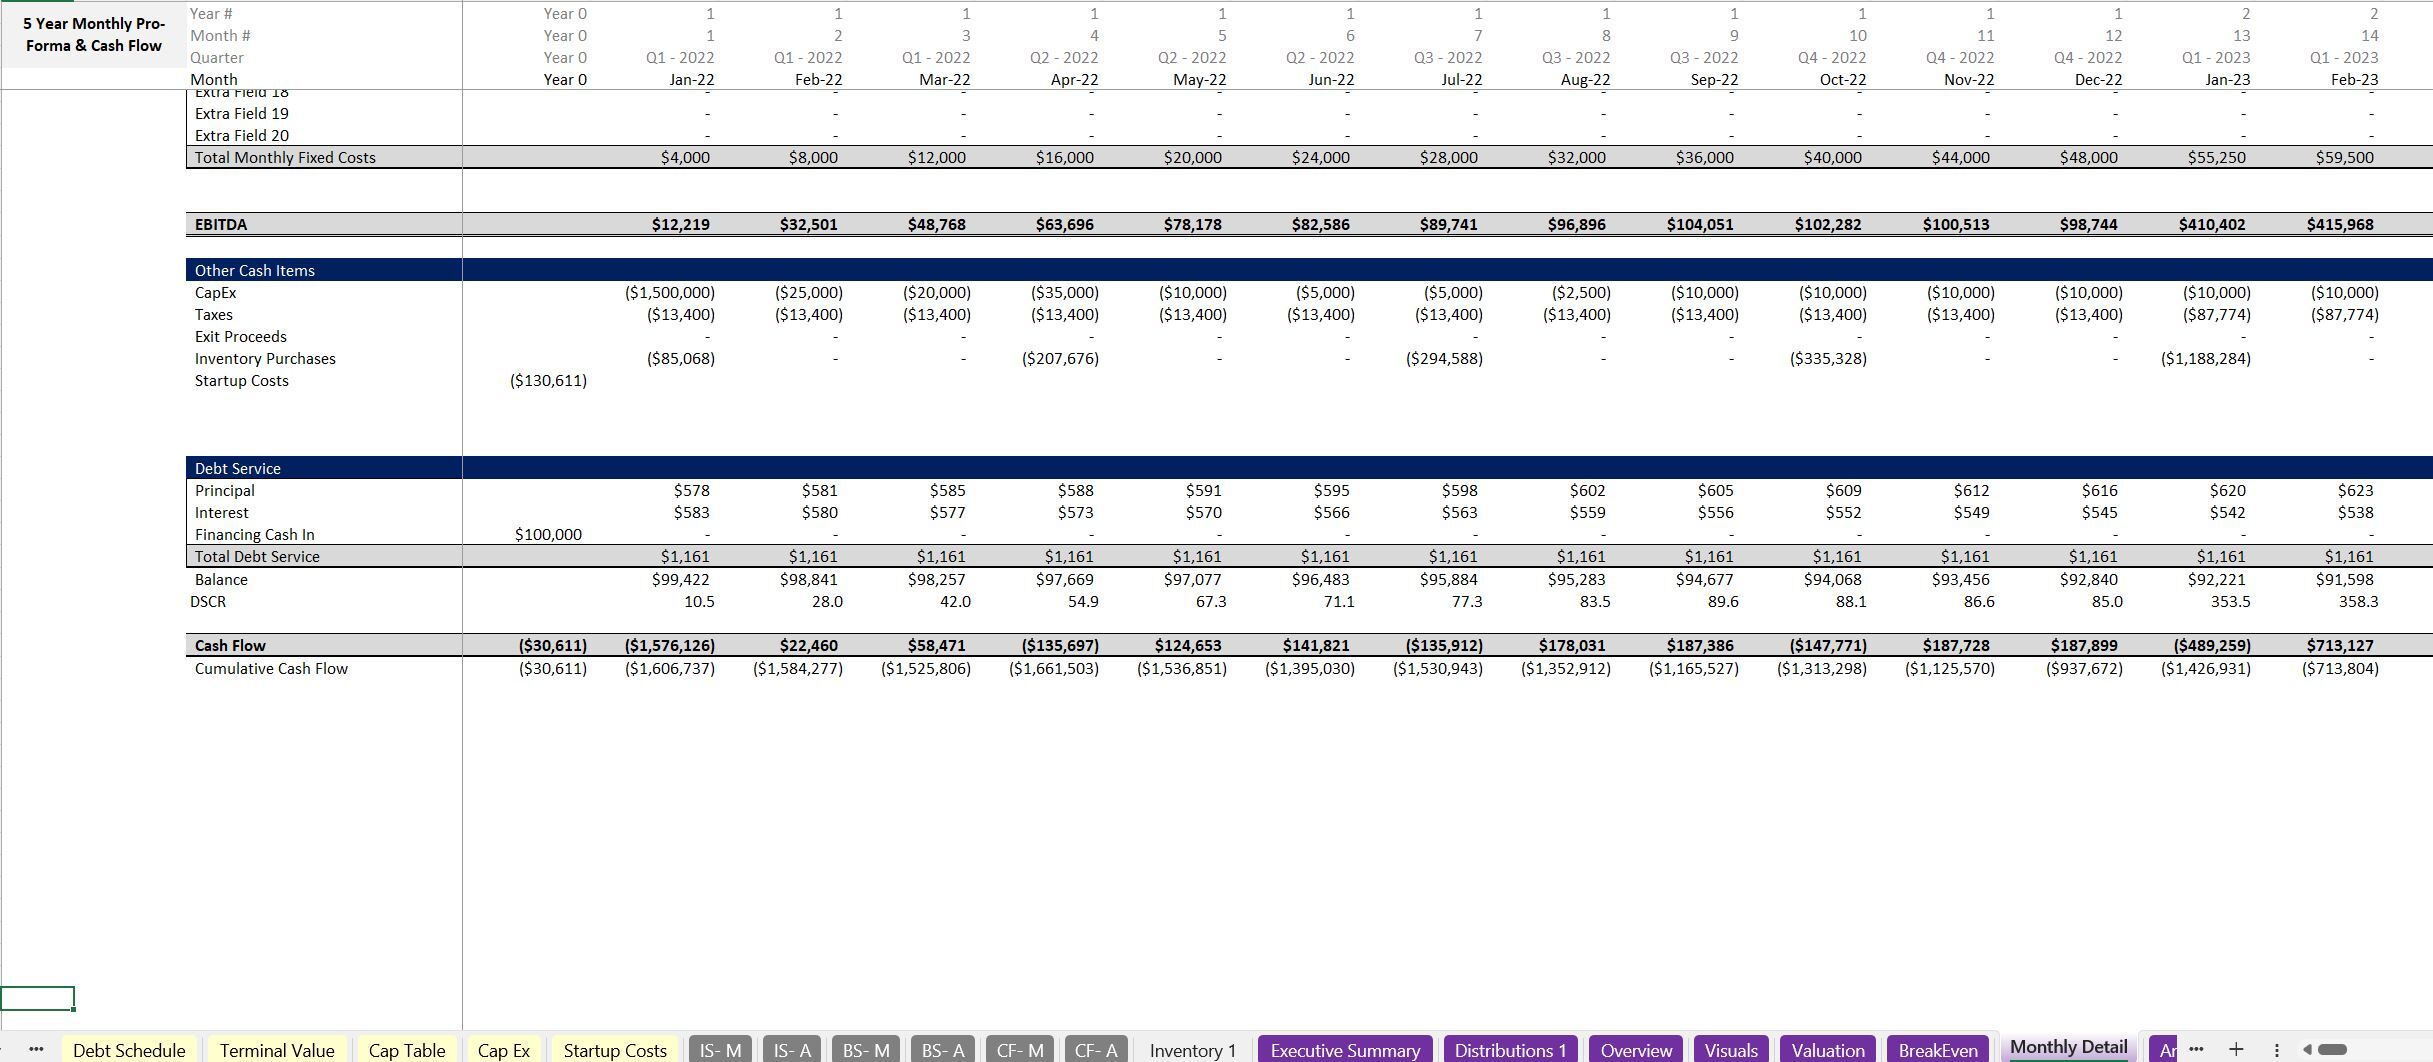
Retail Industry: 5-Year Financial Excel Model
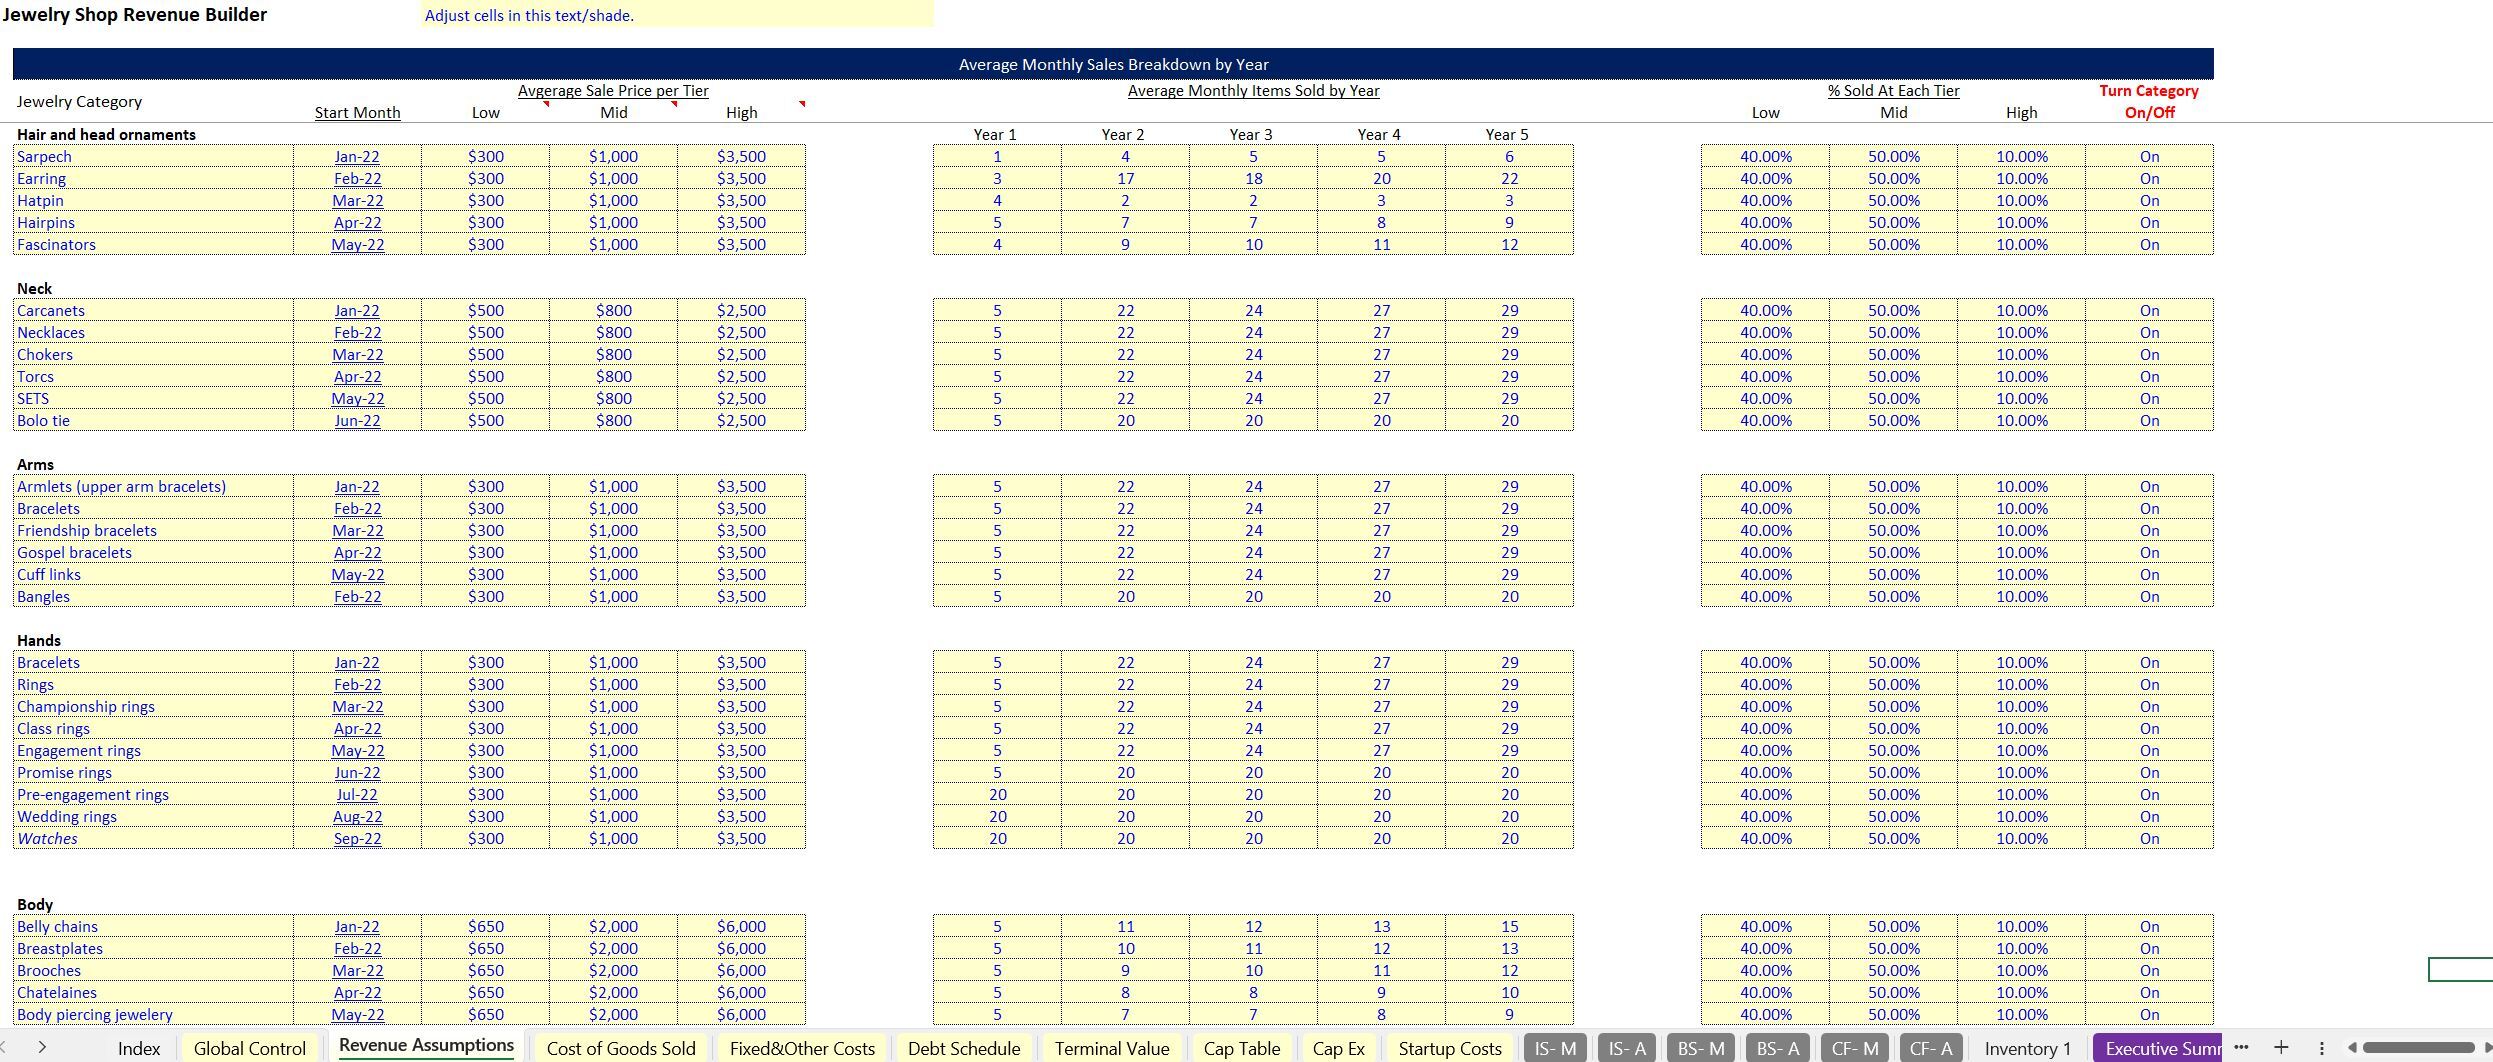
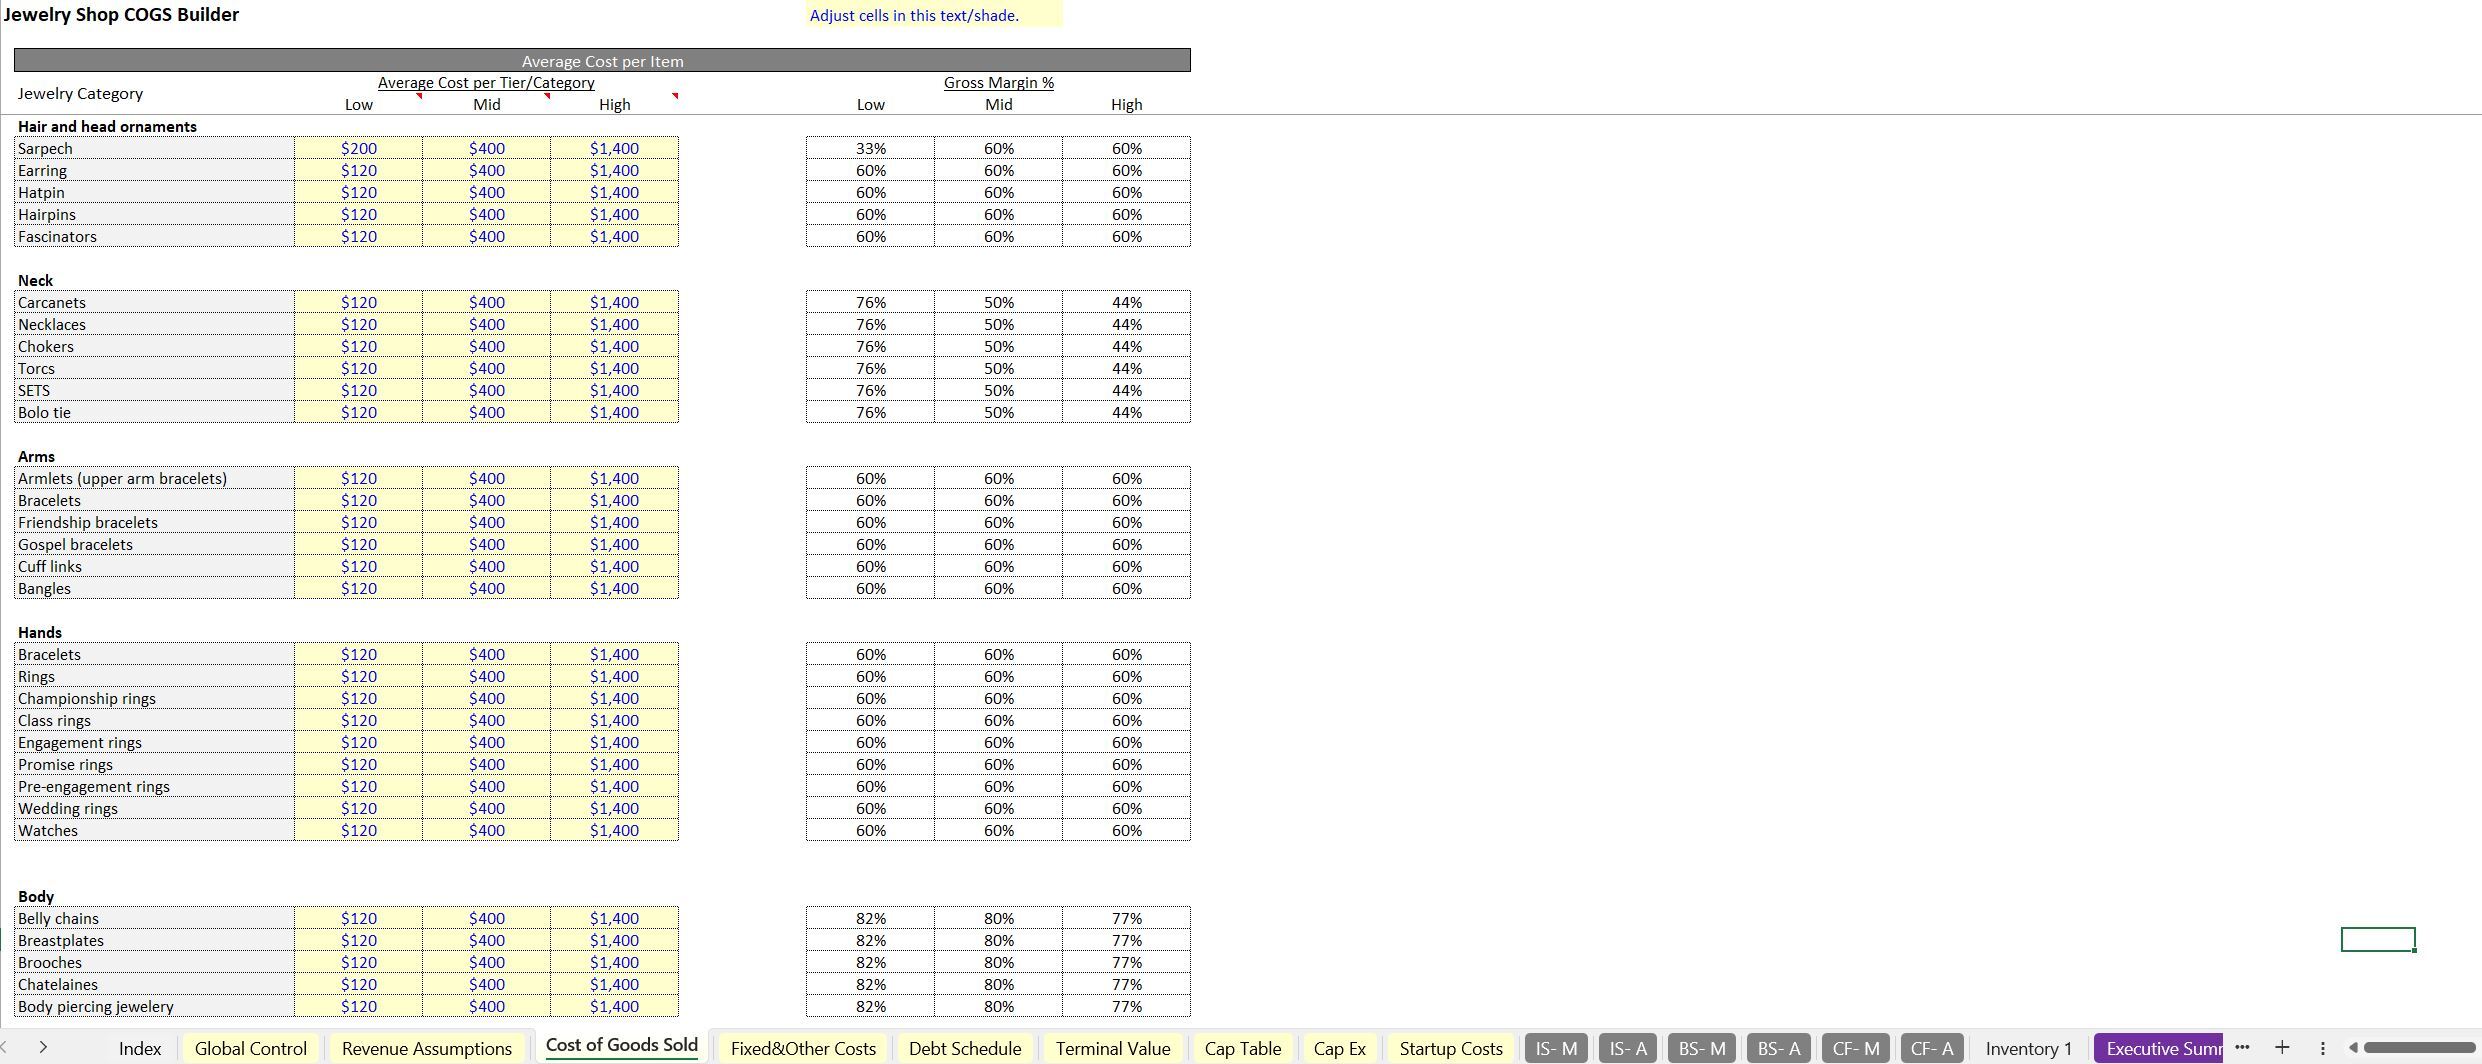
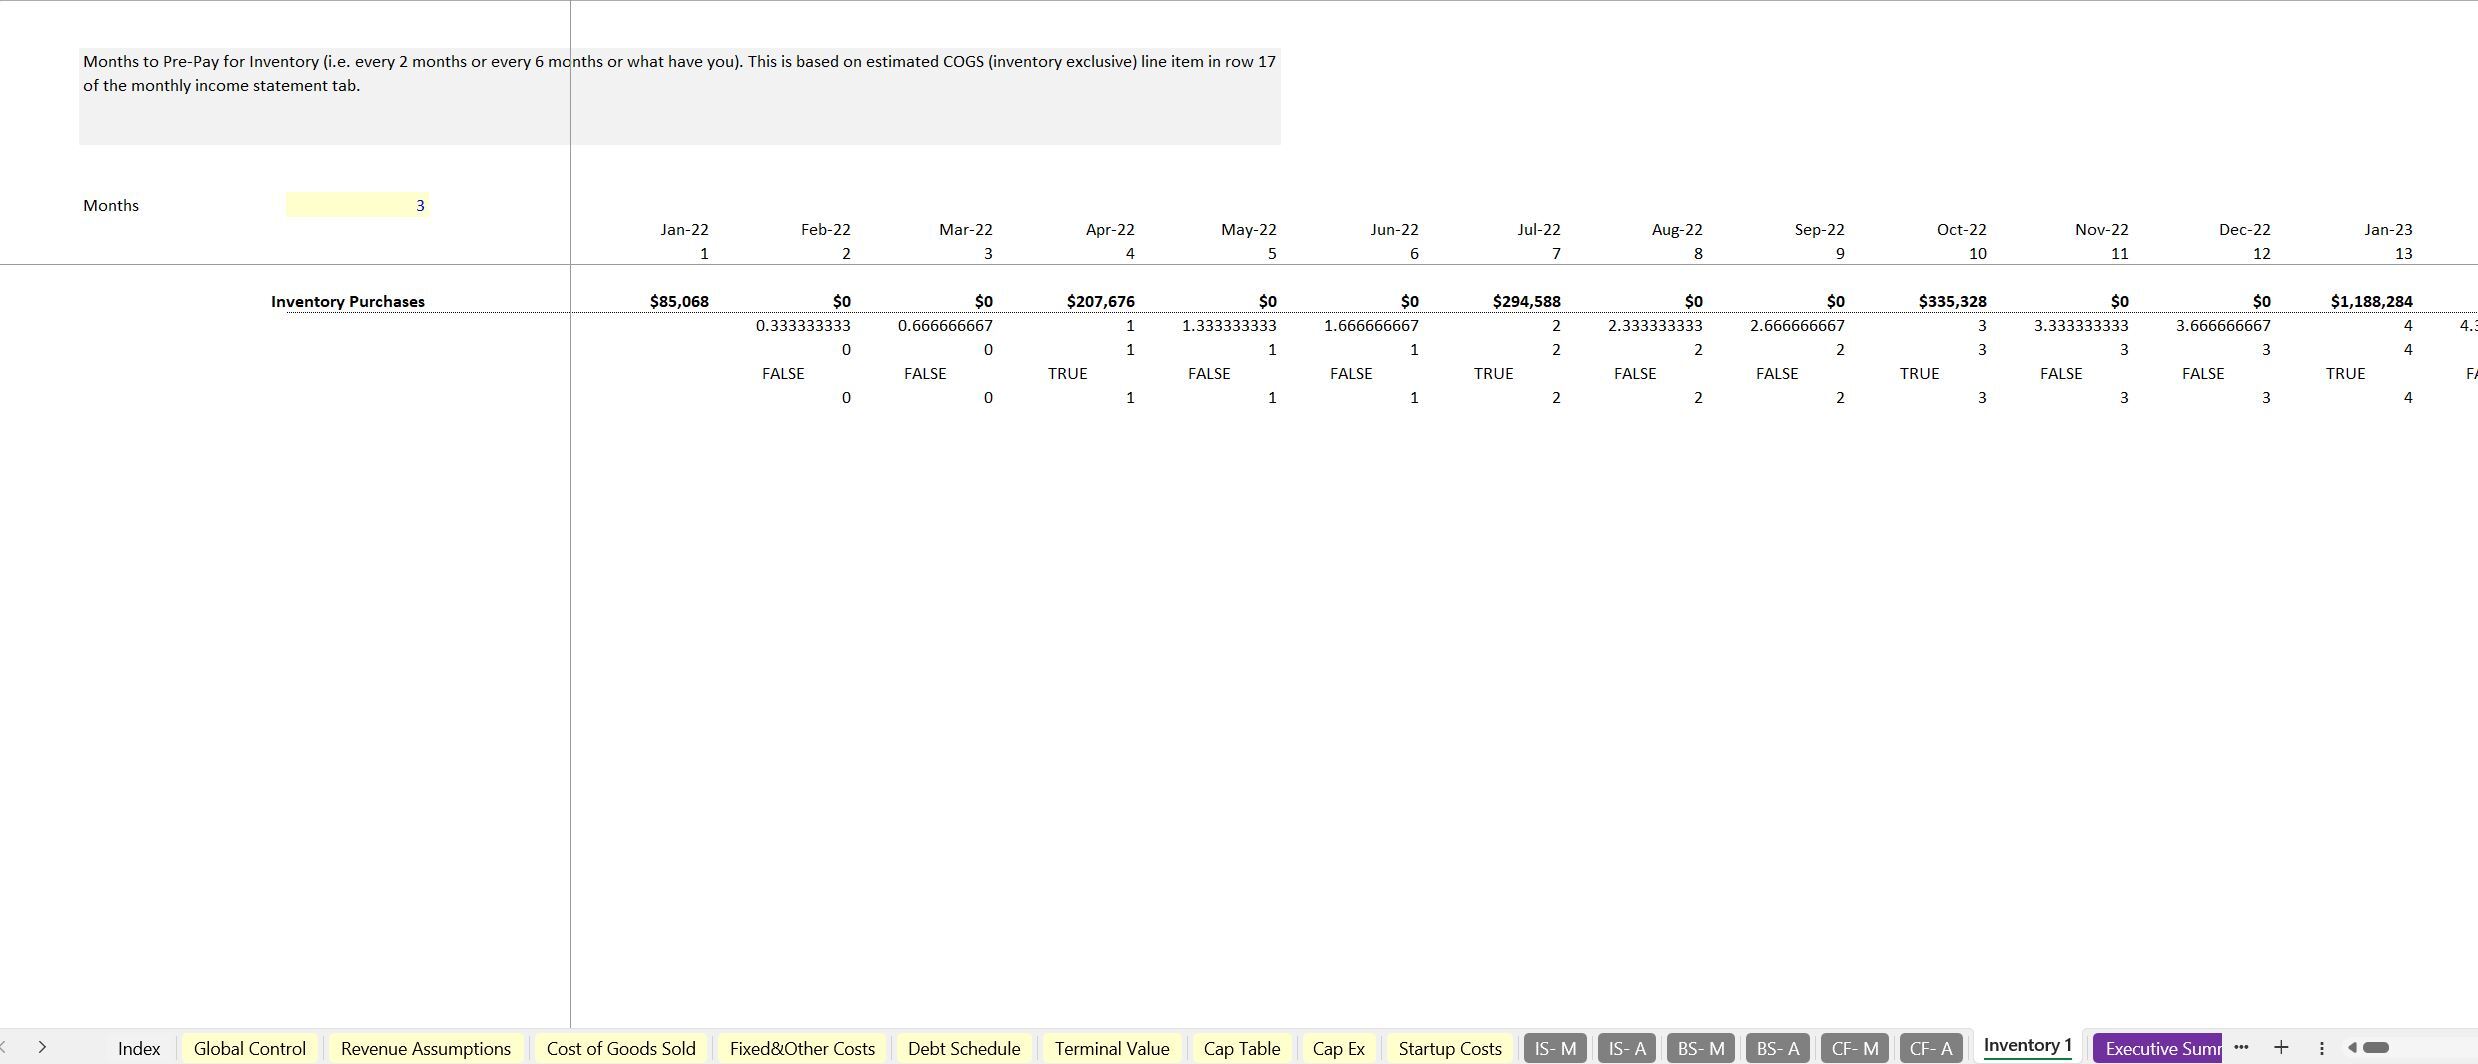
To forecast financial projections within any type of retail industry that sells various skus. Tailored to a jewelry shop. Includes 3-statement model.
Further information
Allow the user to build a case for a business that sells retail products to consumers.
When there are no more than 8 high level categories and no more than 55 sub-categories.
Non-retail businesses.
