

Originally published: 27/05/2020 09:21
Last version published: 02/01/2024 09:49
Publication number: ELQ-78481-5
View all versions & Certificate
Last version published: 02/01/2024 09:49
Publication number: ELQ-78481-5
View all versions & Certificate

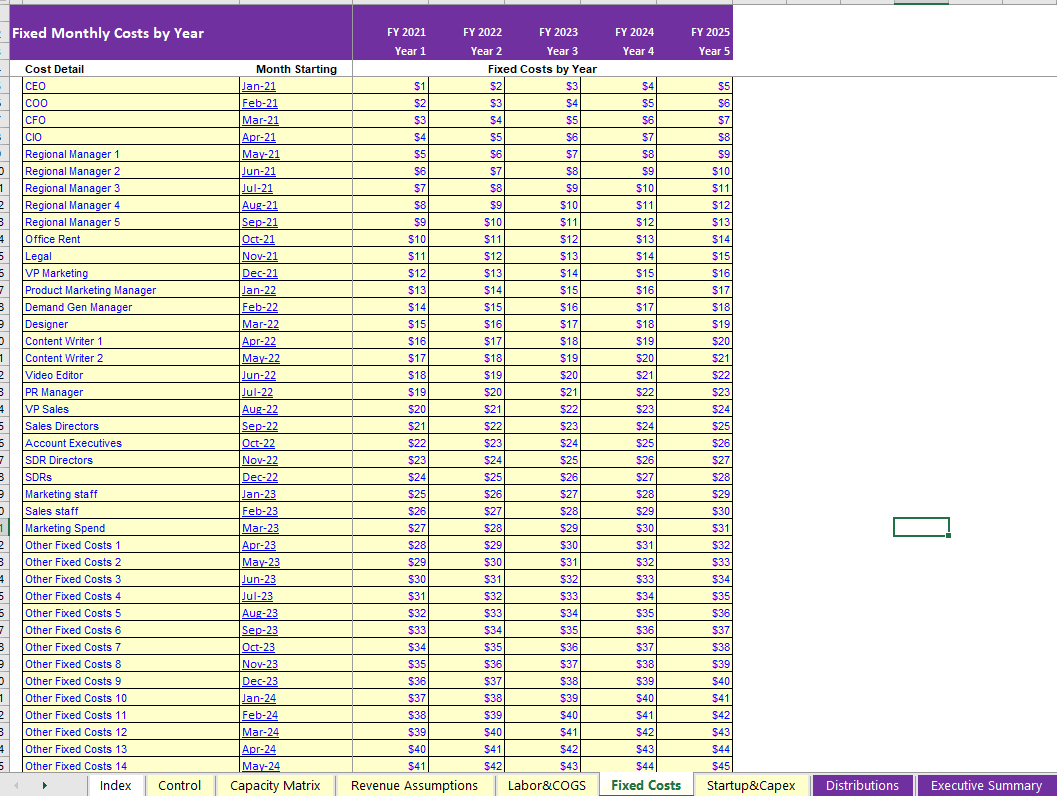
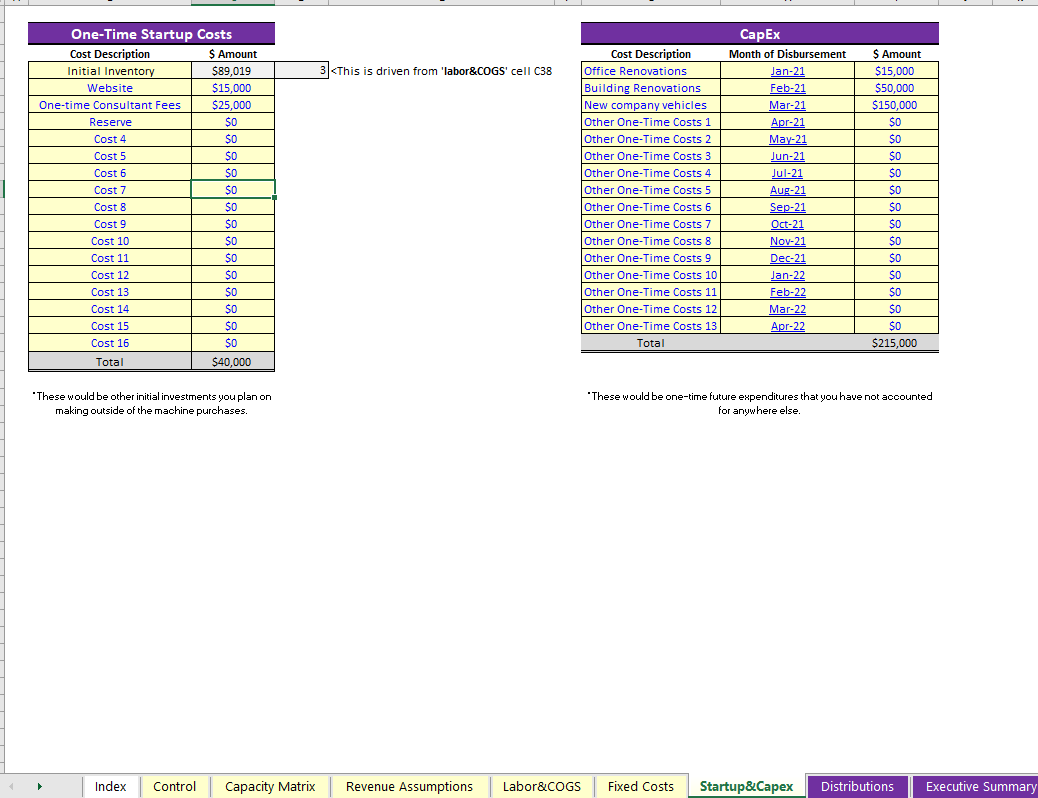
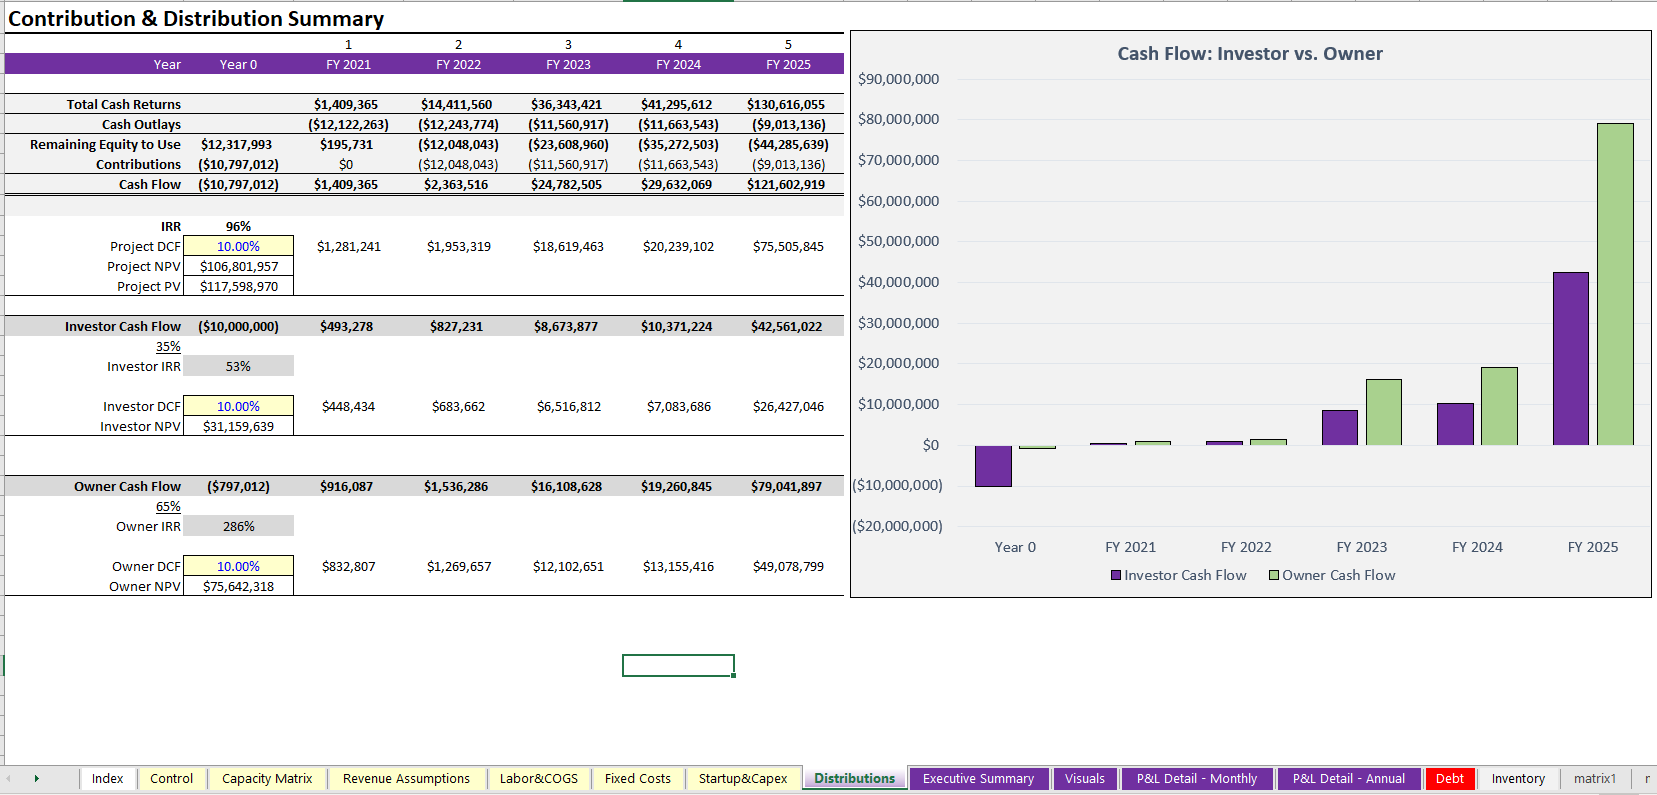
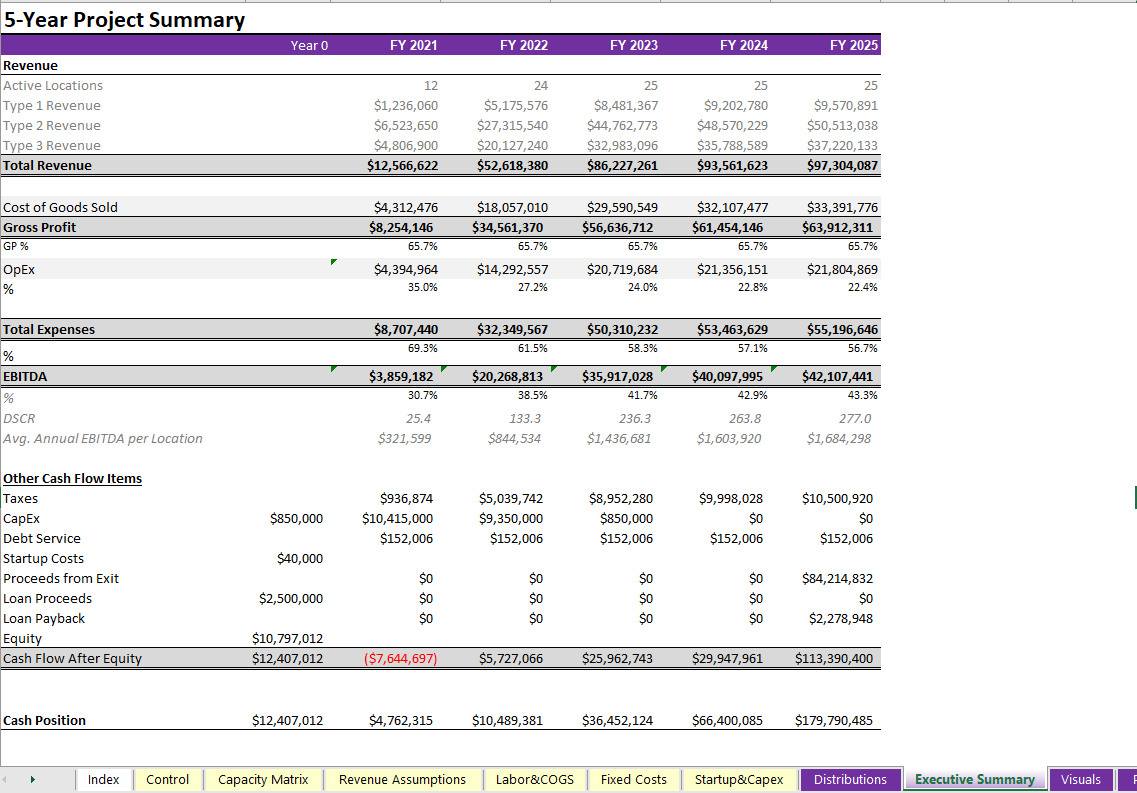
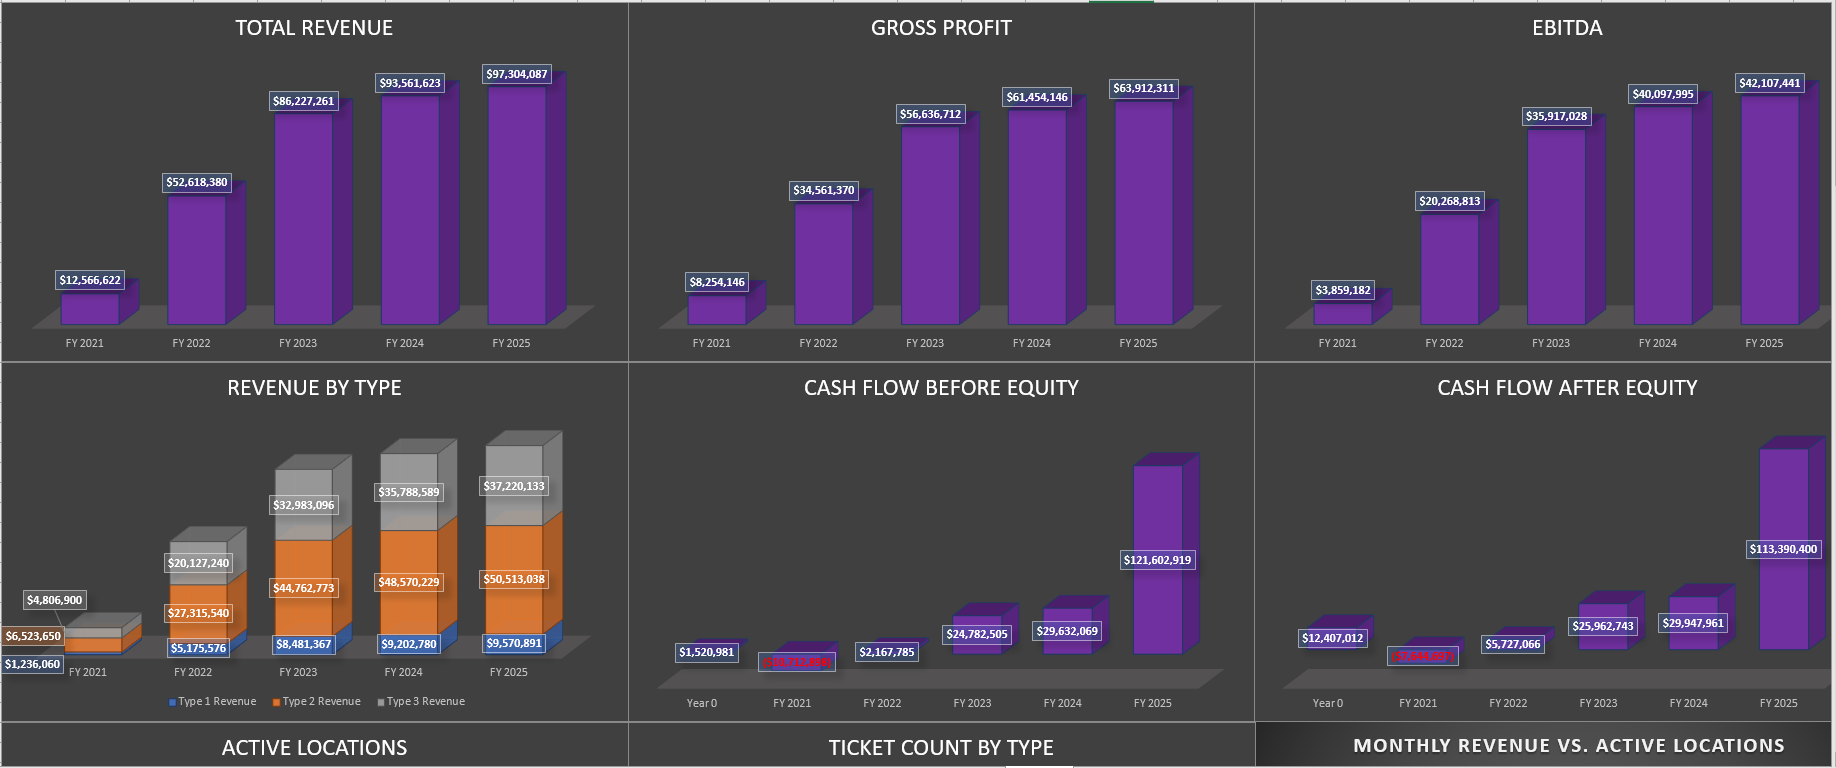
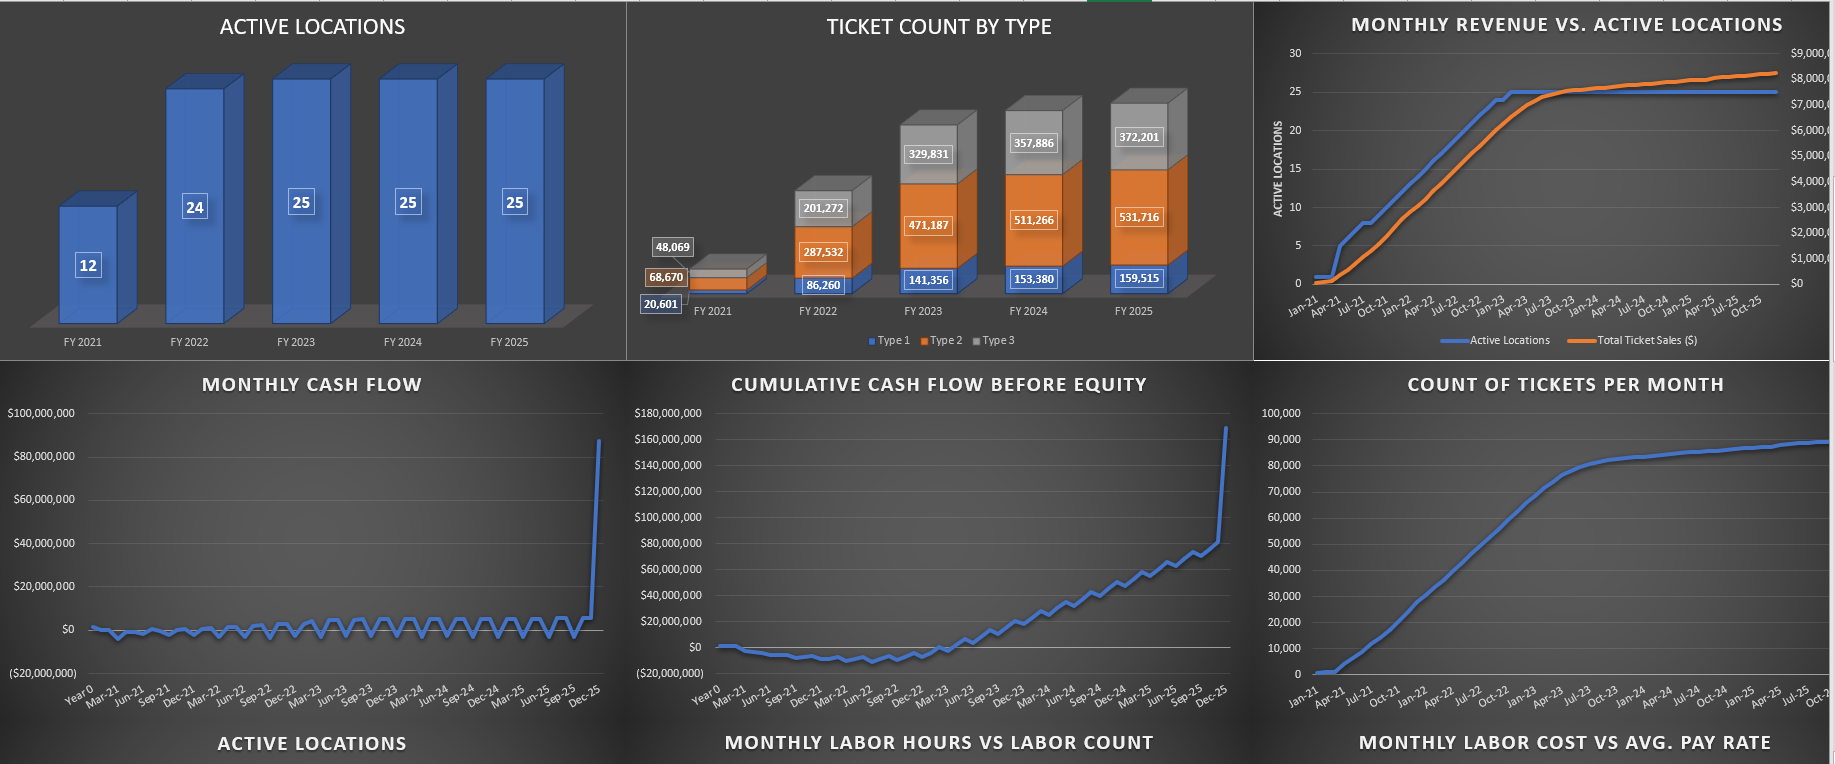
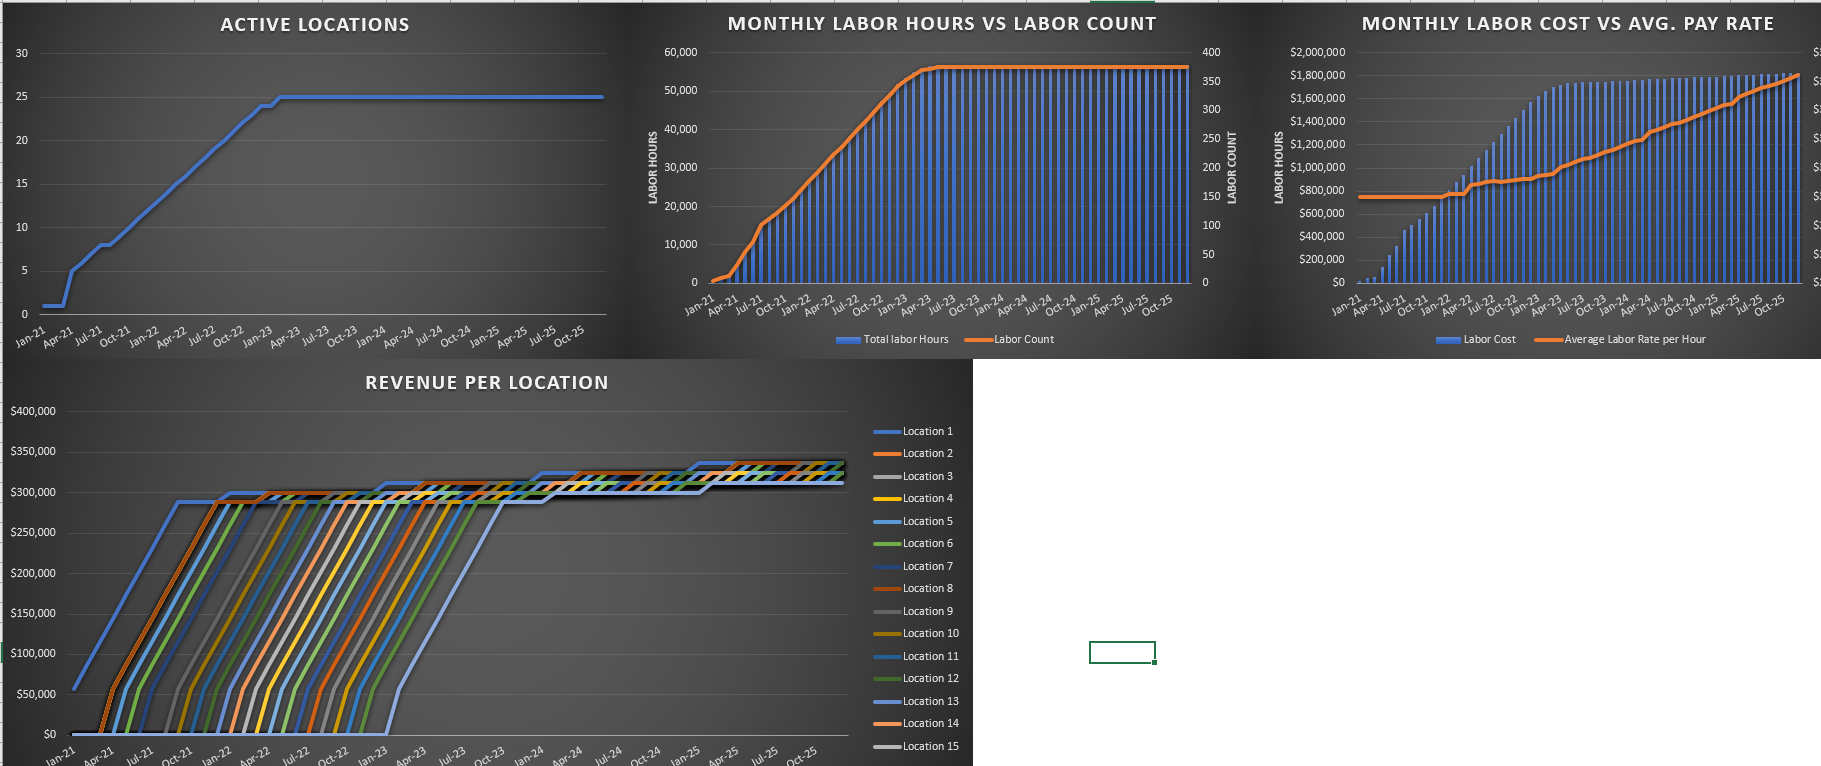
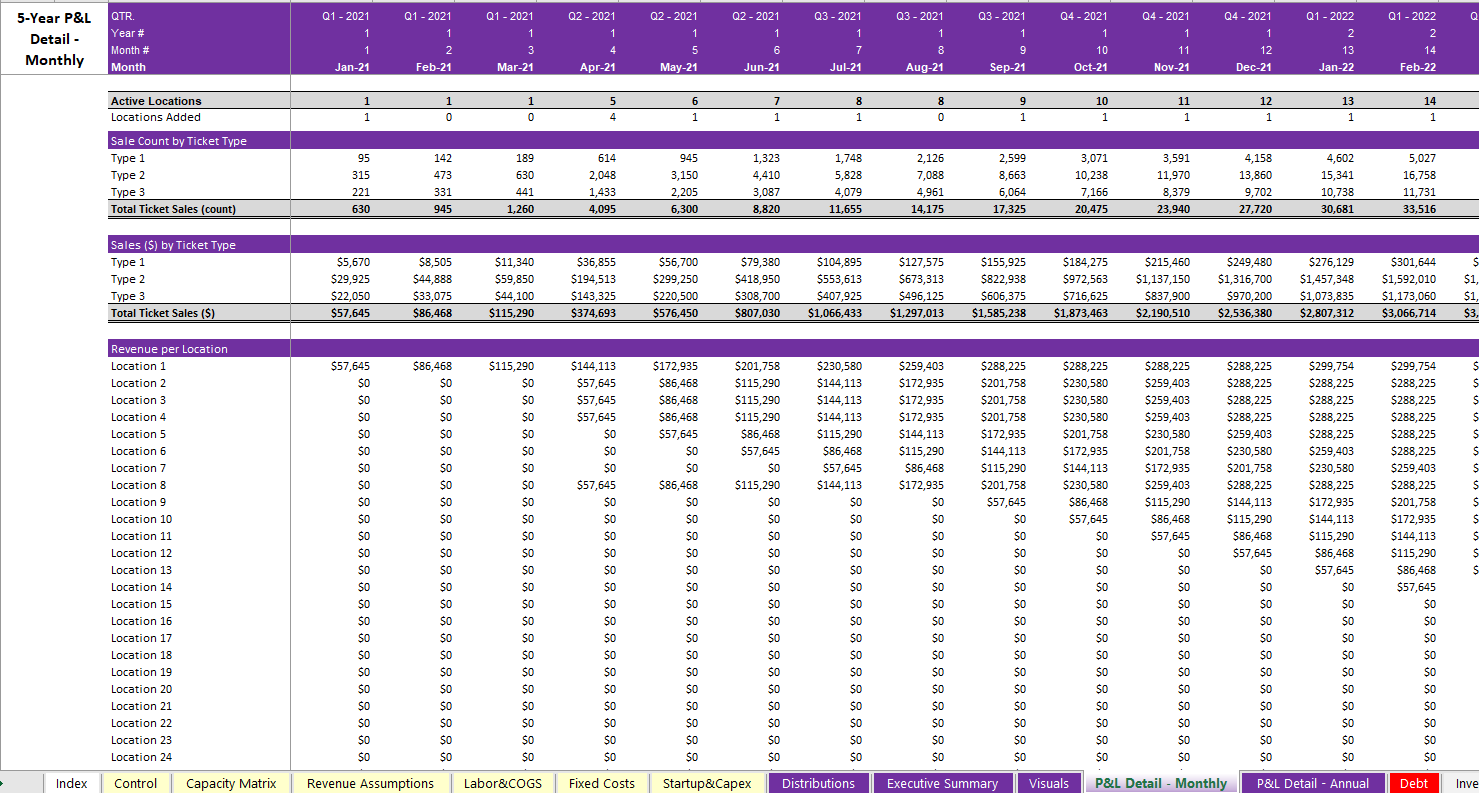
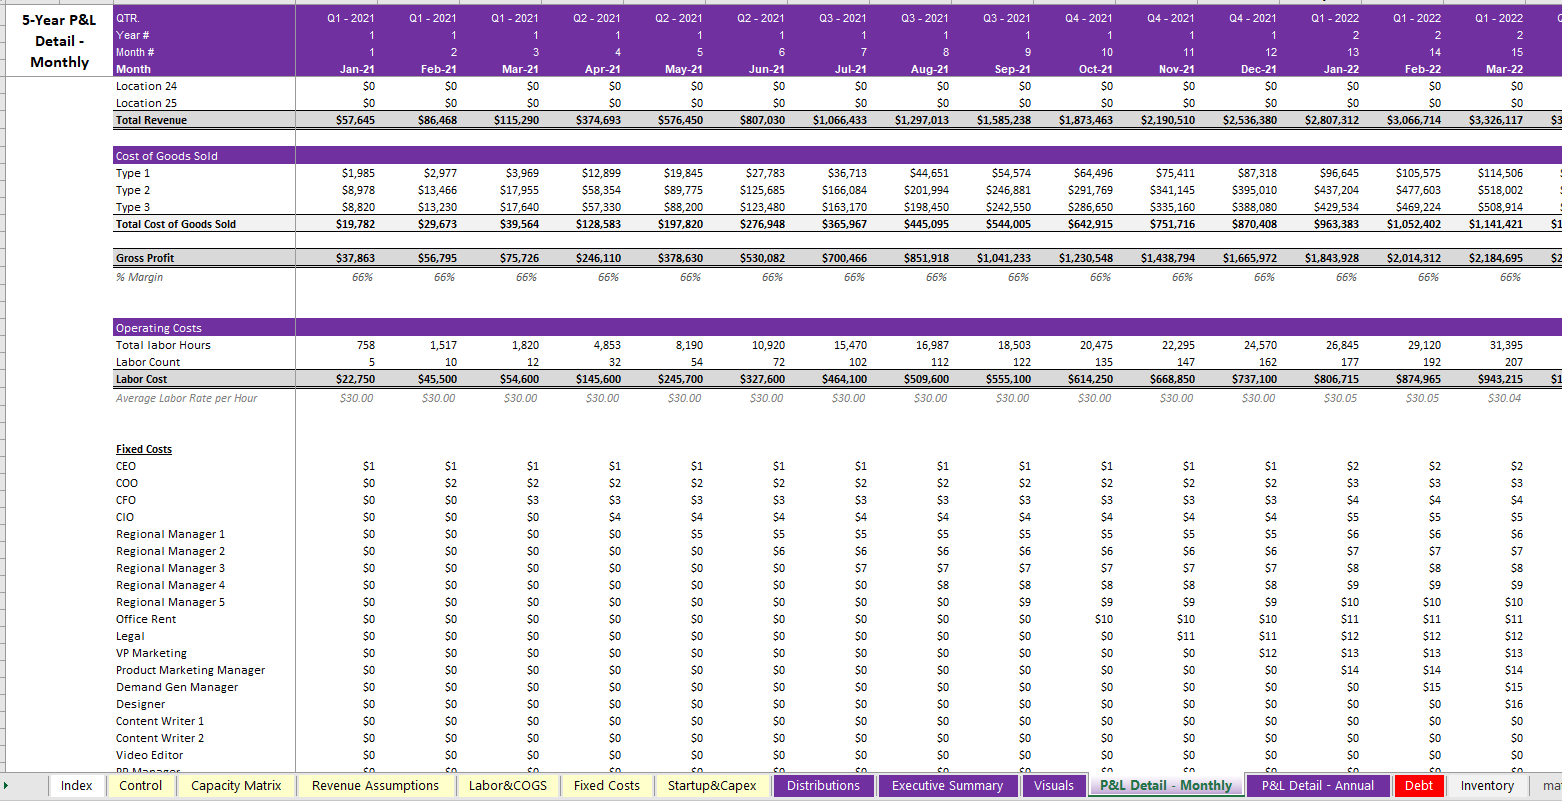
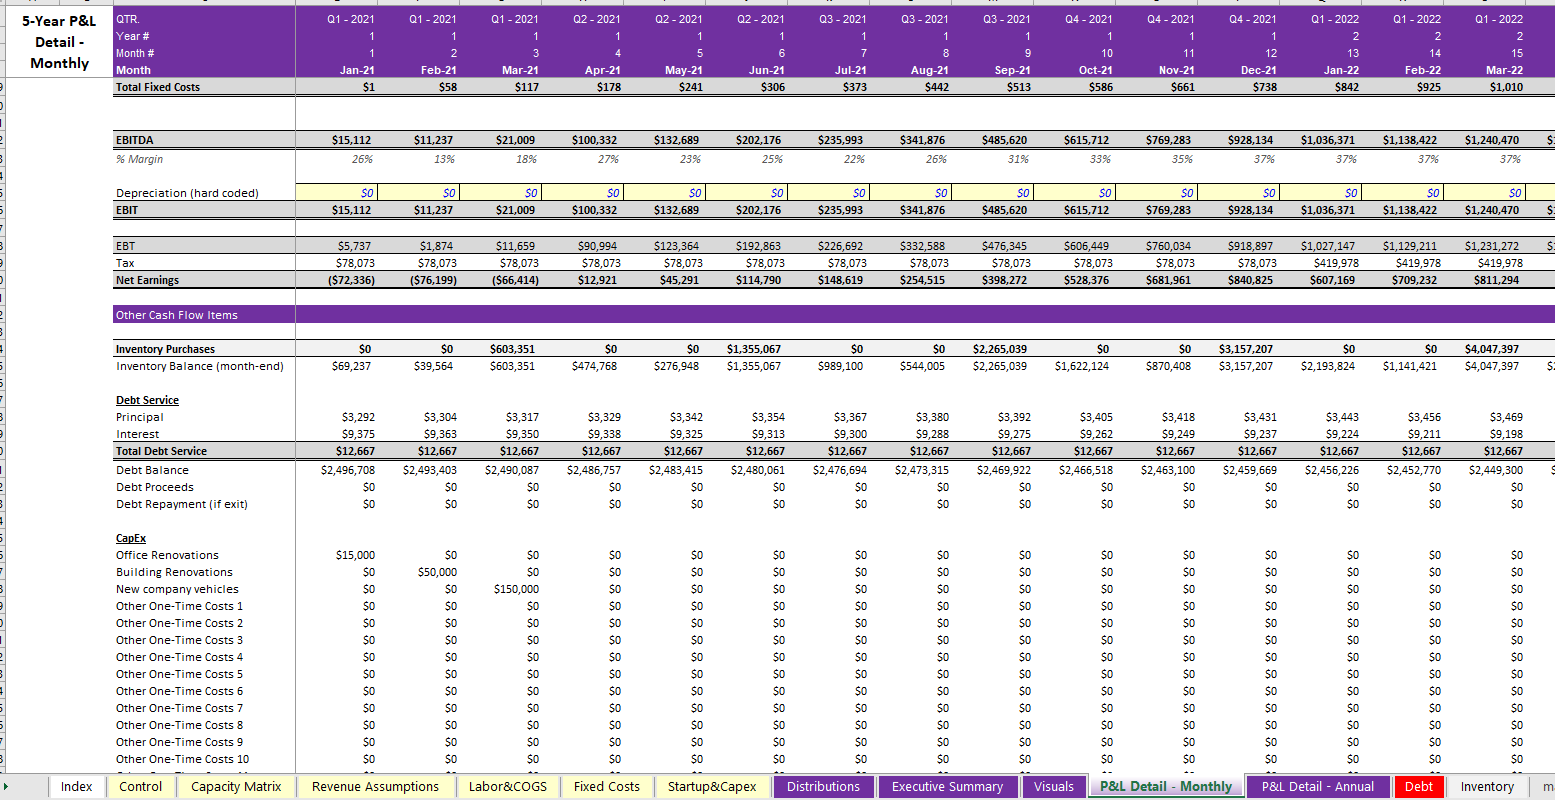
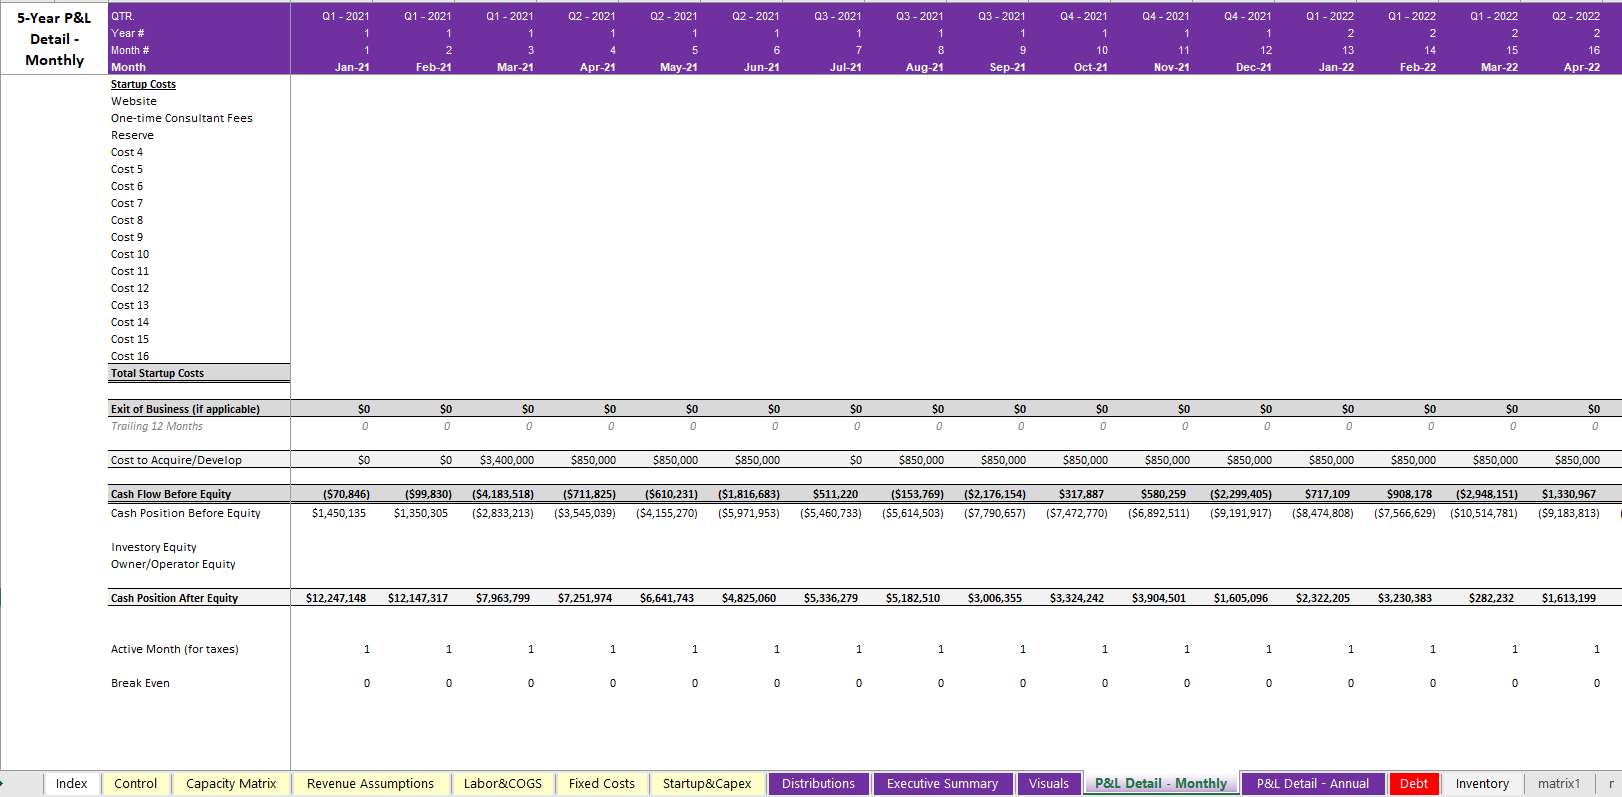
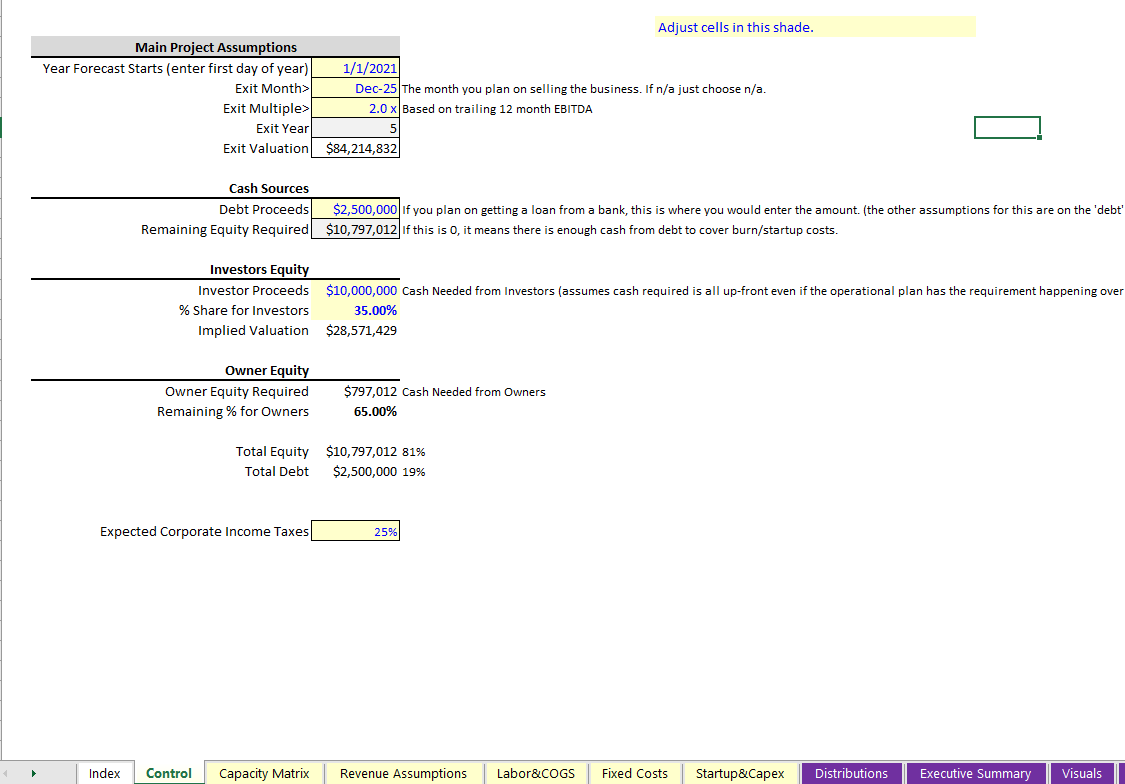
General Retail Model - Dynamic Scaling Logic
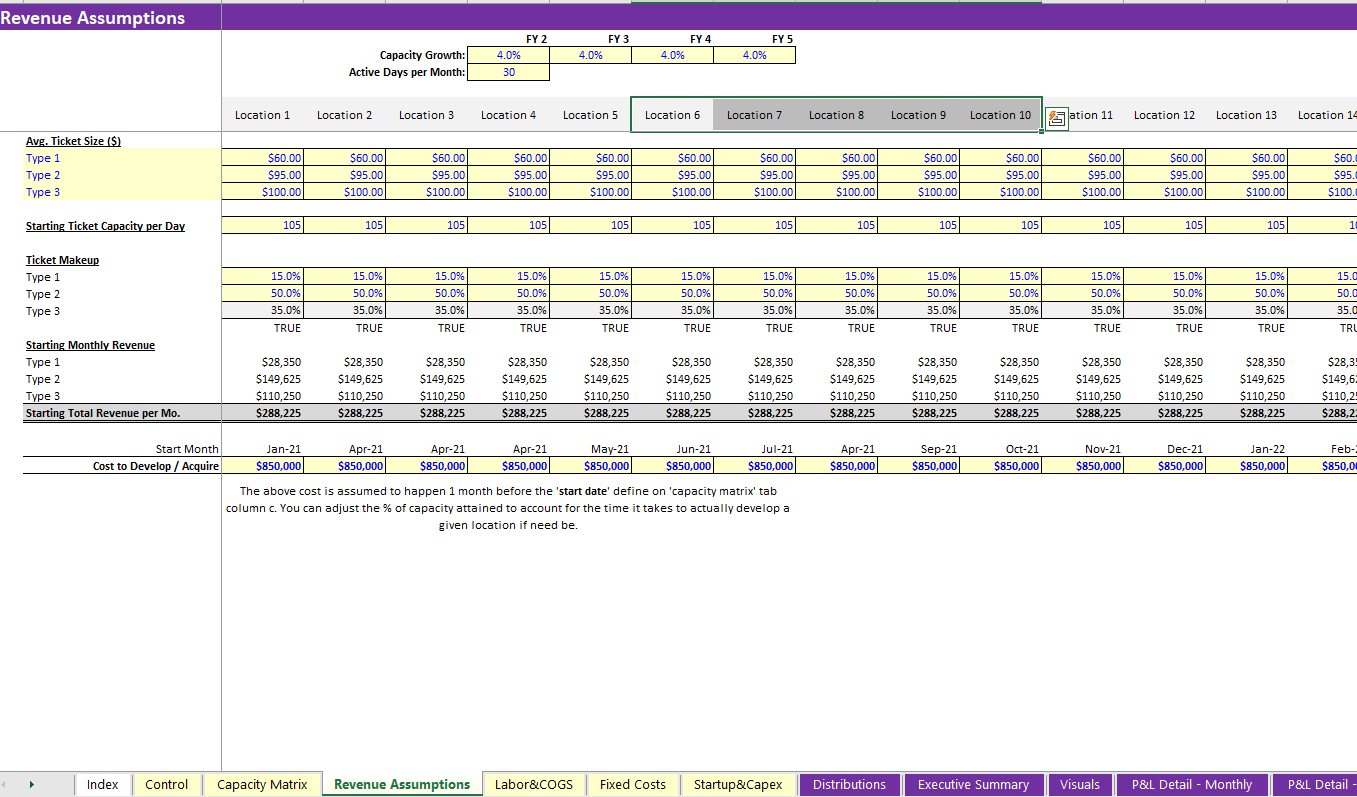
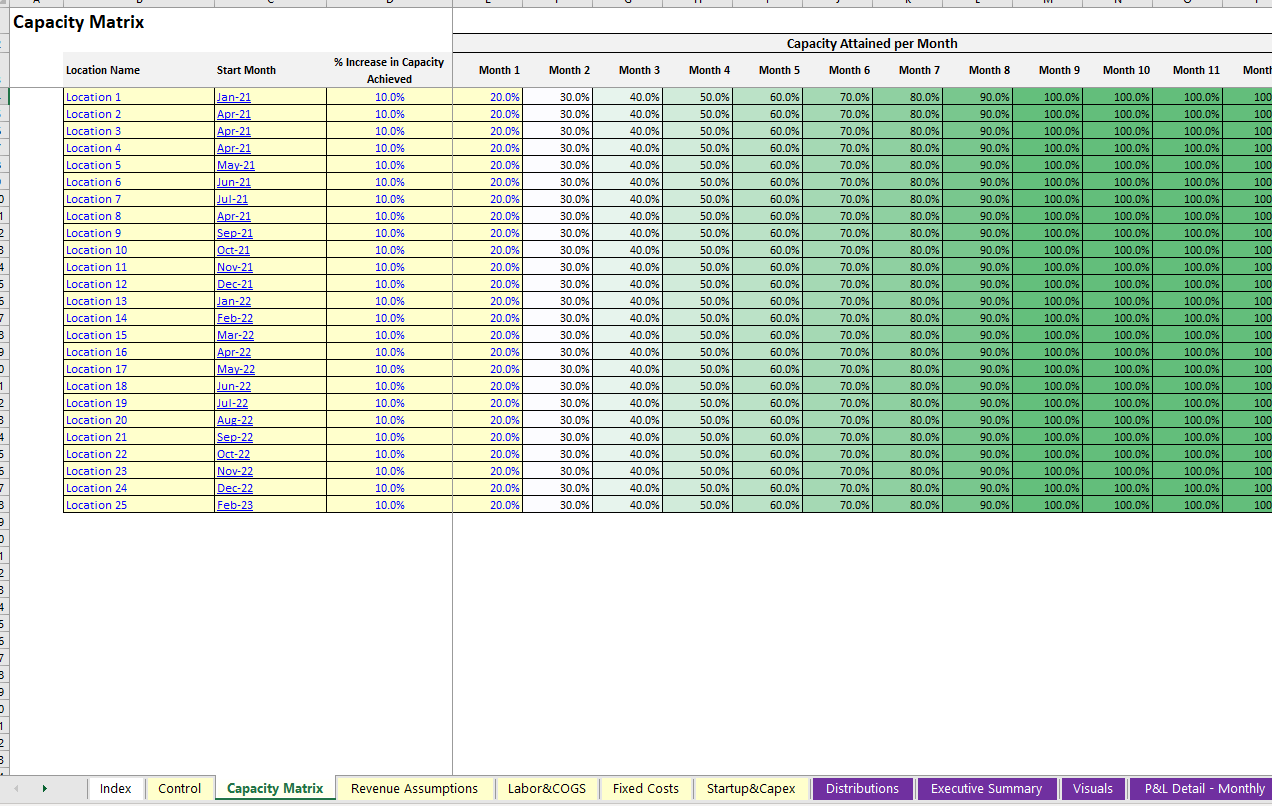
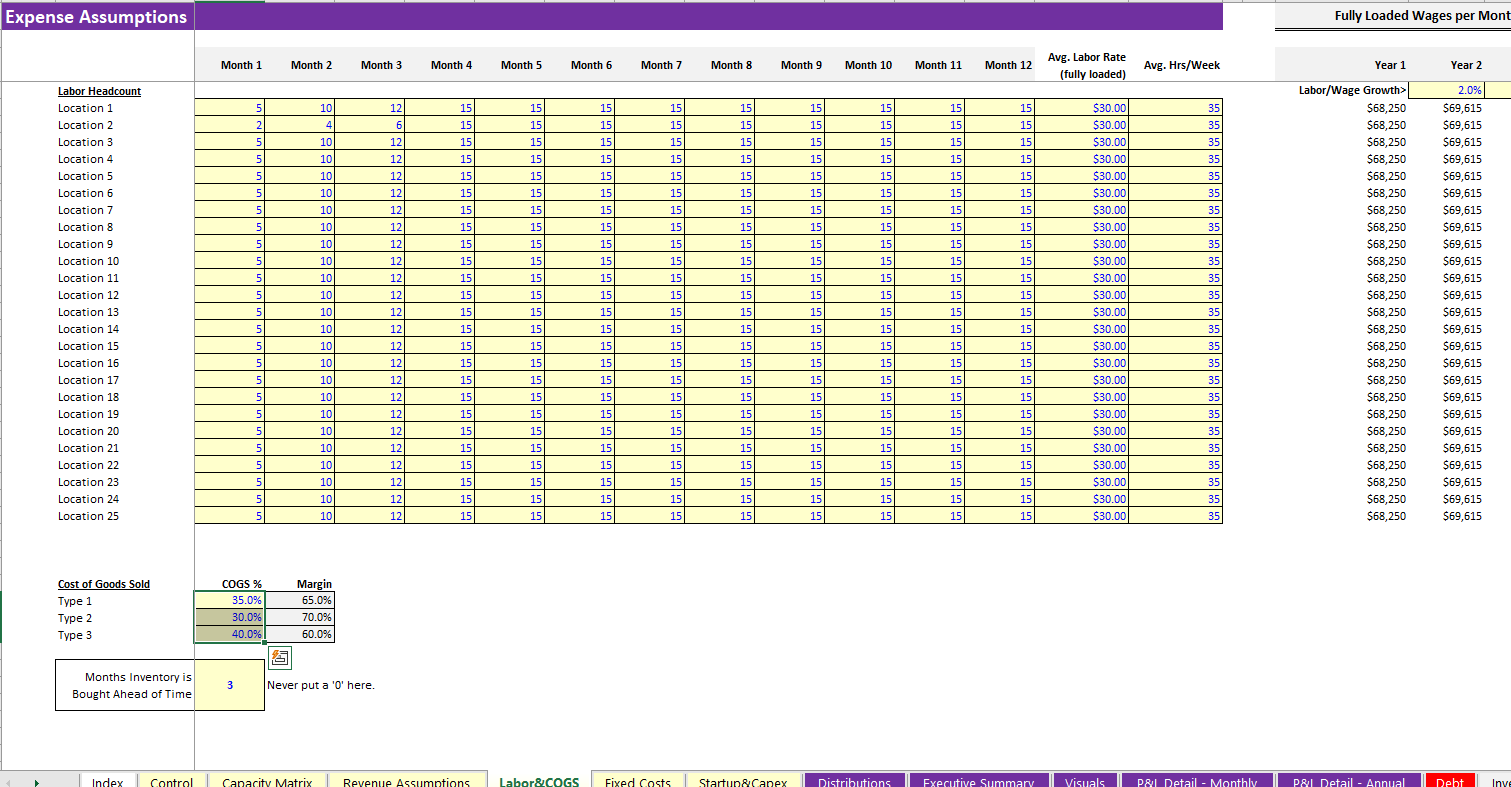
Build a financial plan designed for the launch of up to 25 retail locations at varying start months.
Further information
Strategy planning for retail location launches (up to 25).
Any type of brick and mortar retail category.
More than 25 locations or non-retail businesses.
