


Originally published: 26/08/2020 07:41
Last version published: 30/12/2023 13:47
Publication number: ELQ-91686-4
View all versions & Certificate
Last version published: 30/12/2023 13:47
Publication number: ELQ-91686-4
View all versions & Certificate

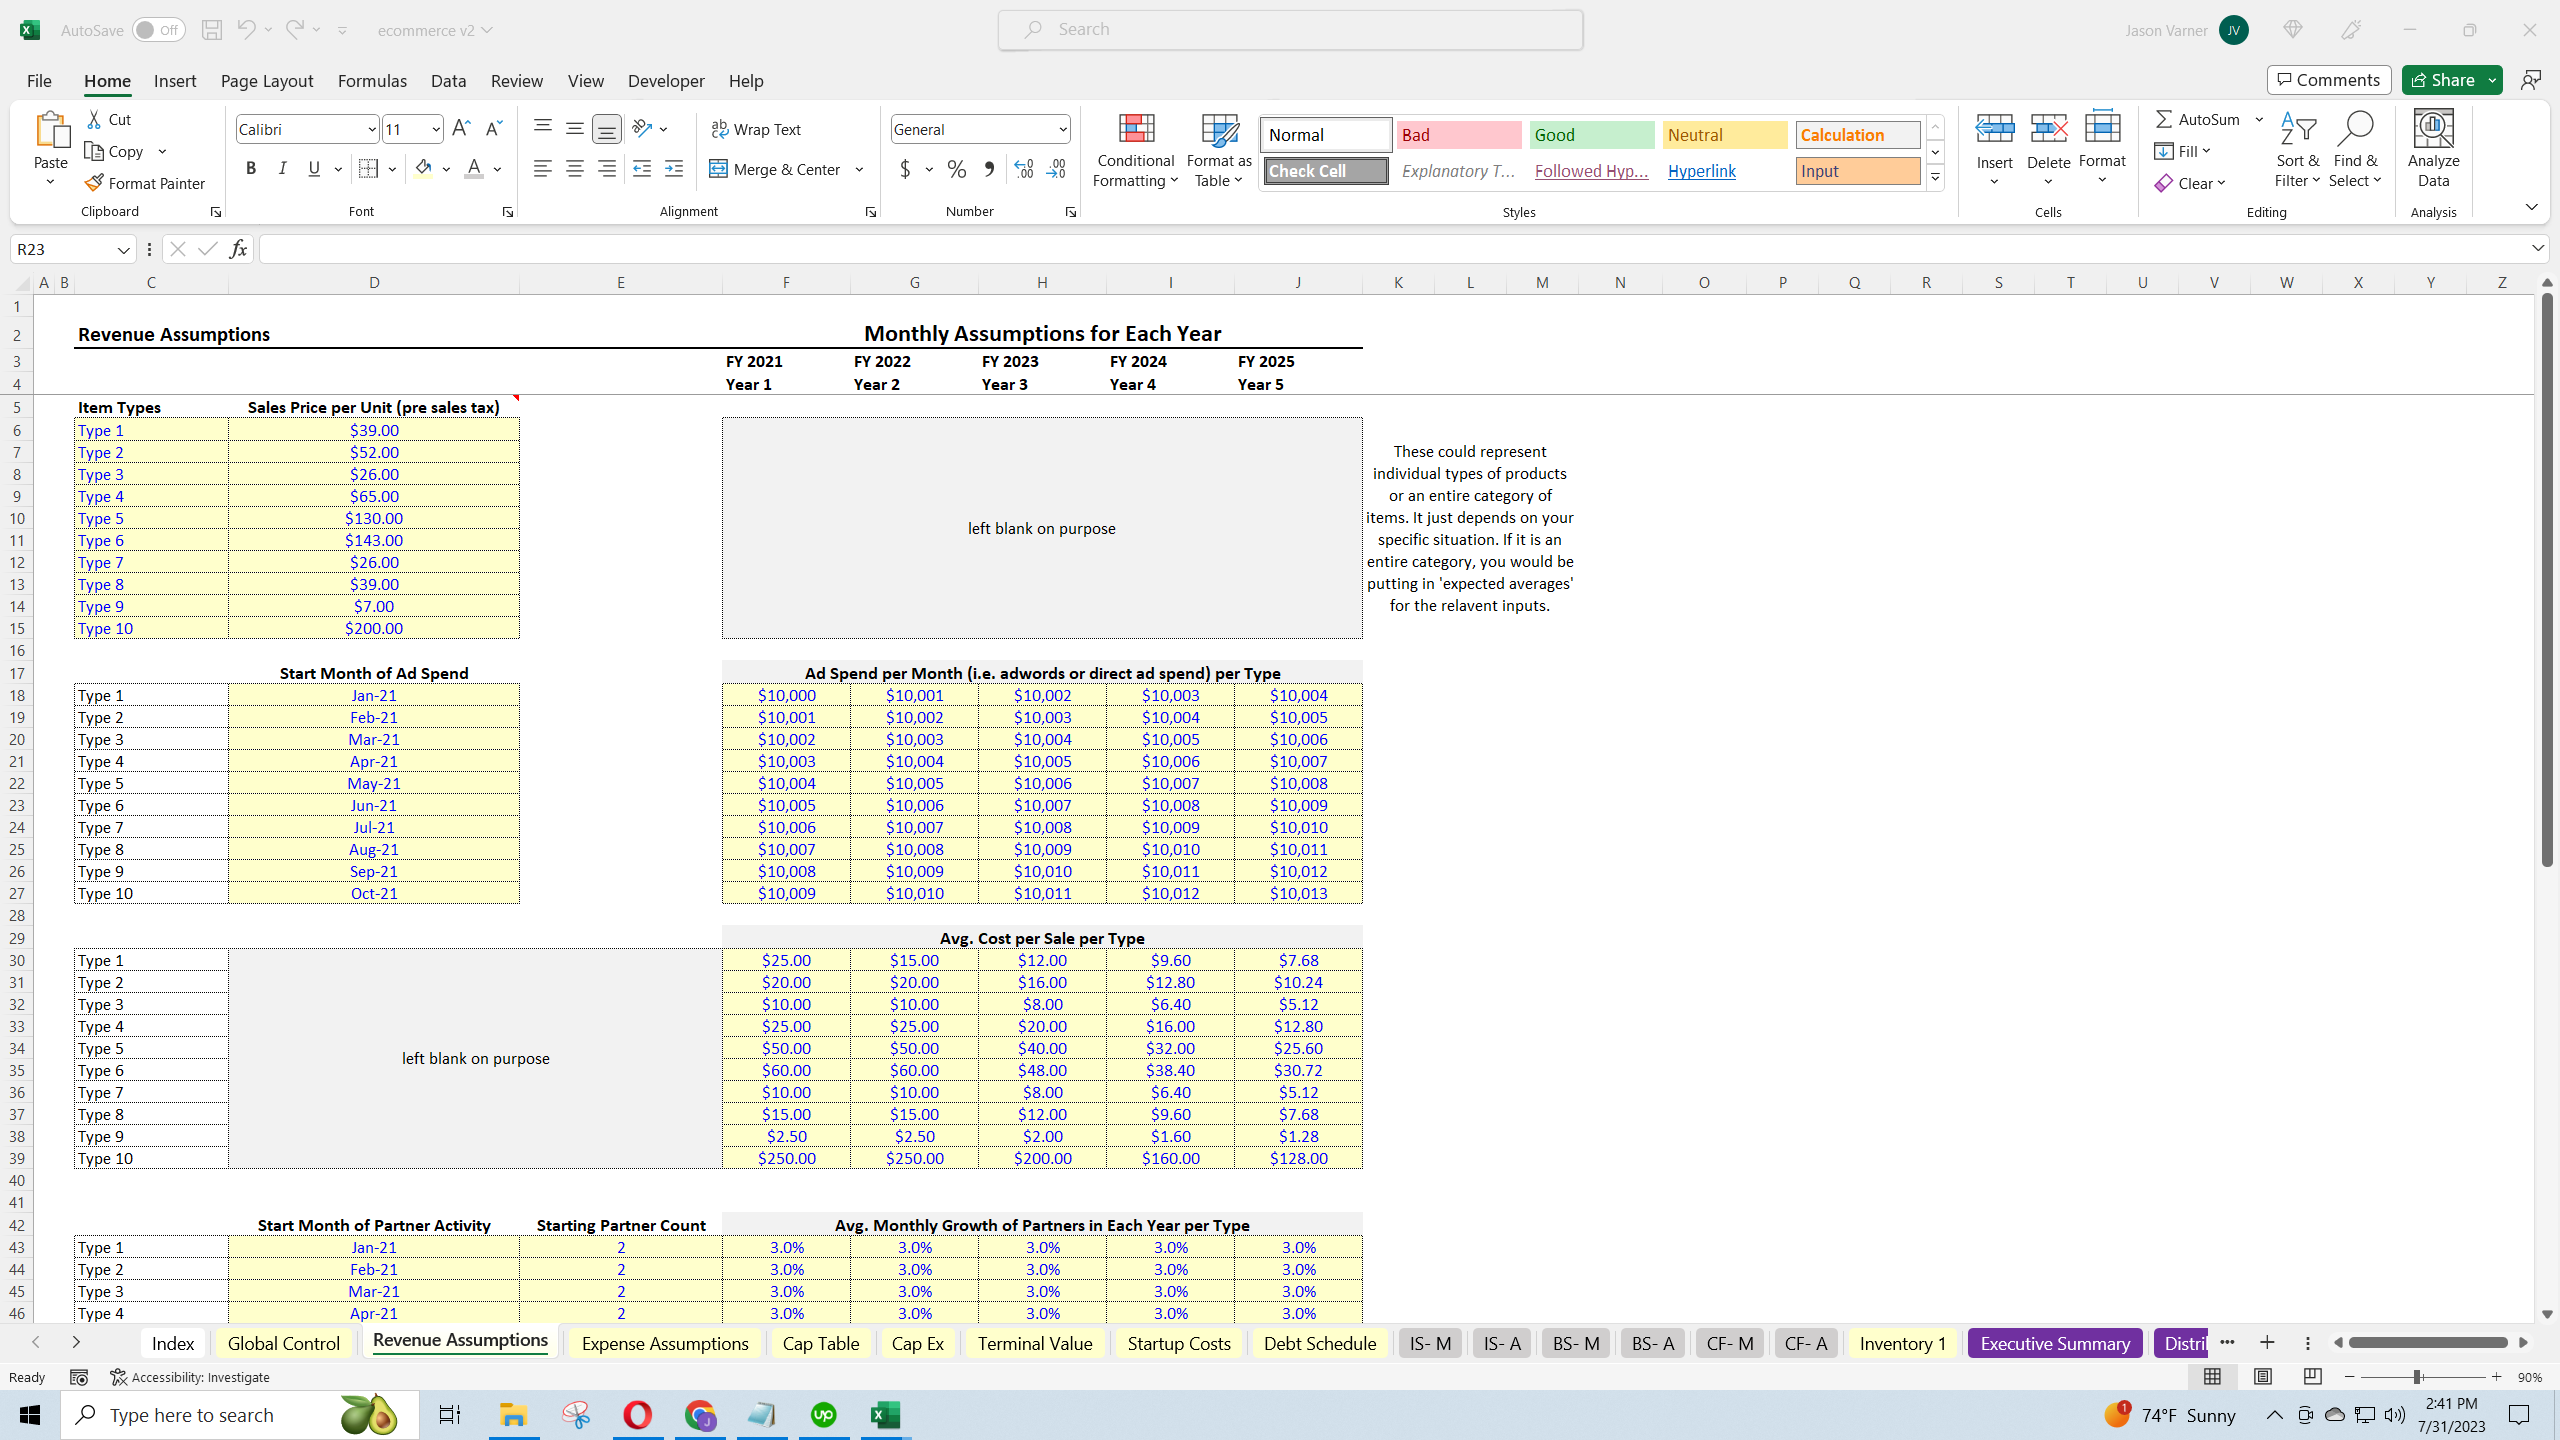
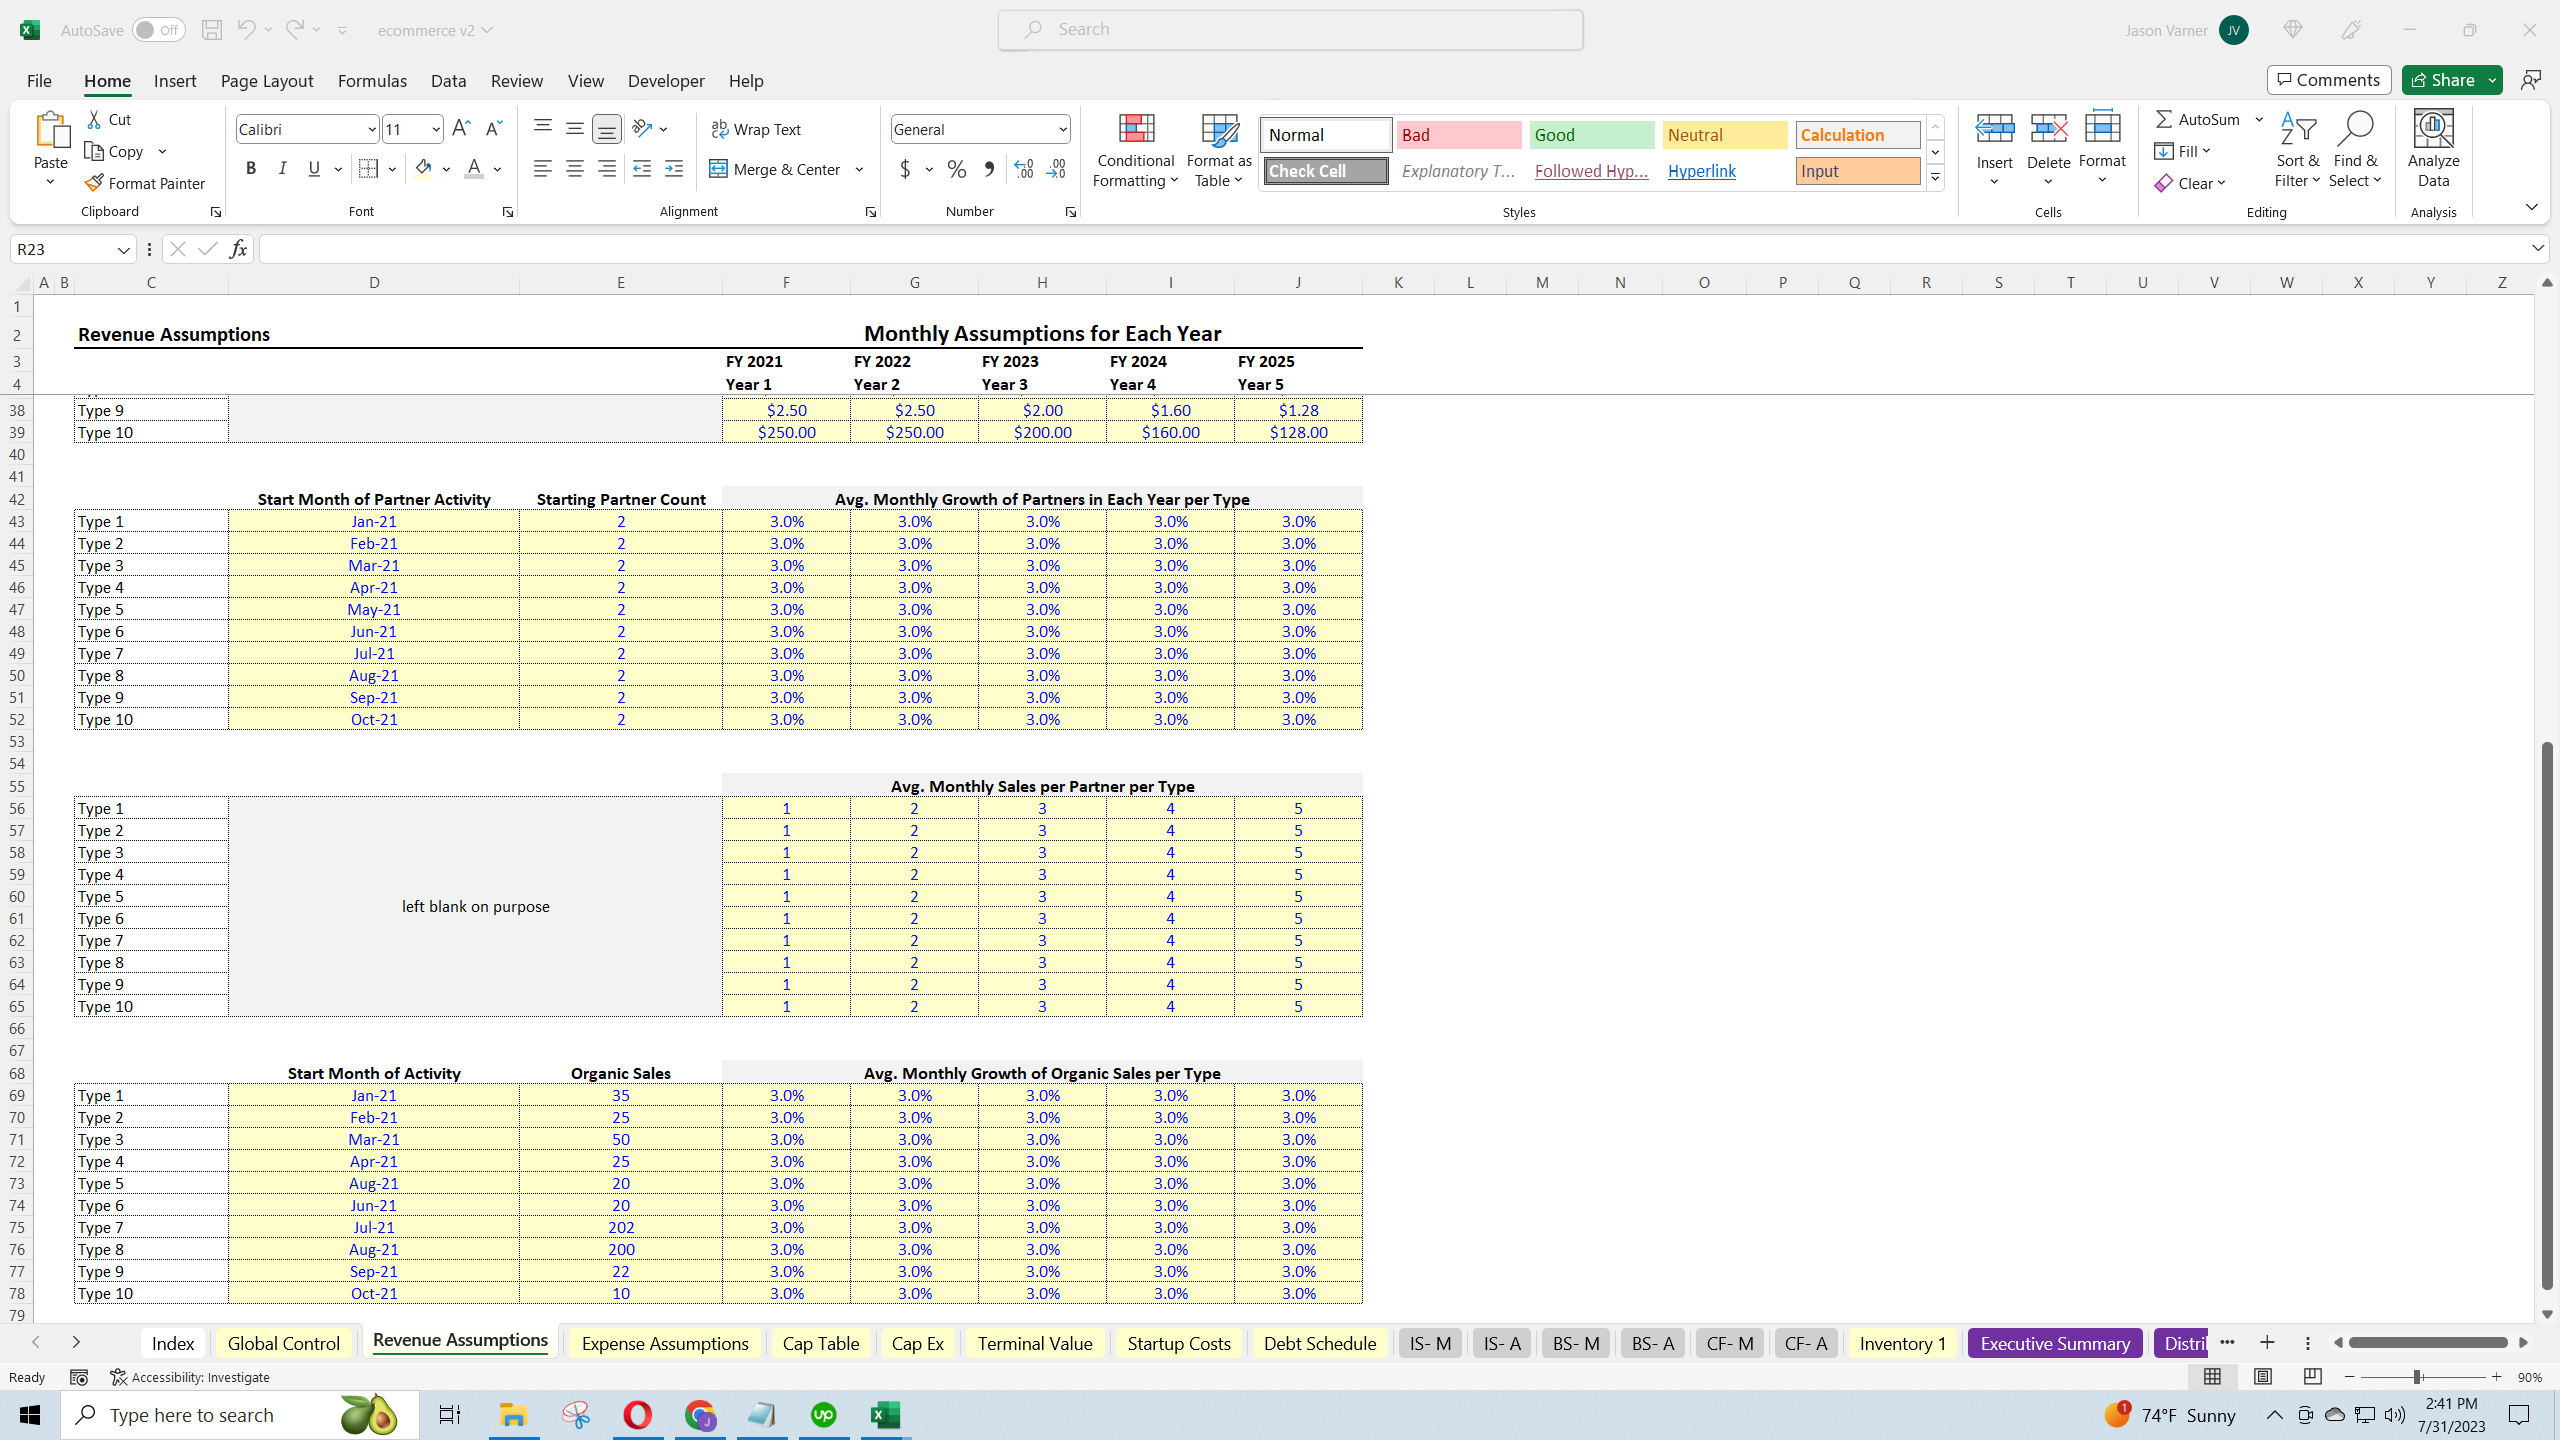
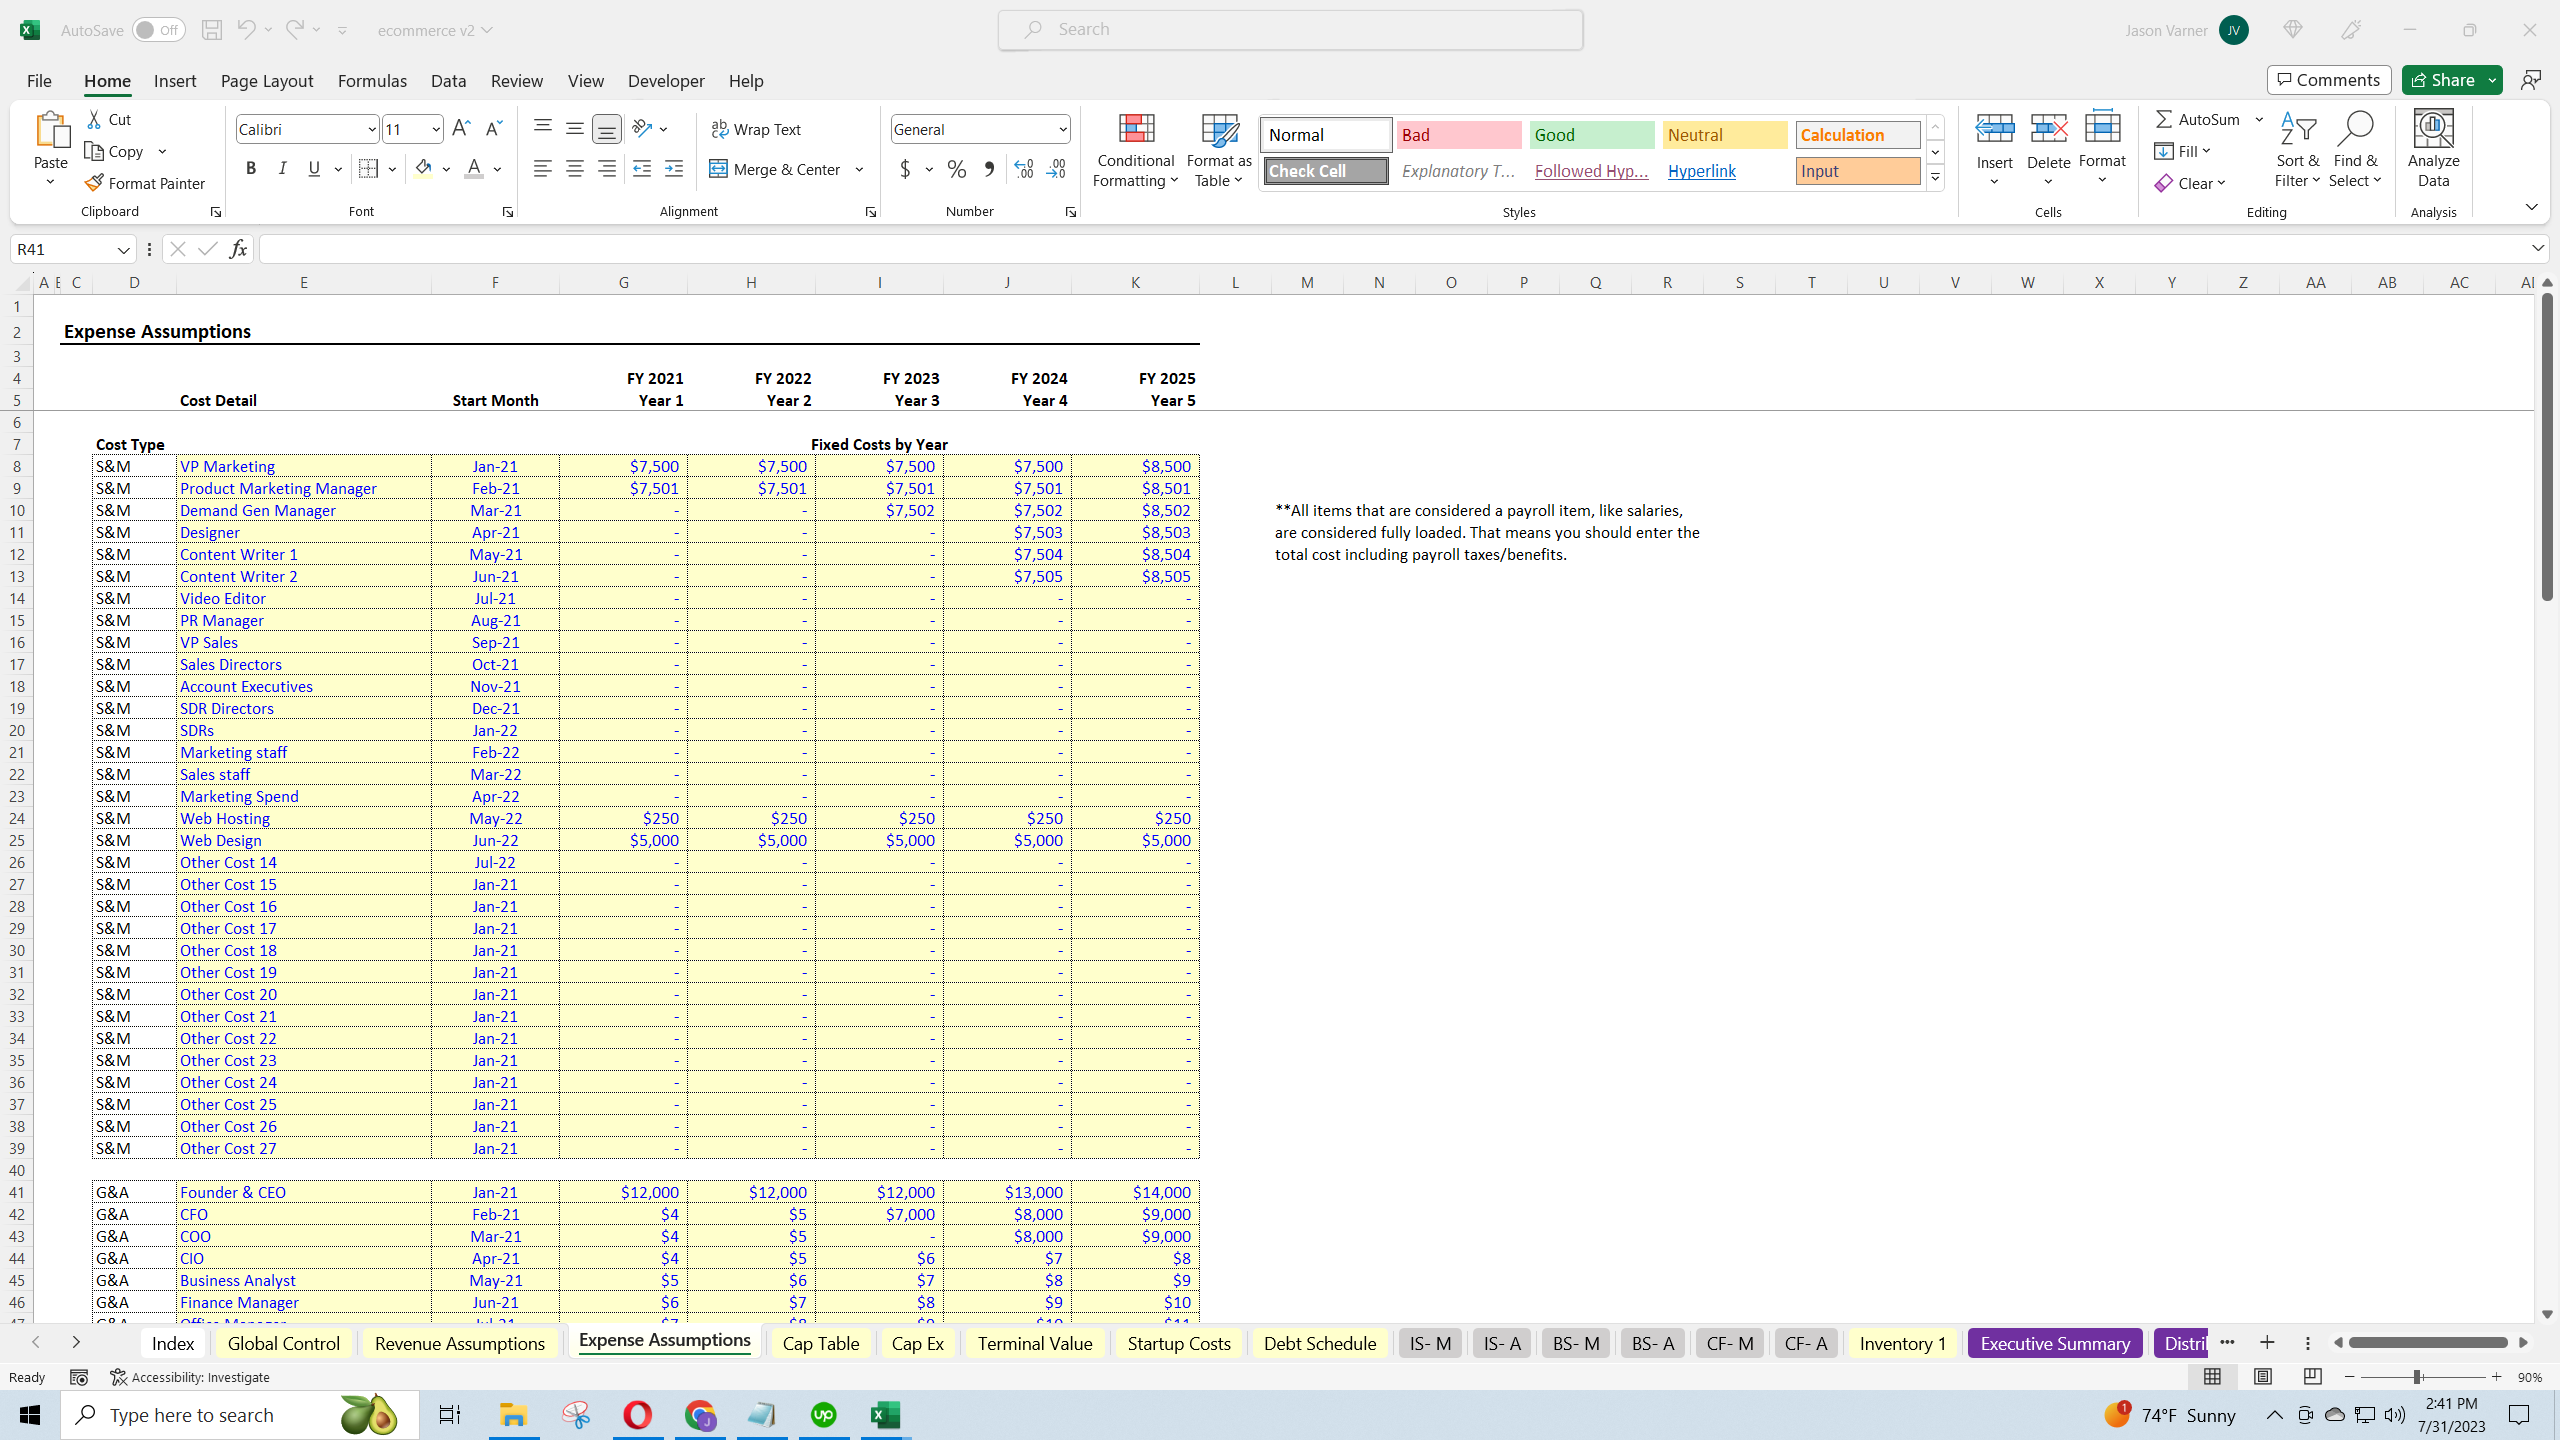
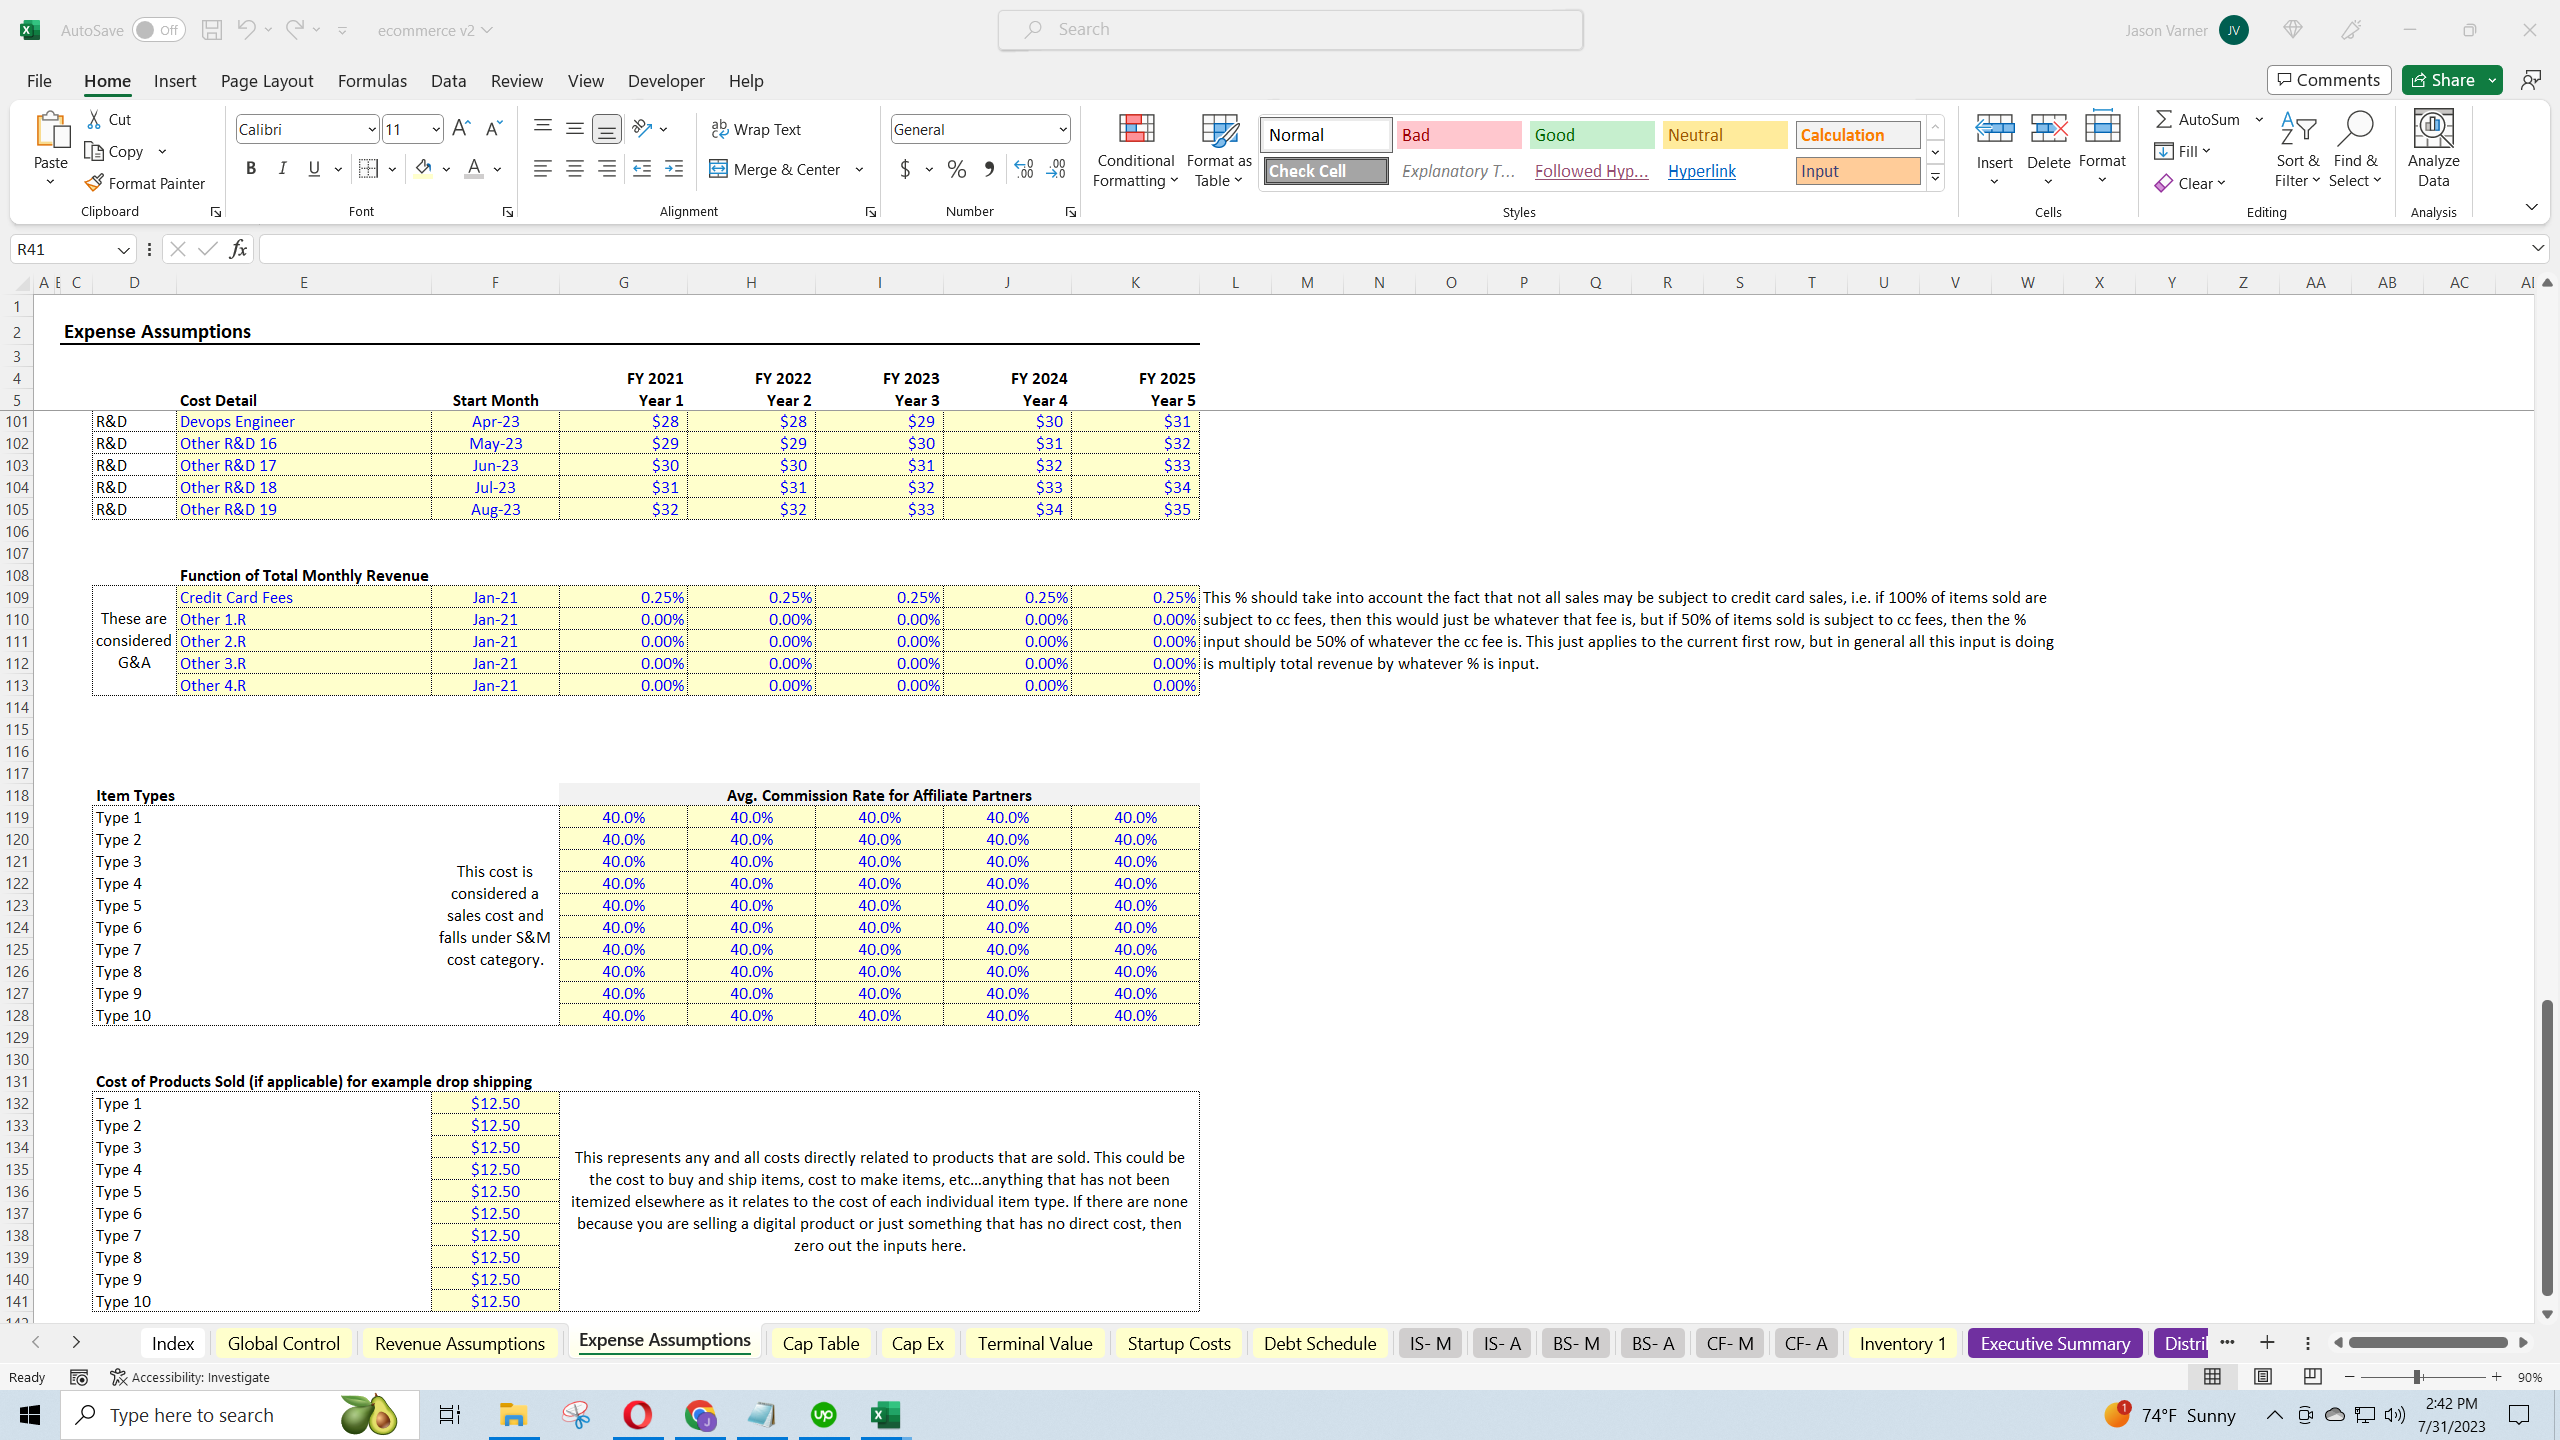
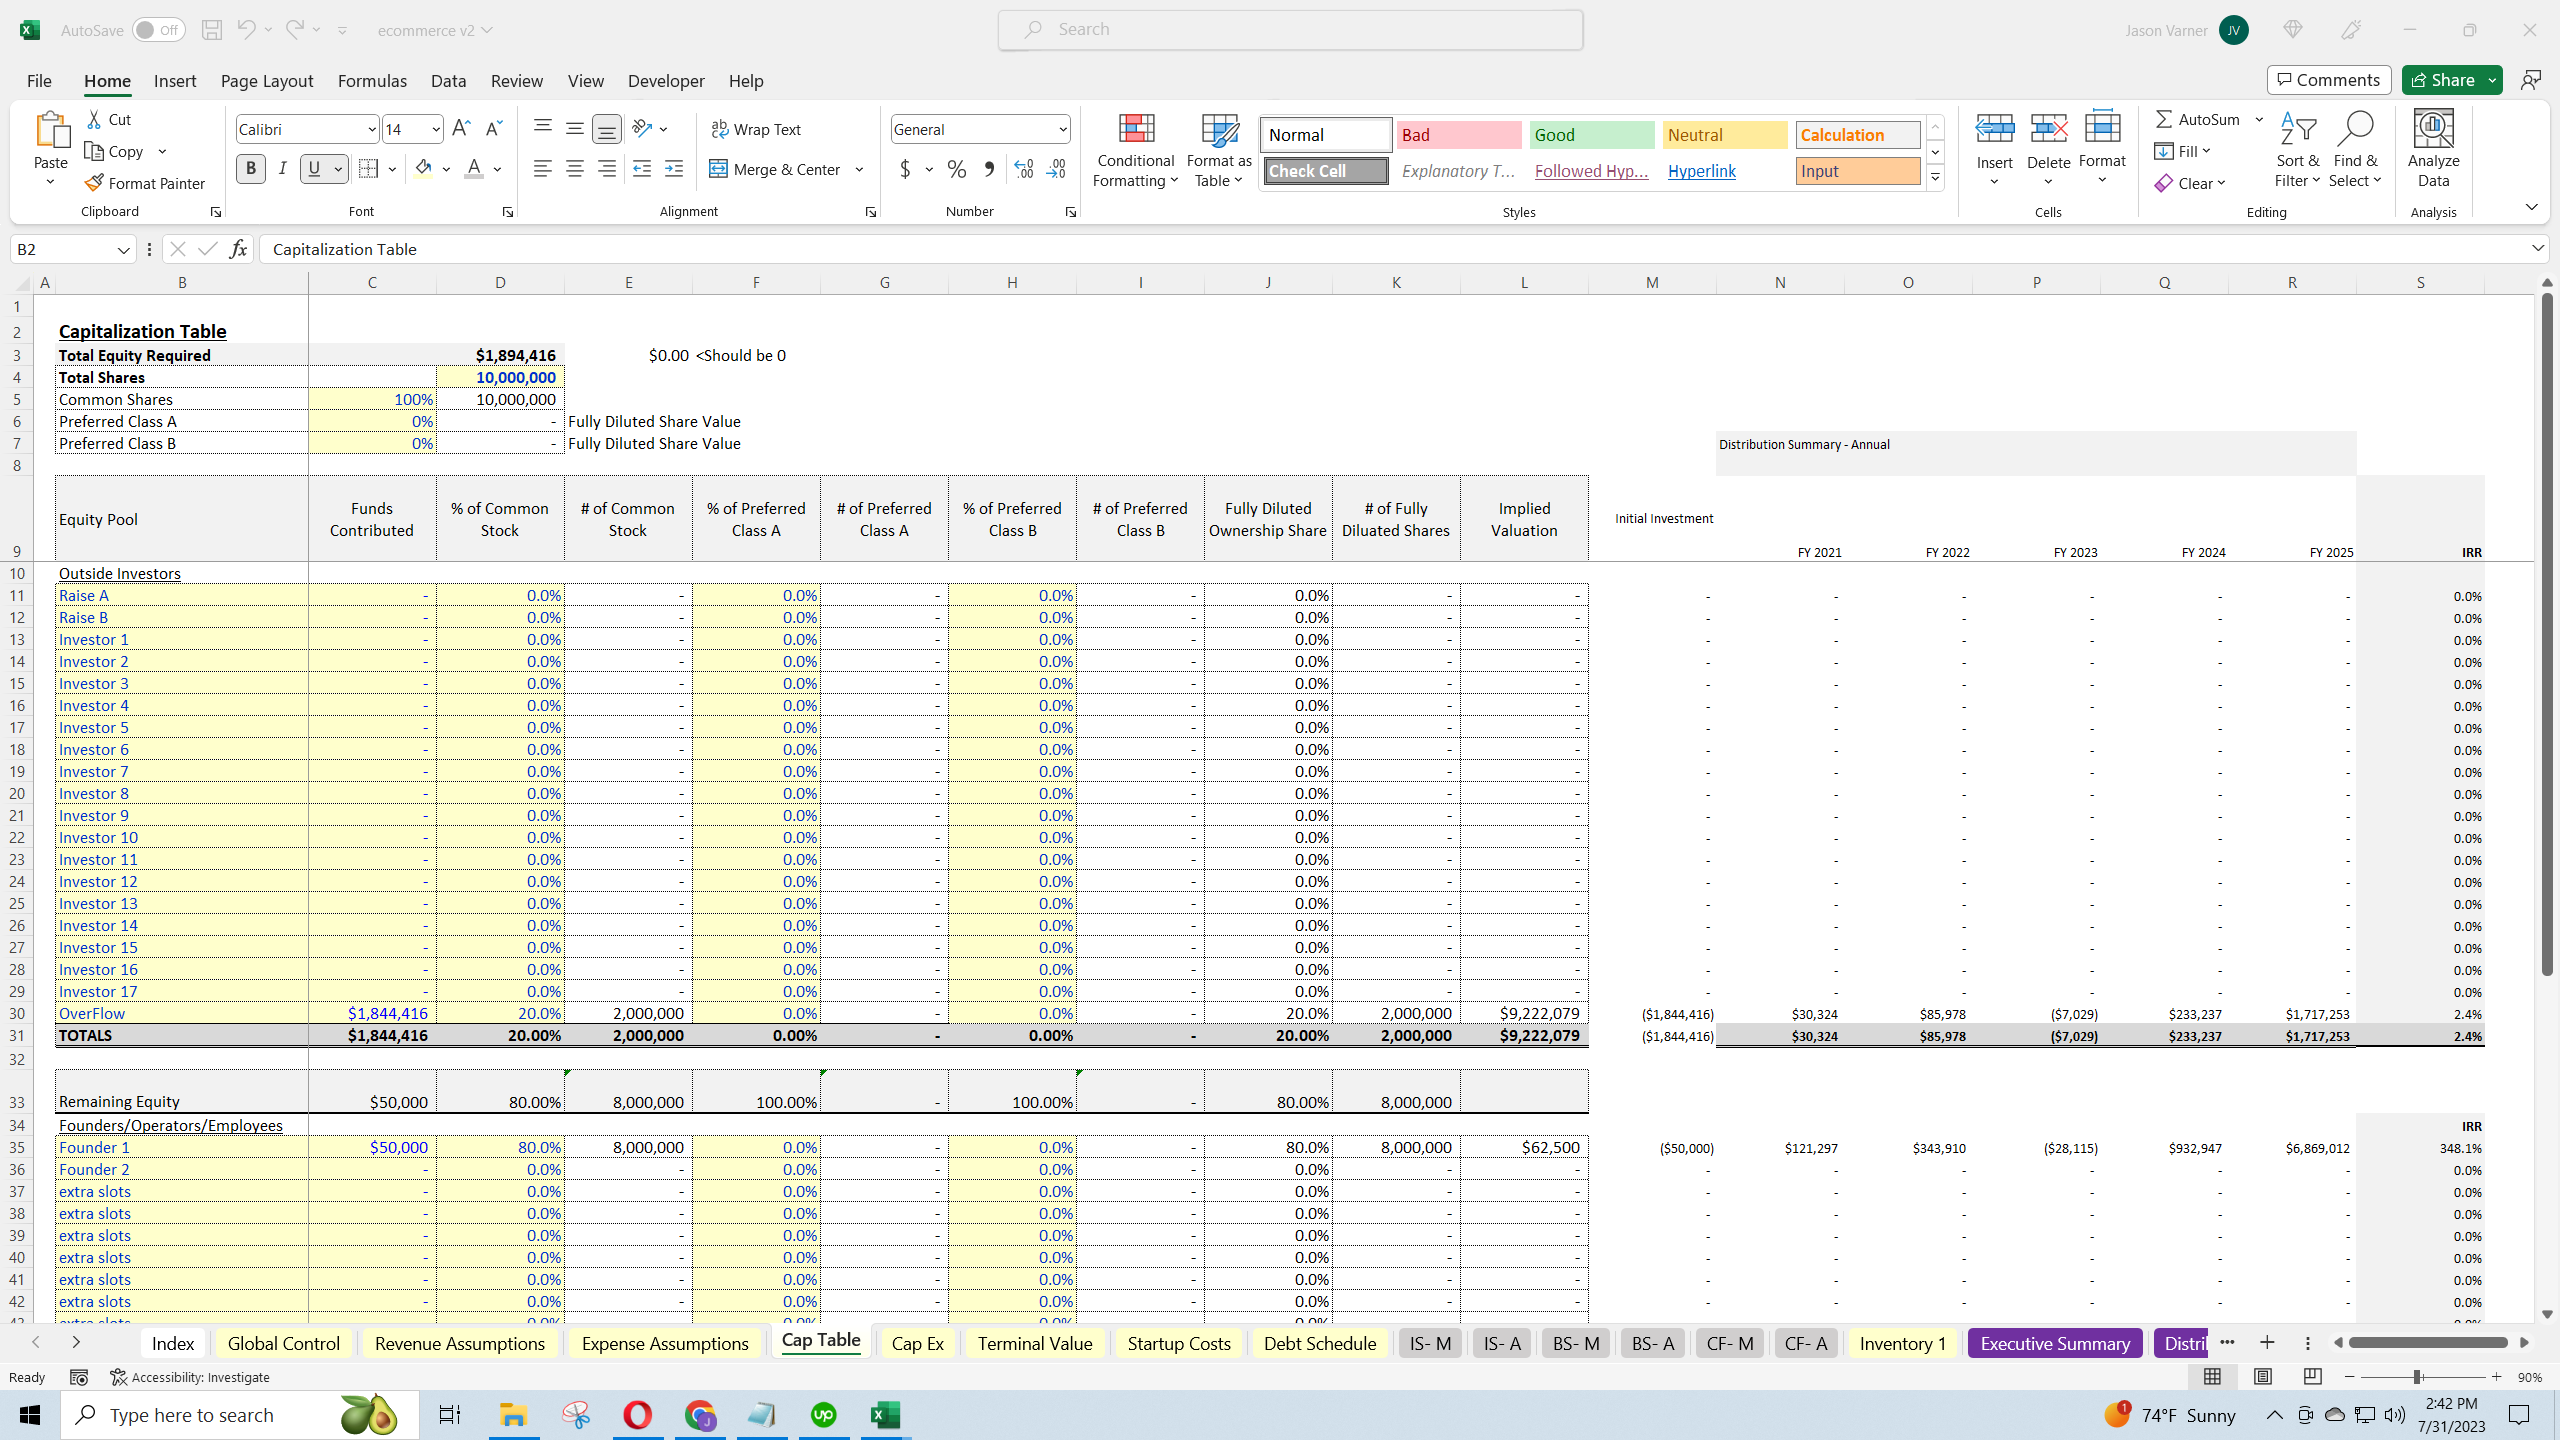
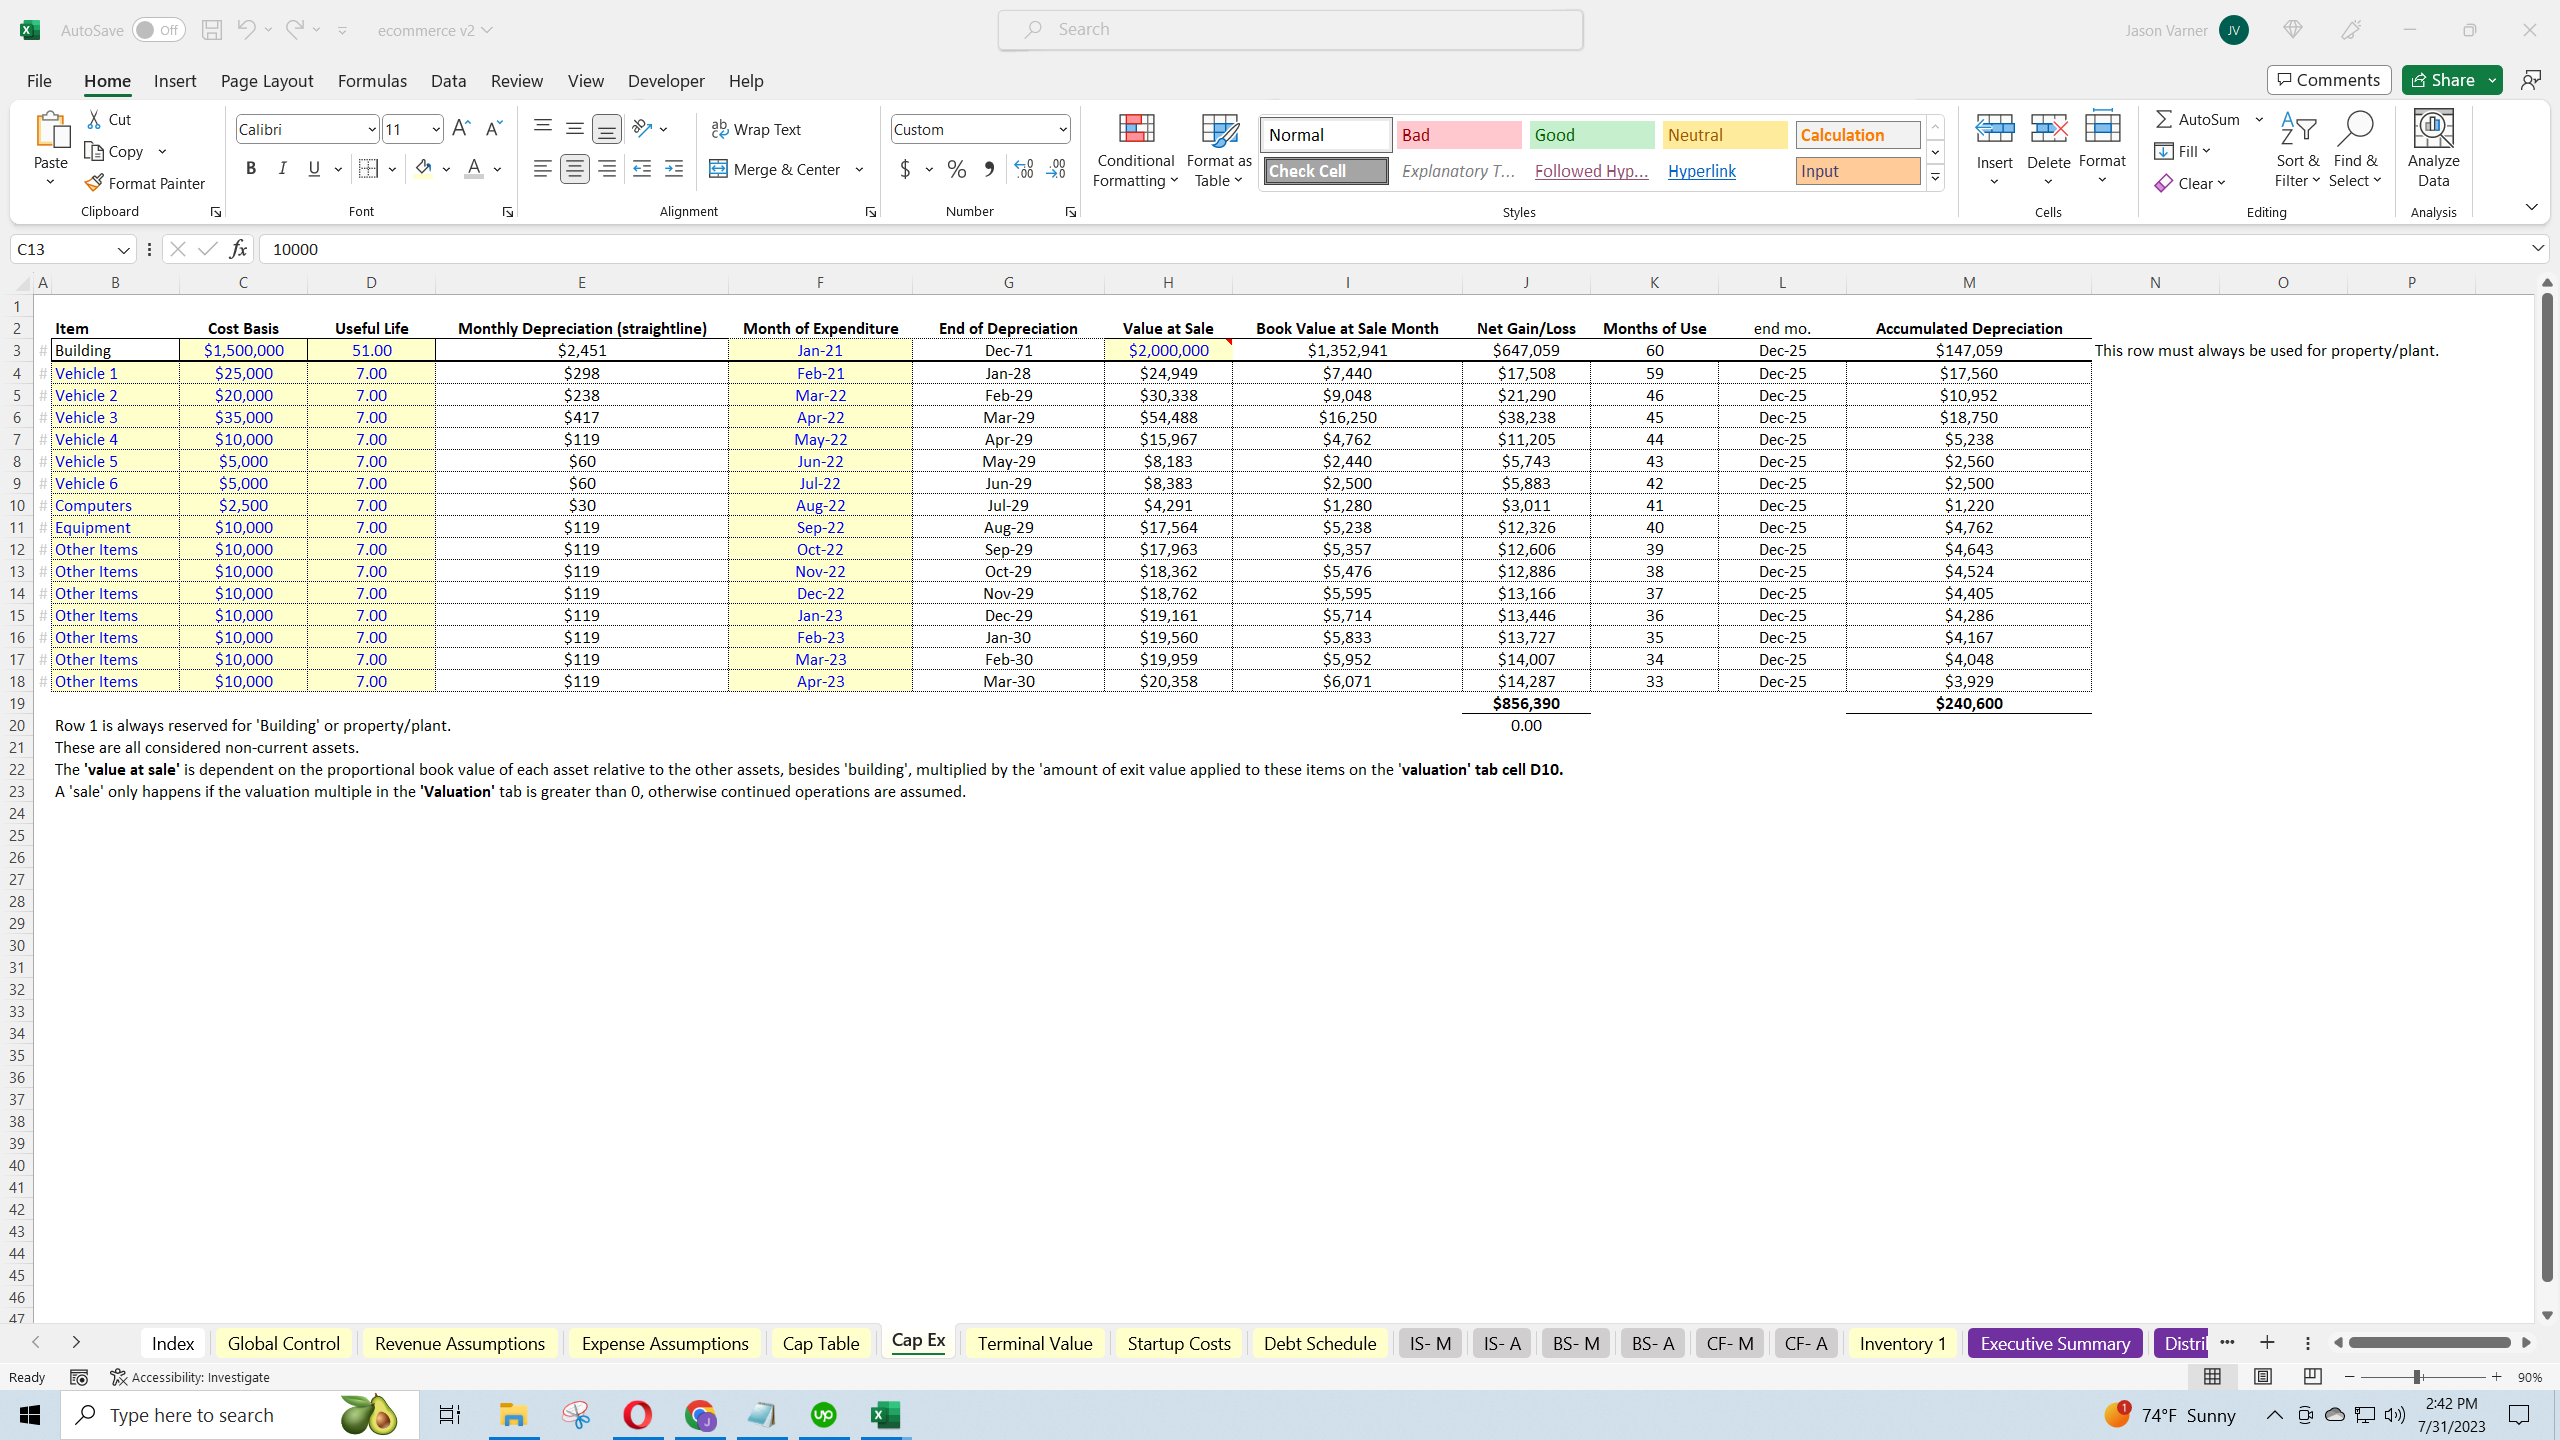
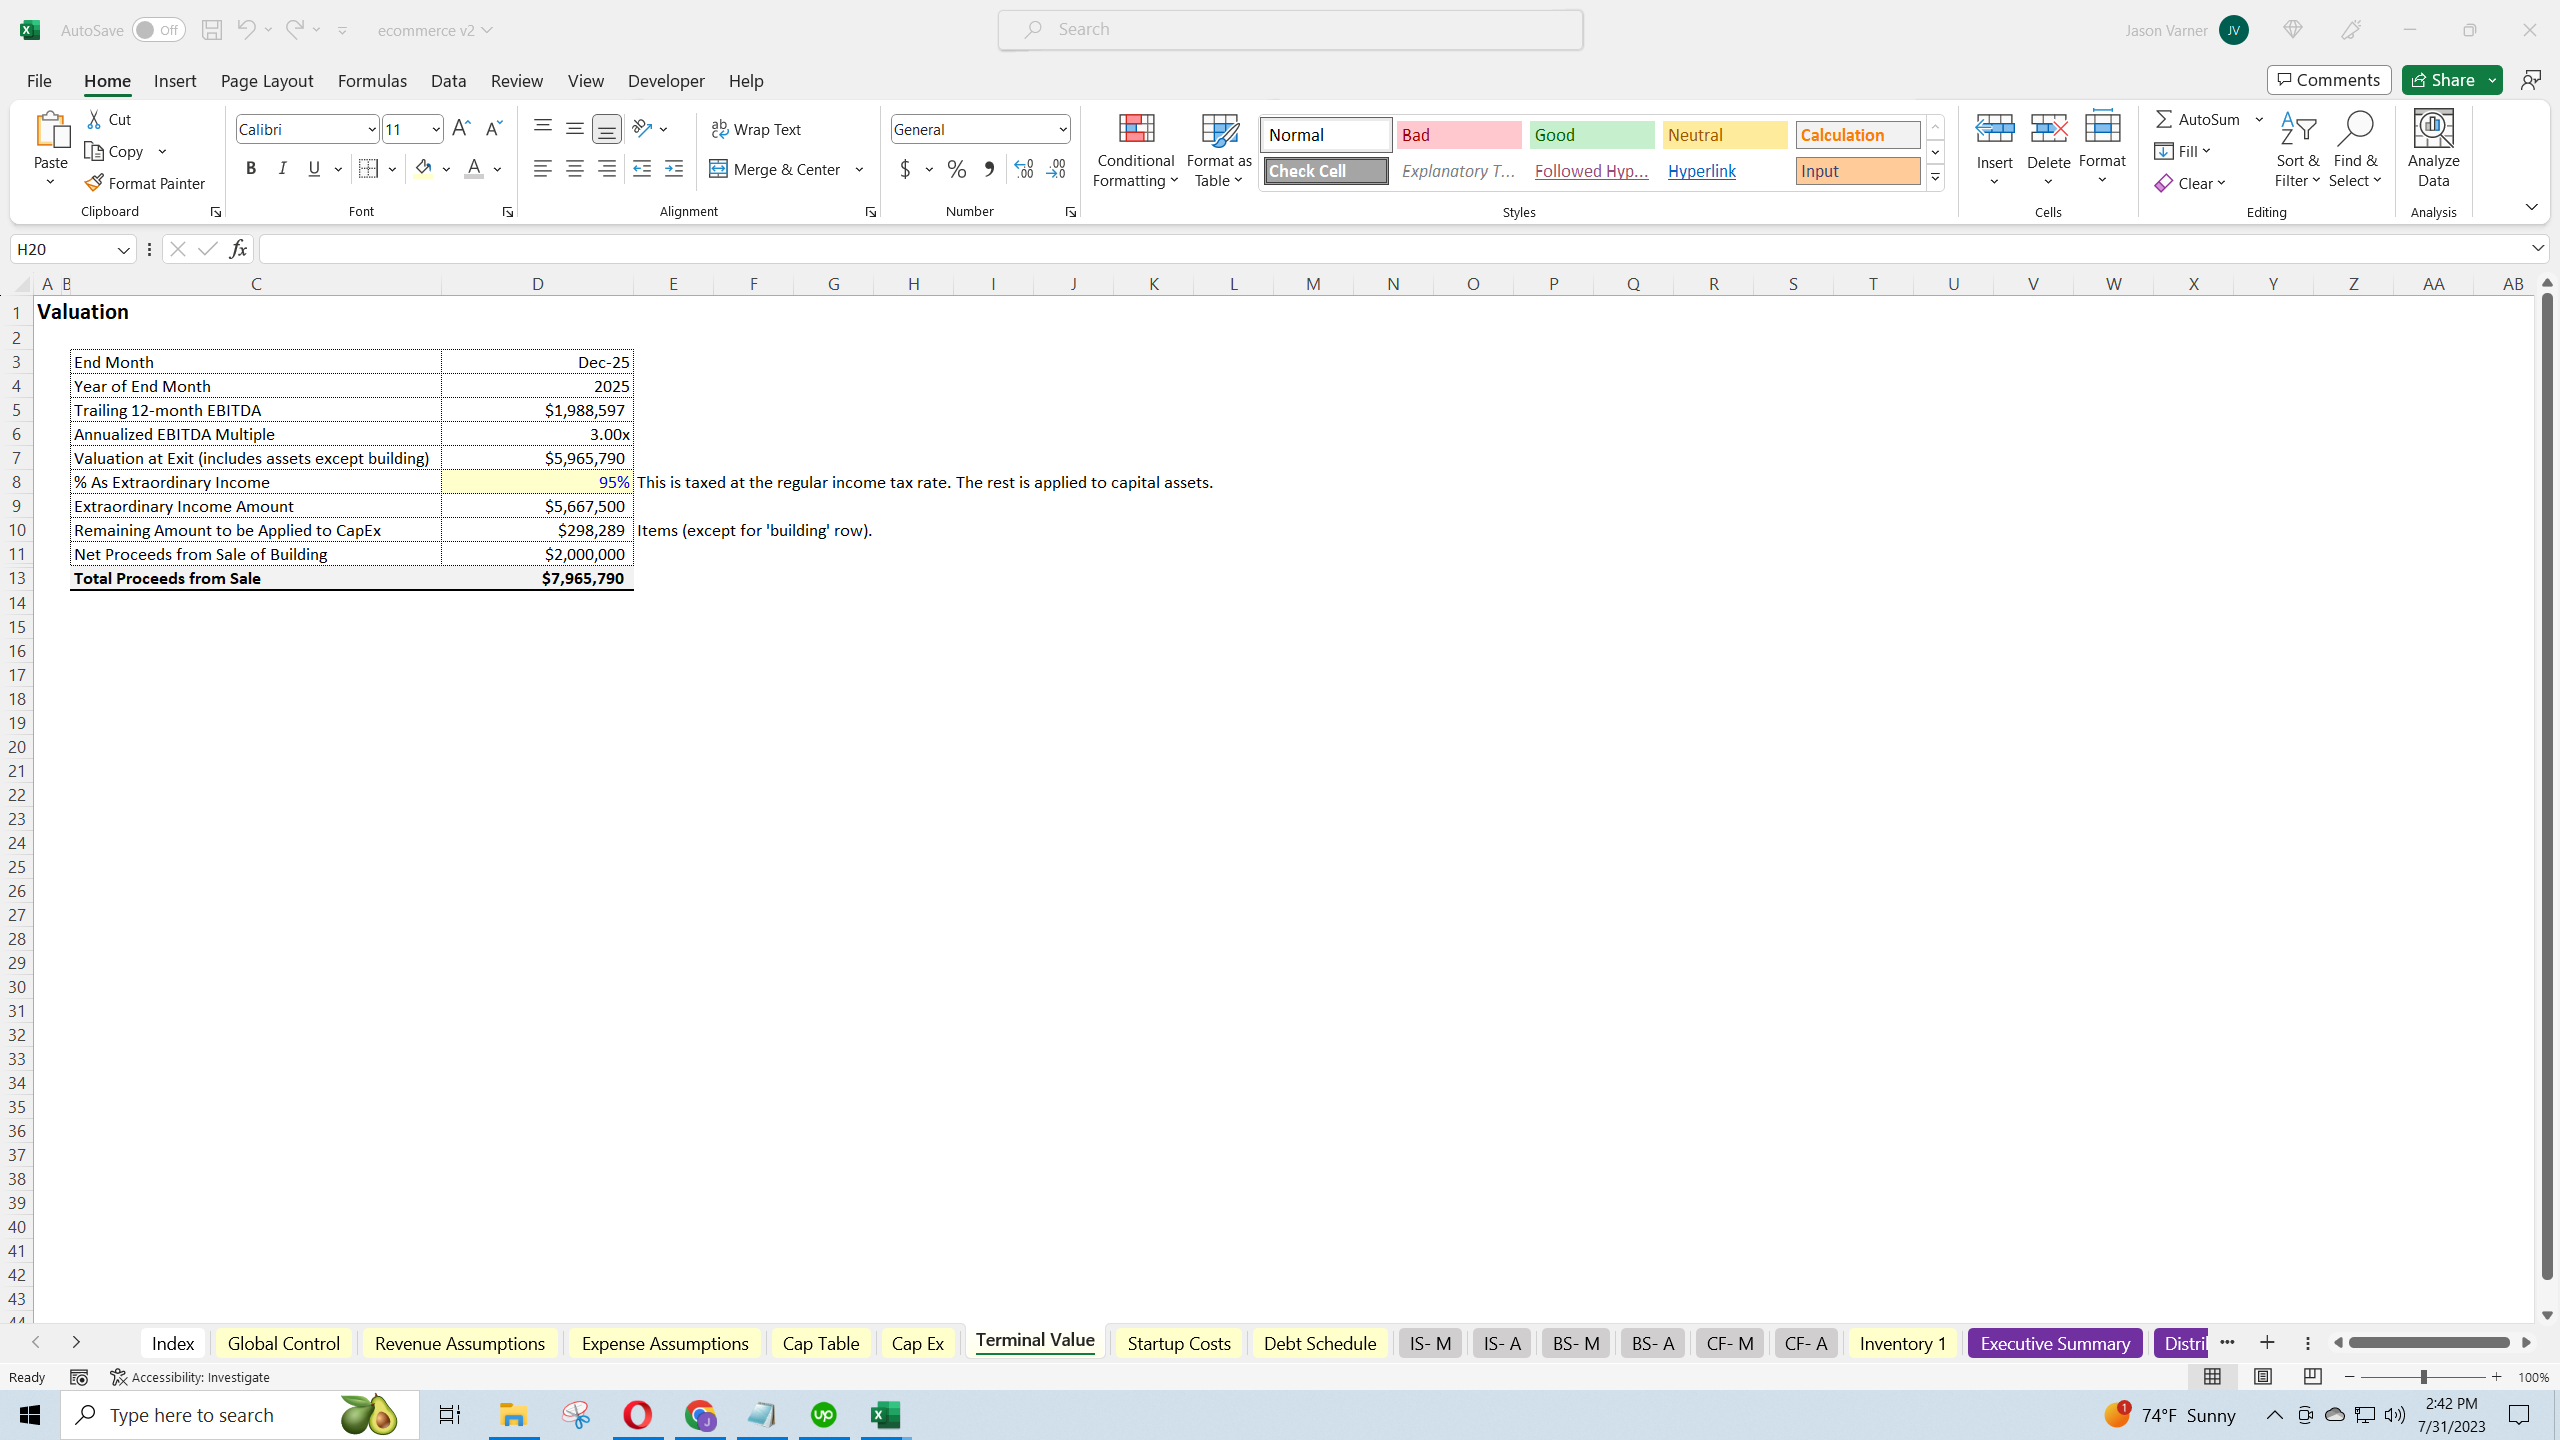
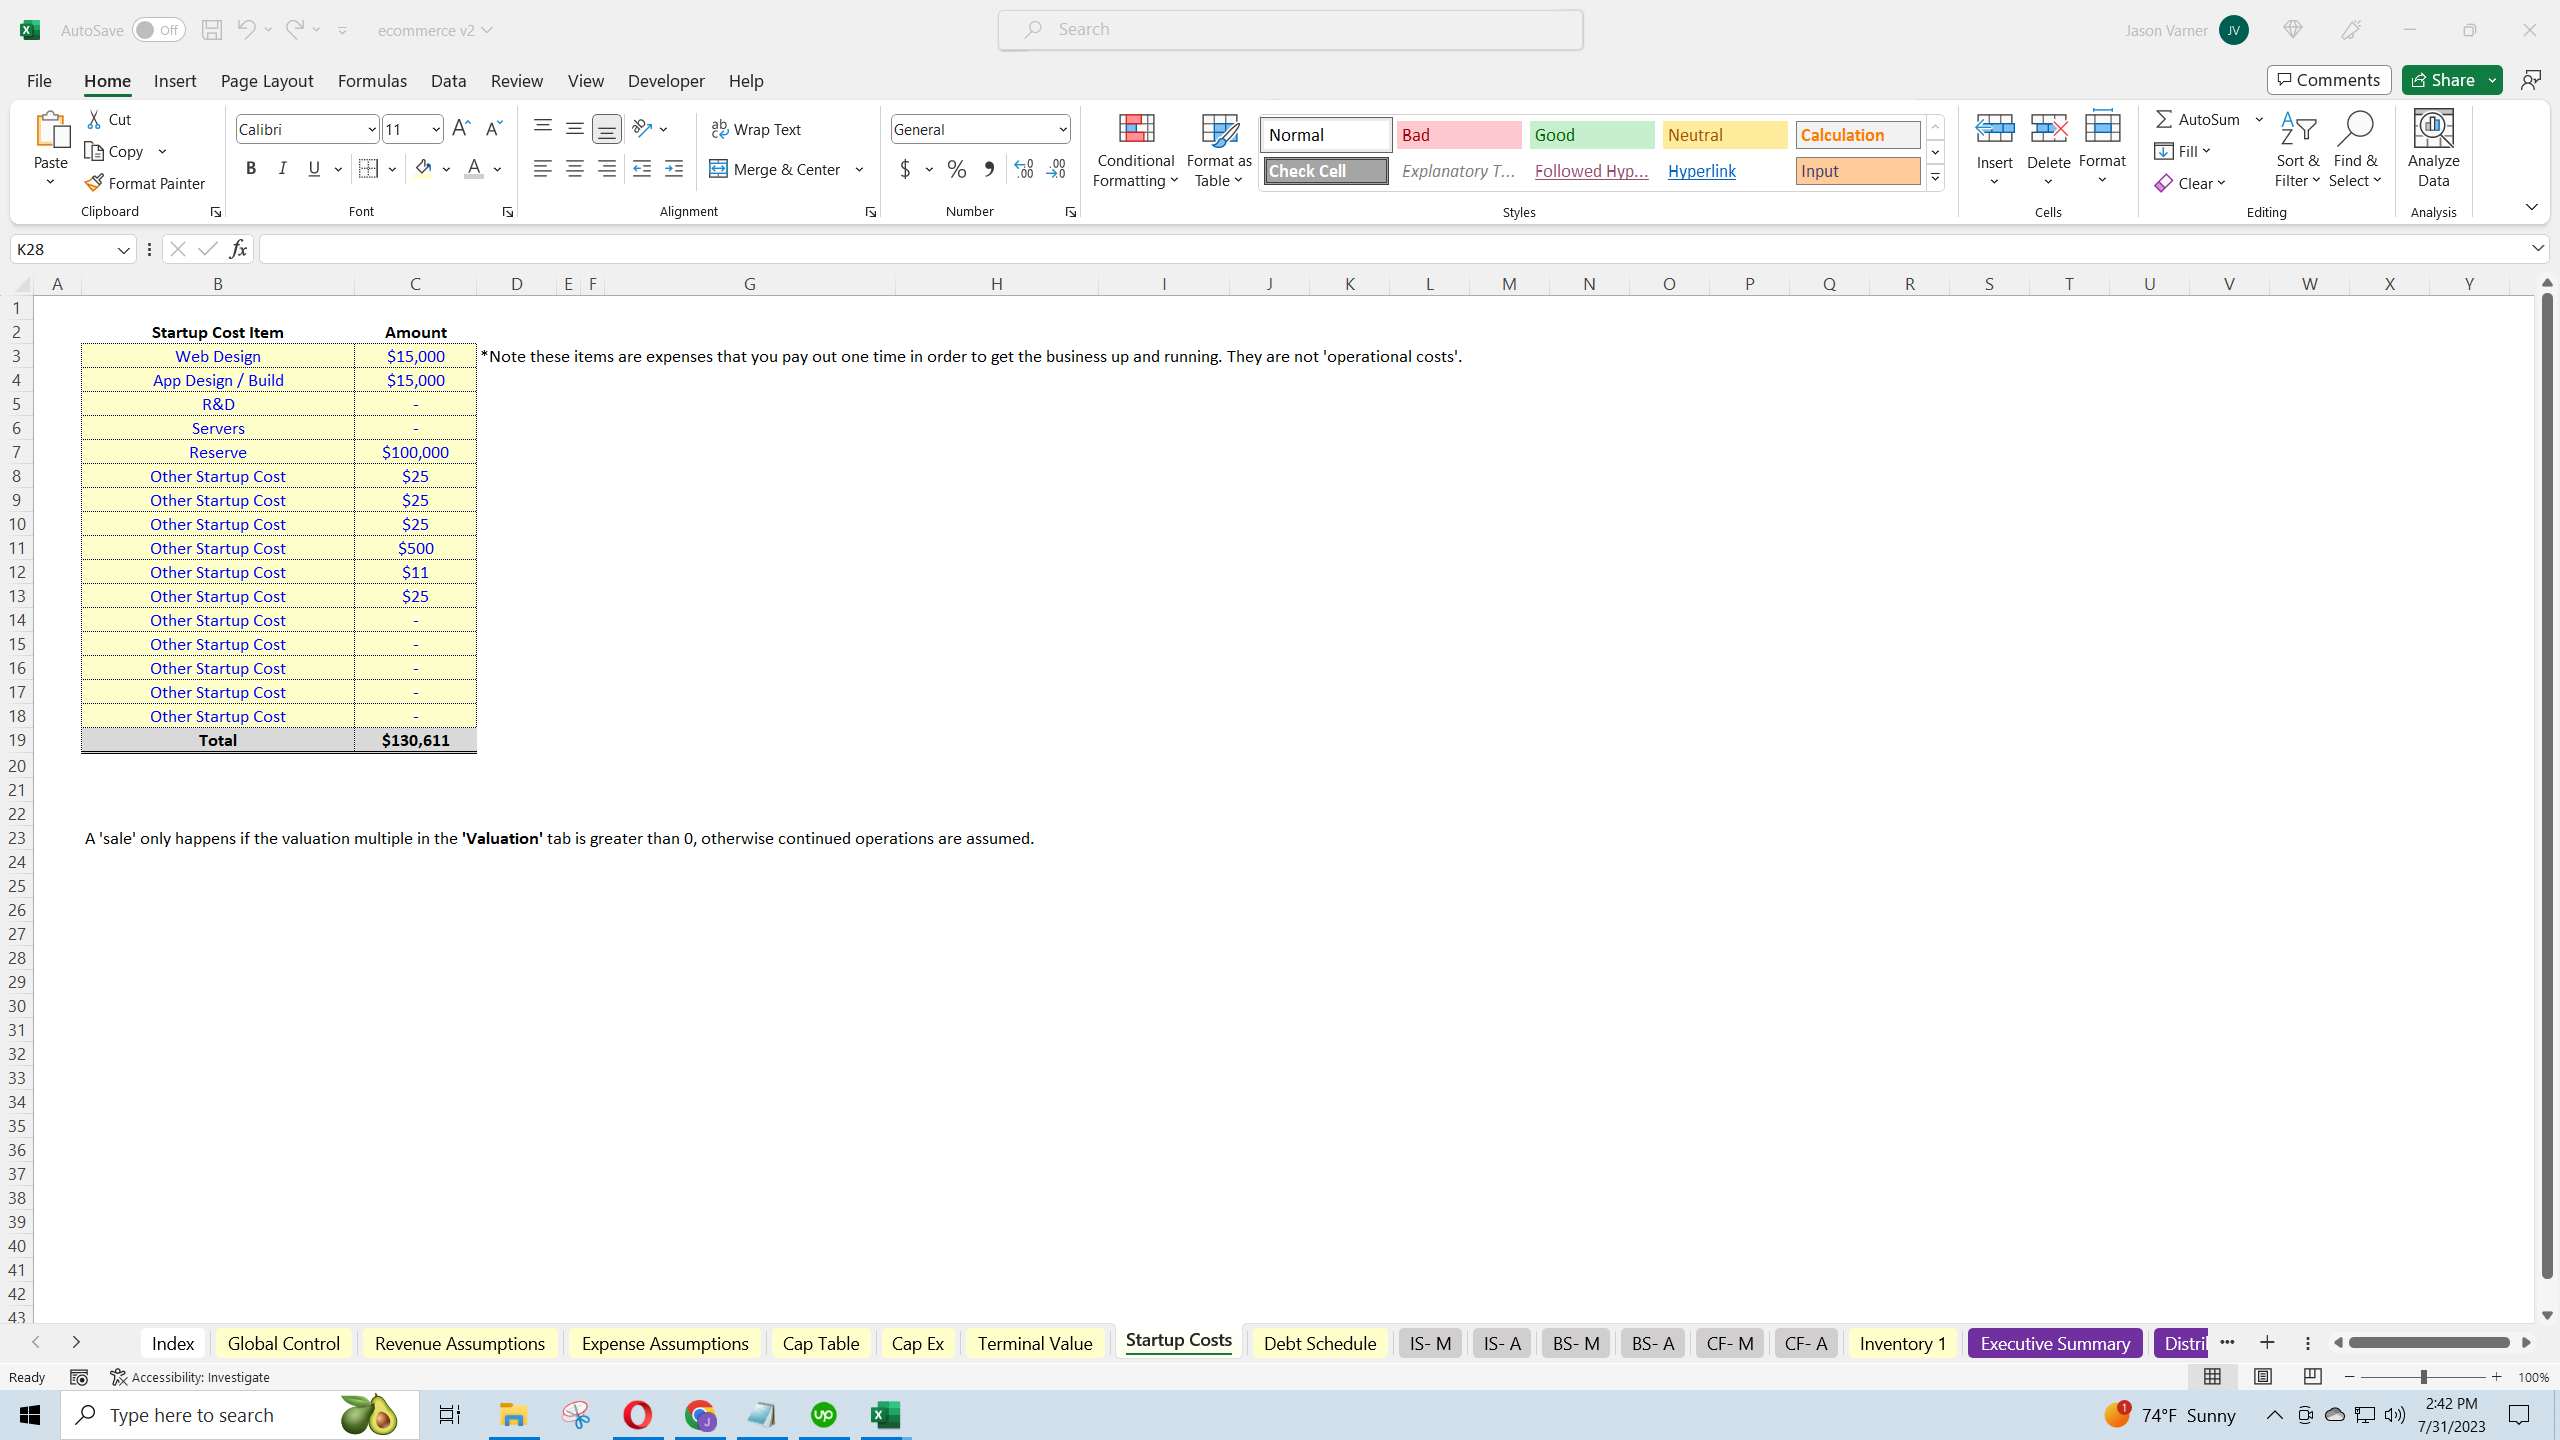
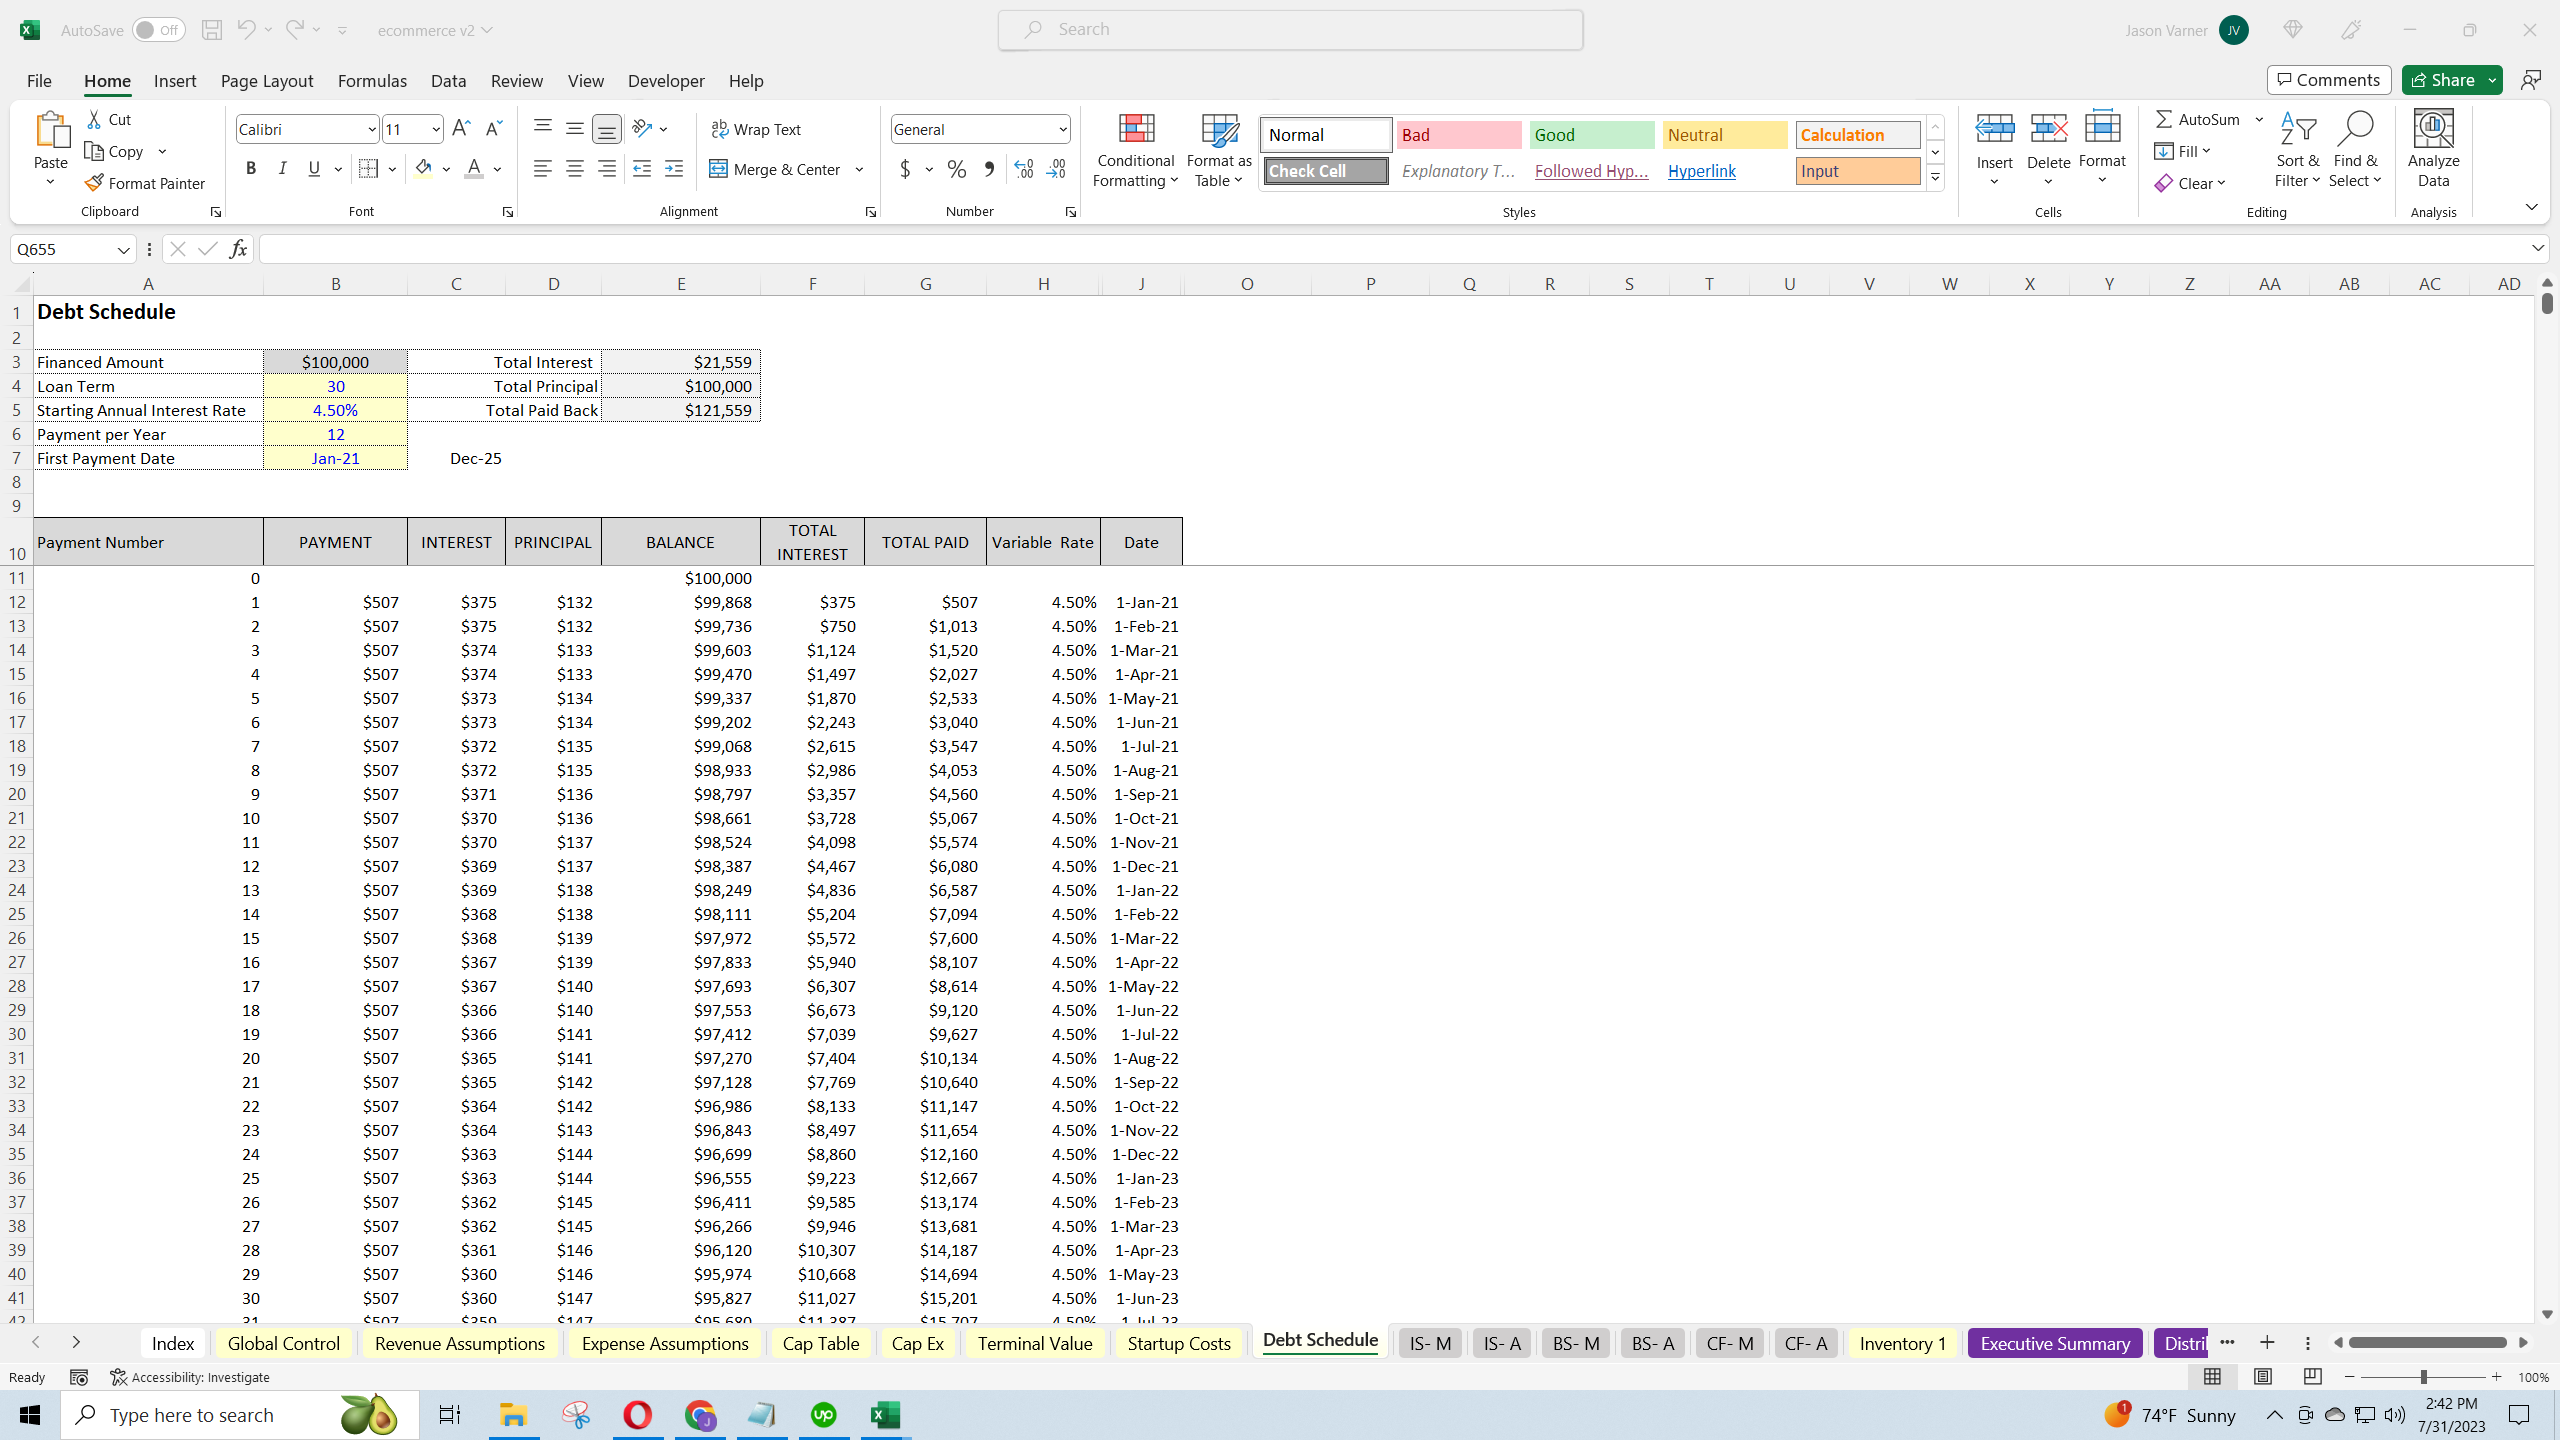
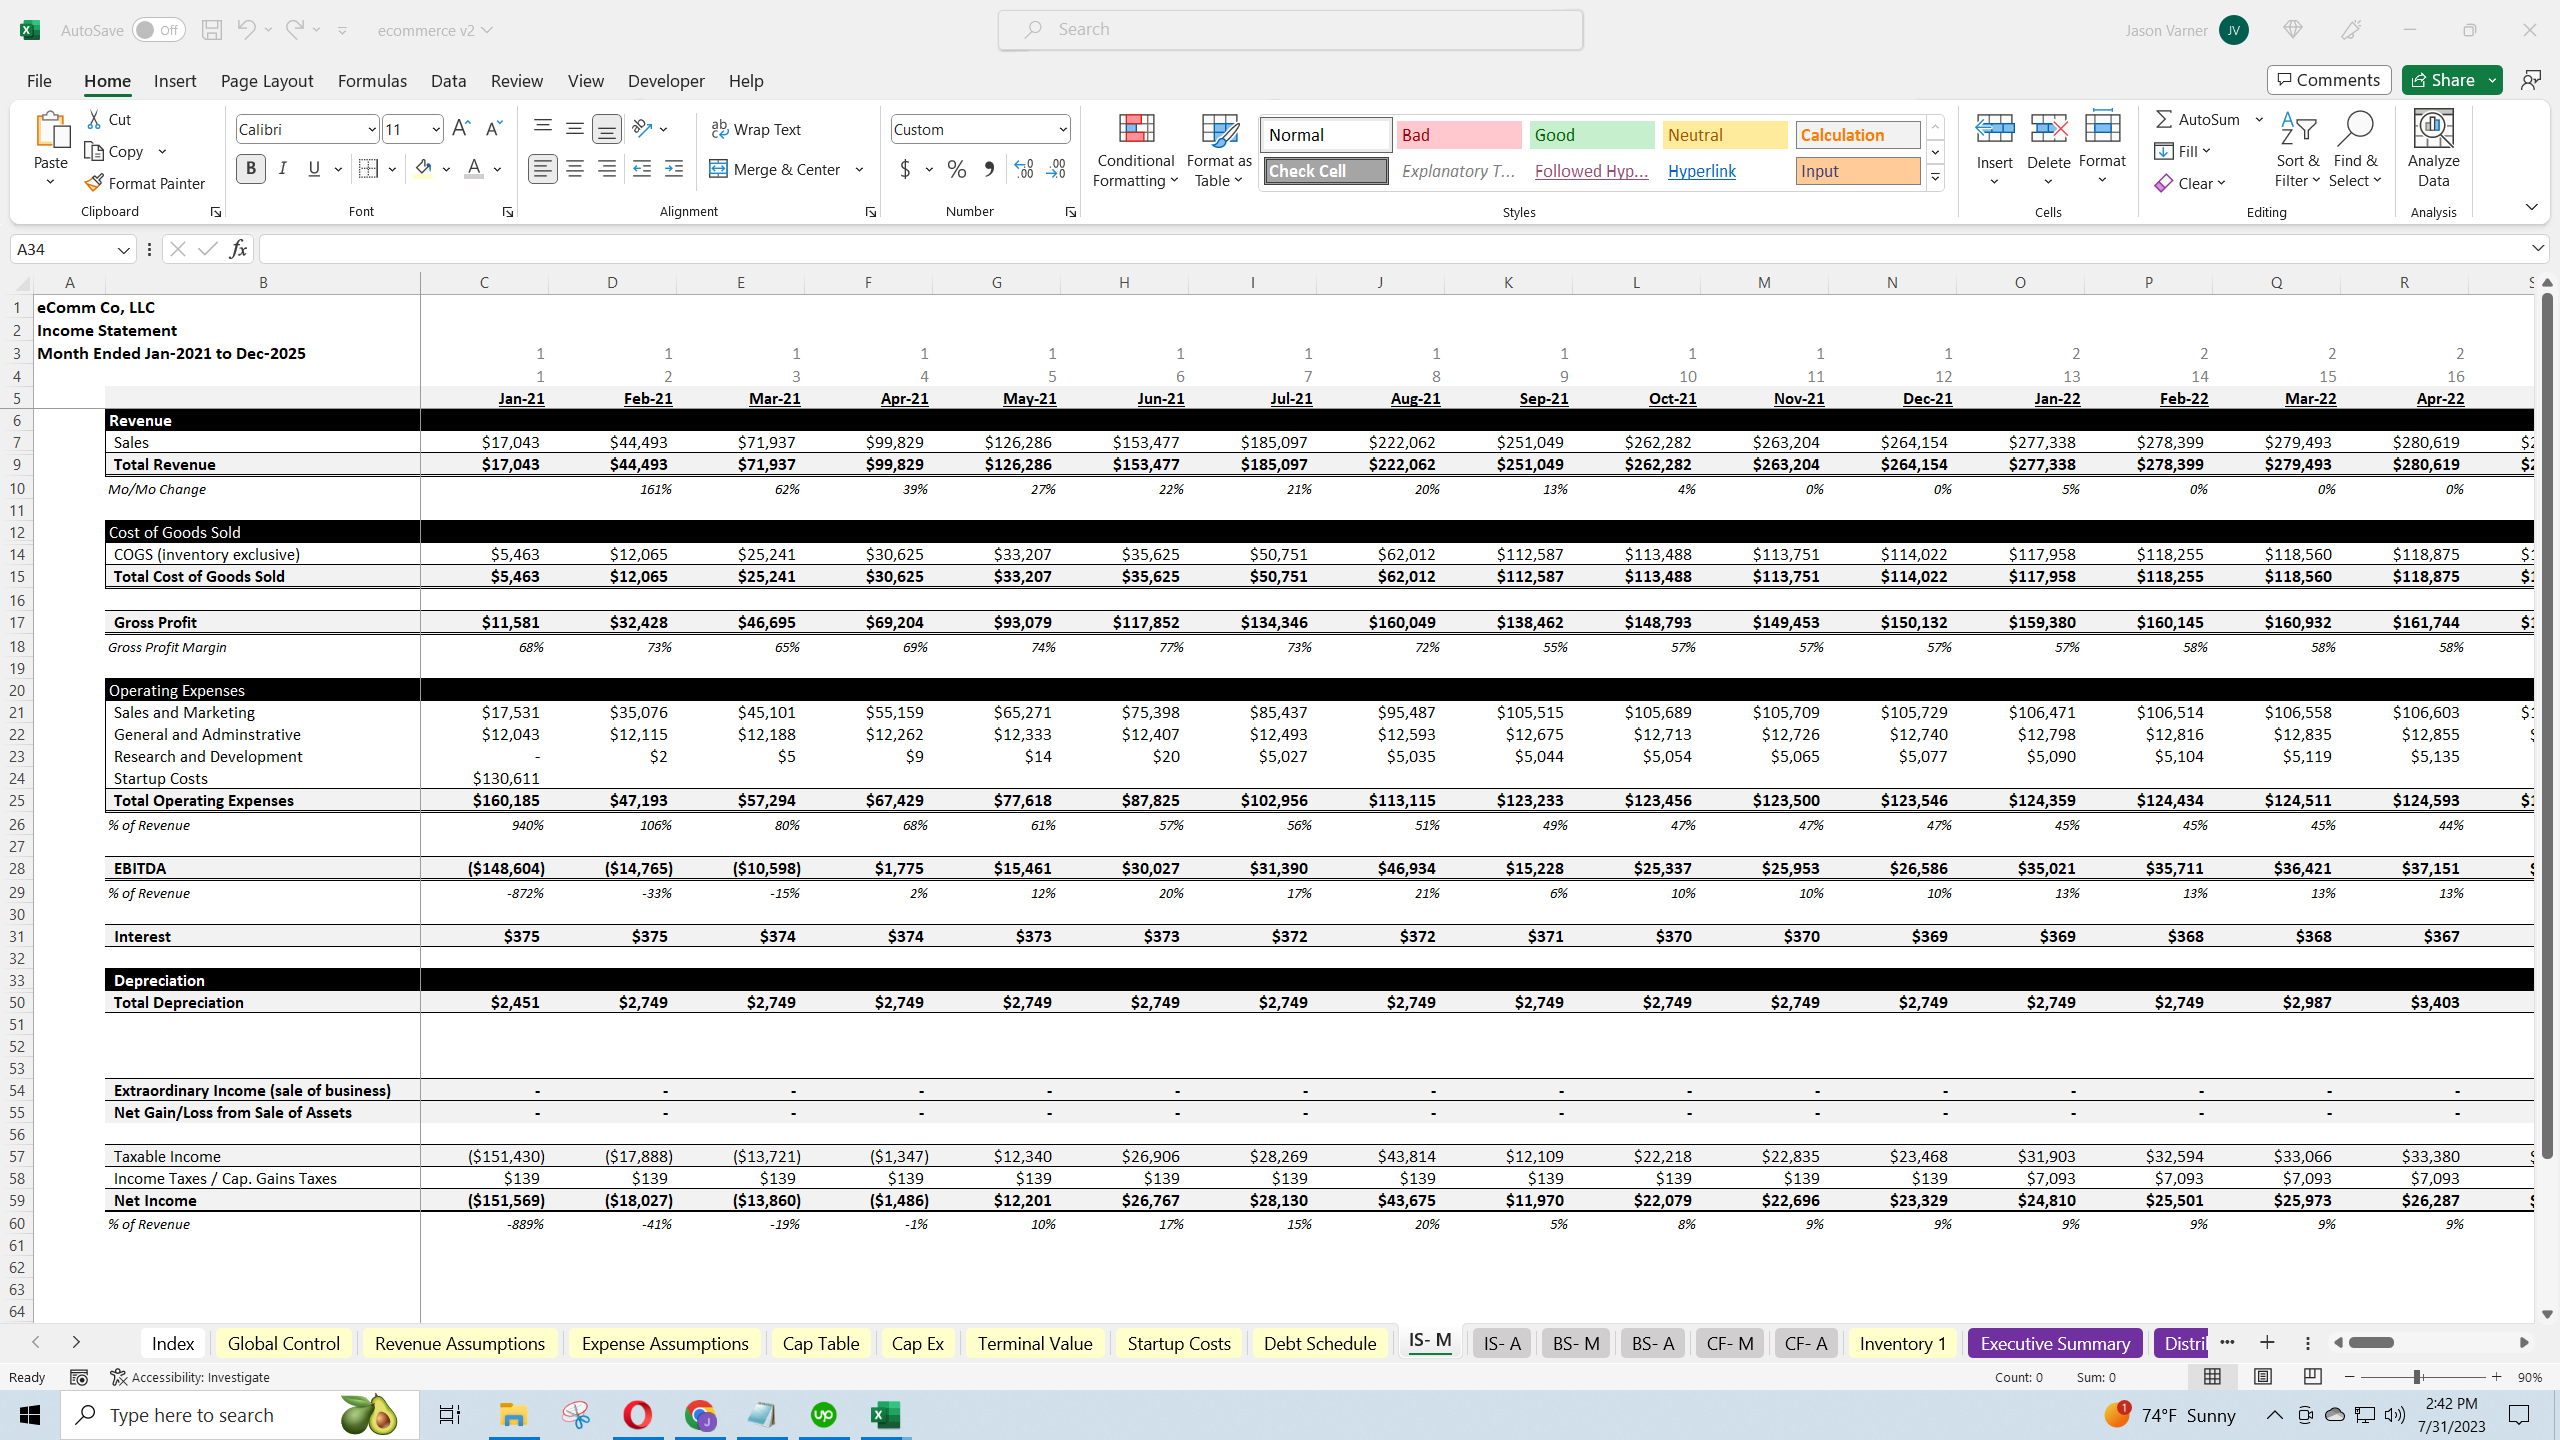
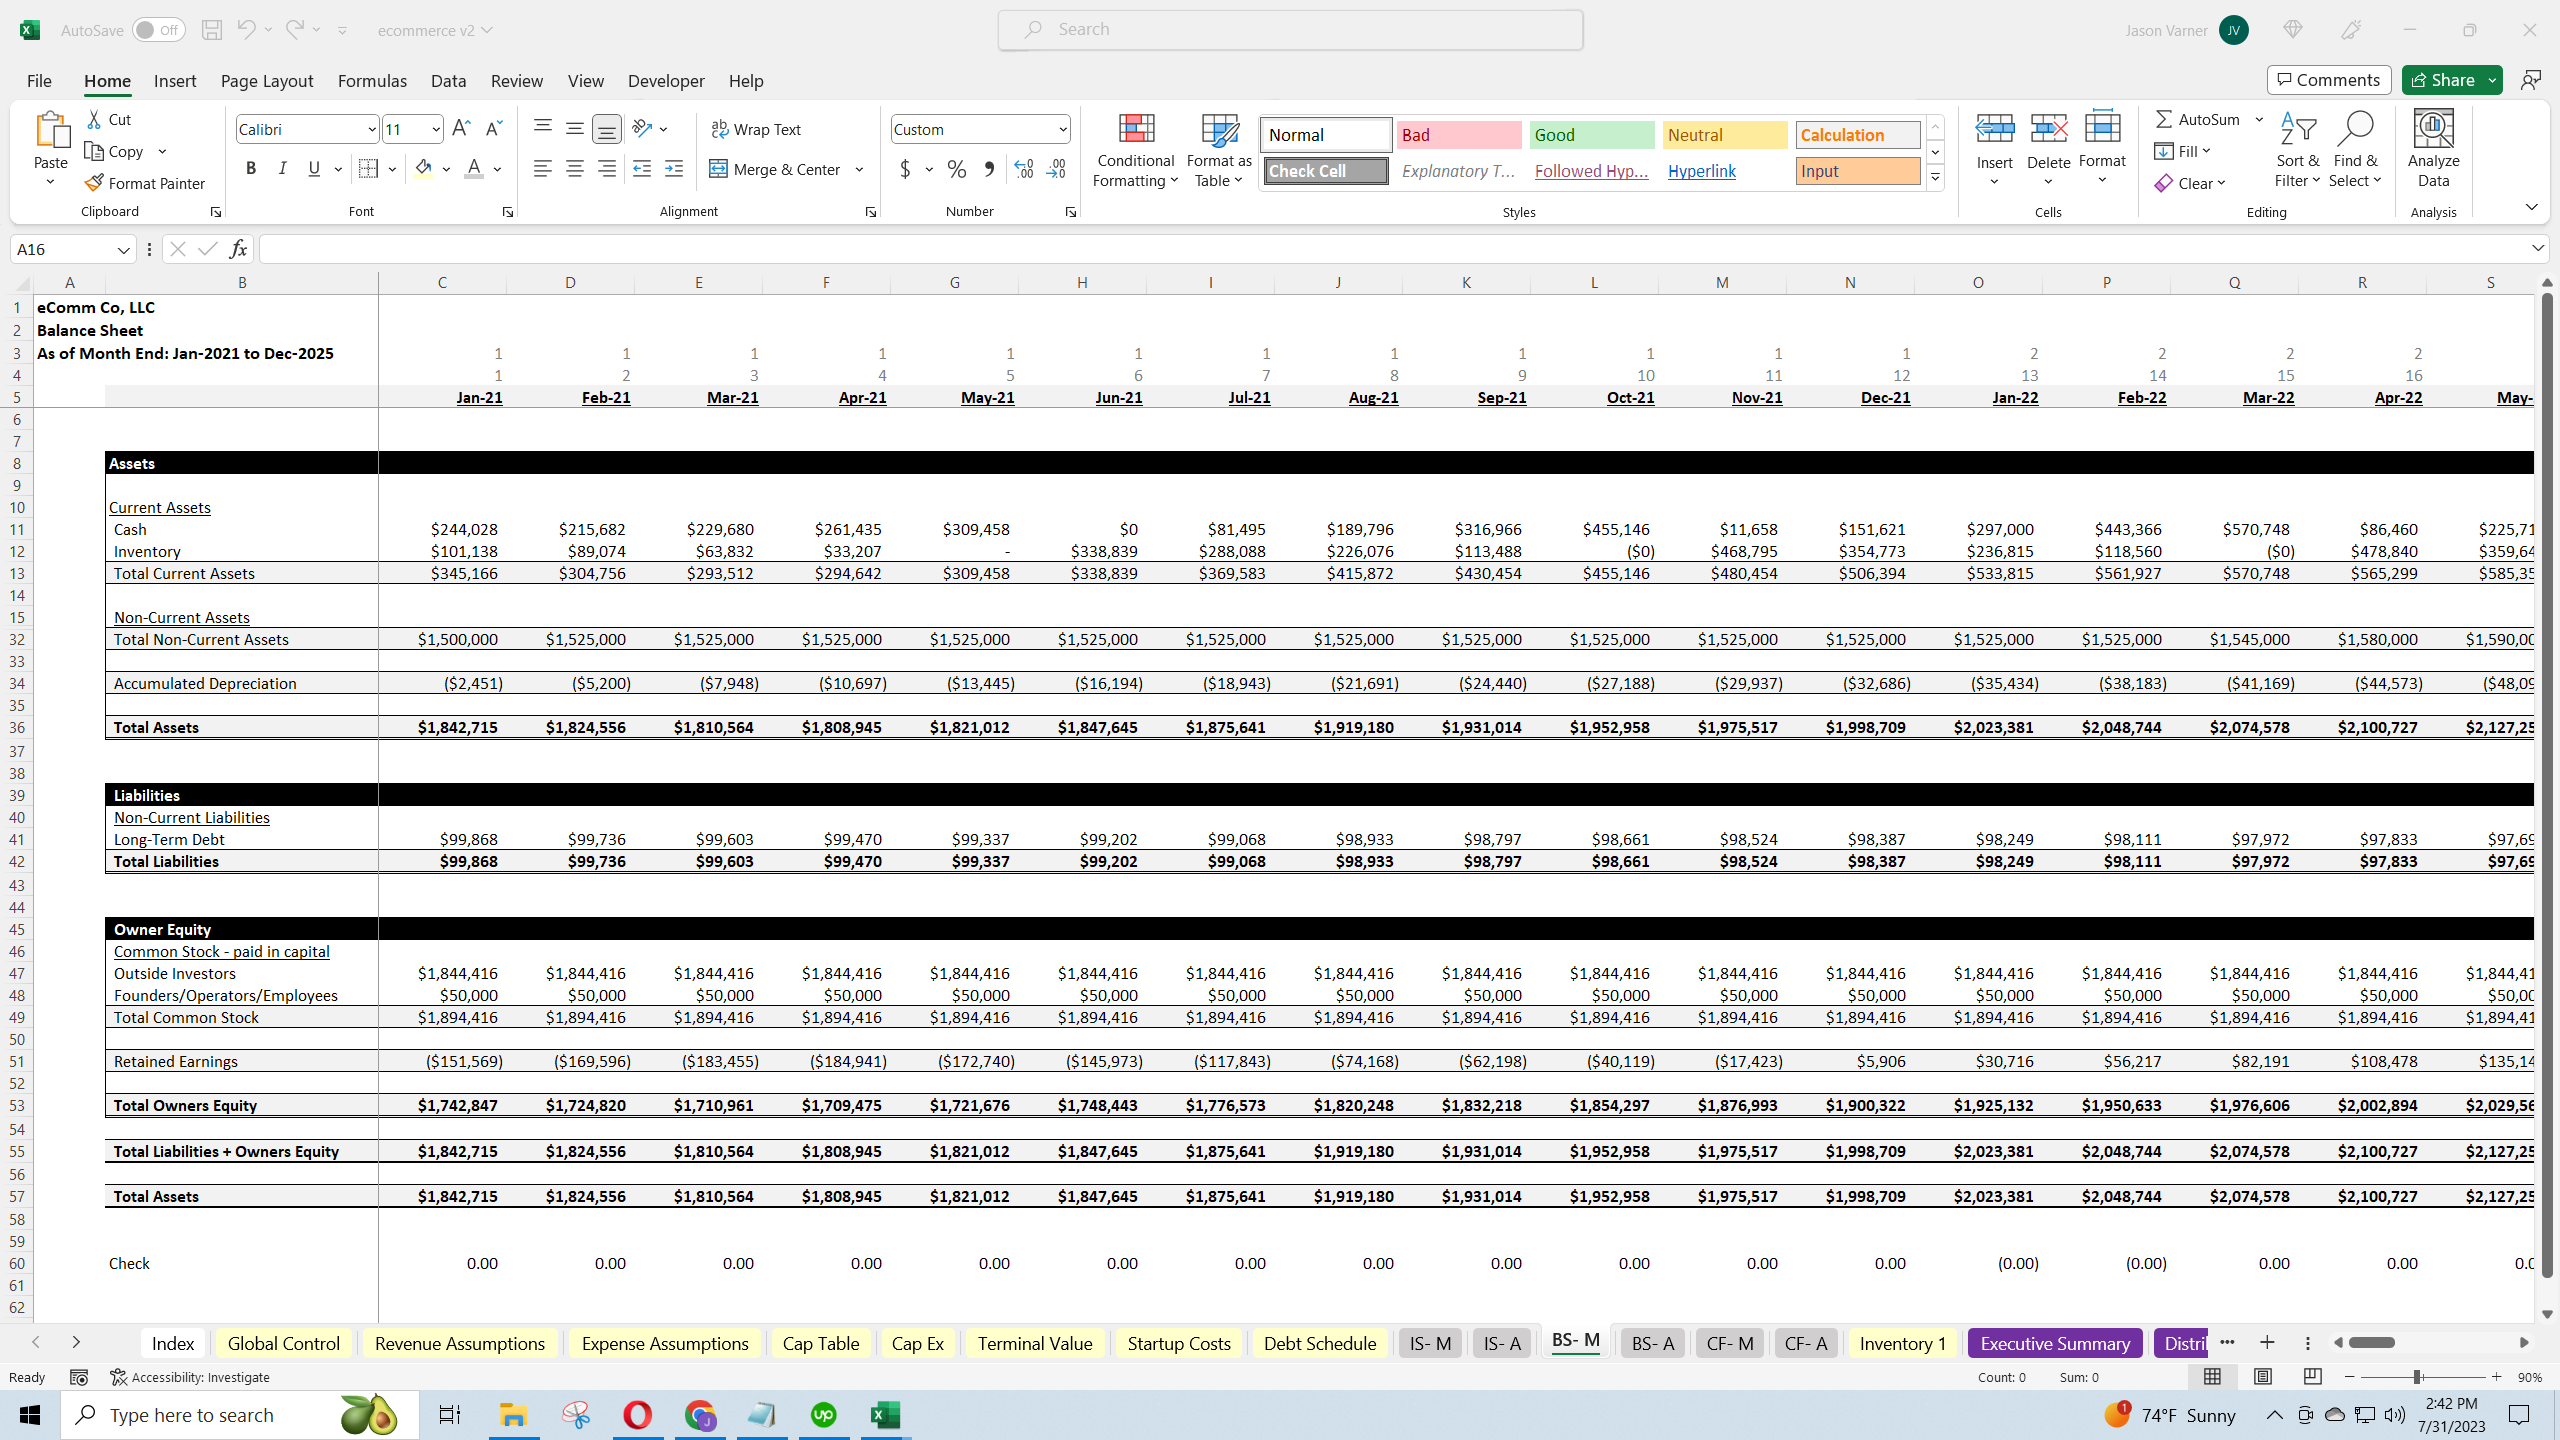
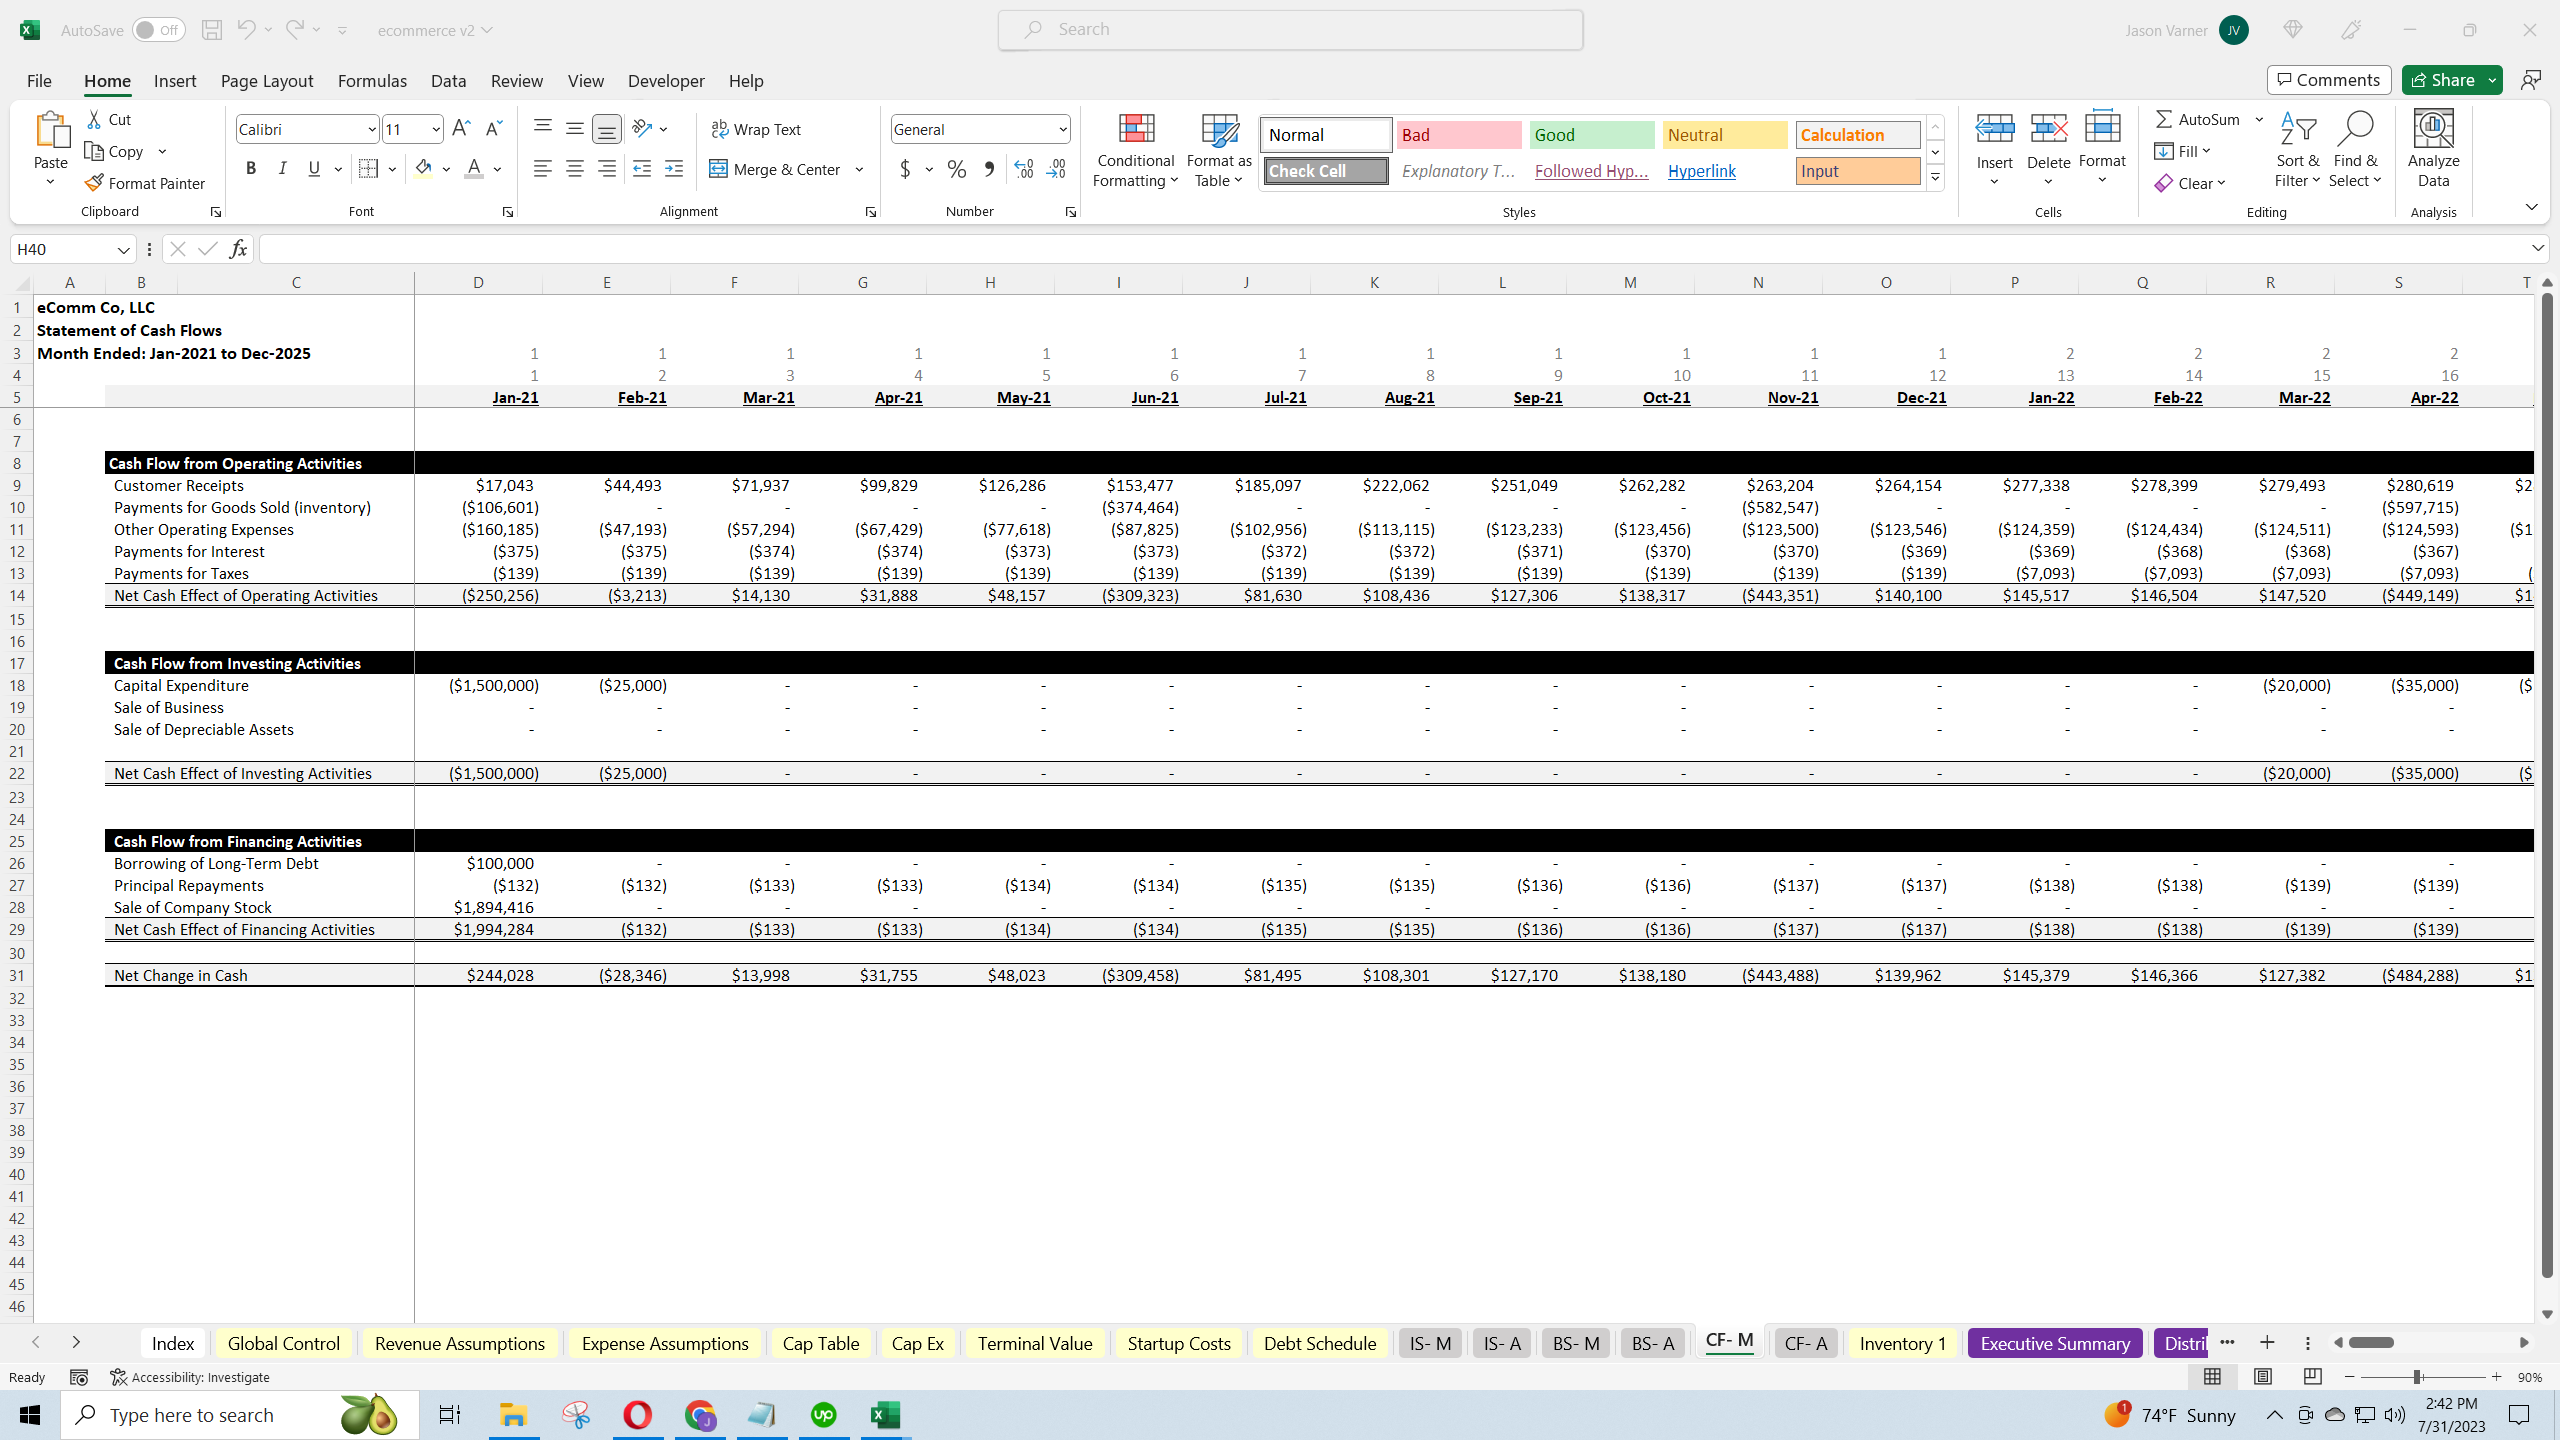
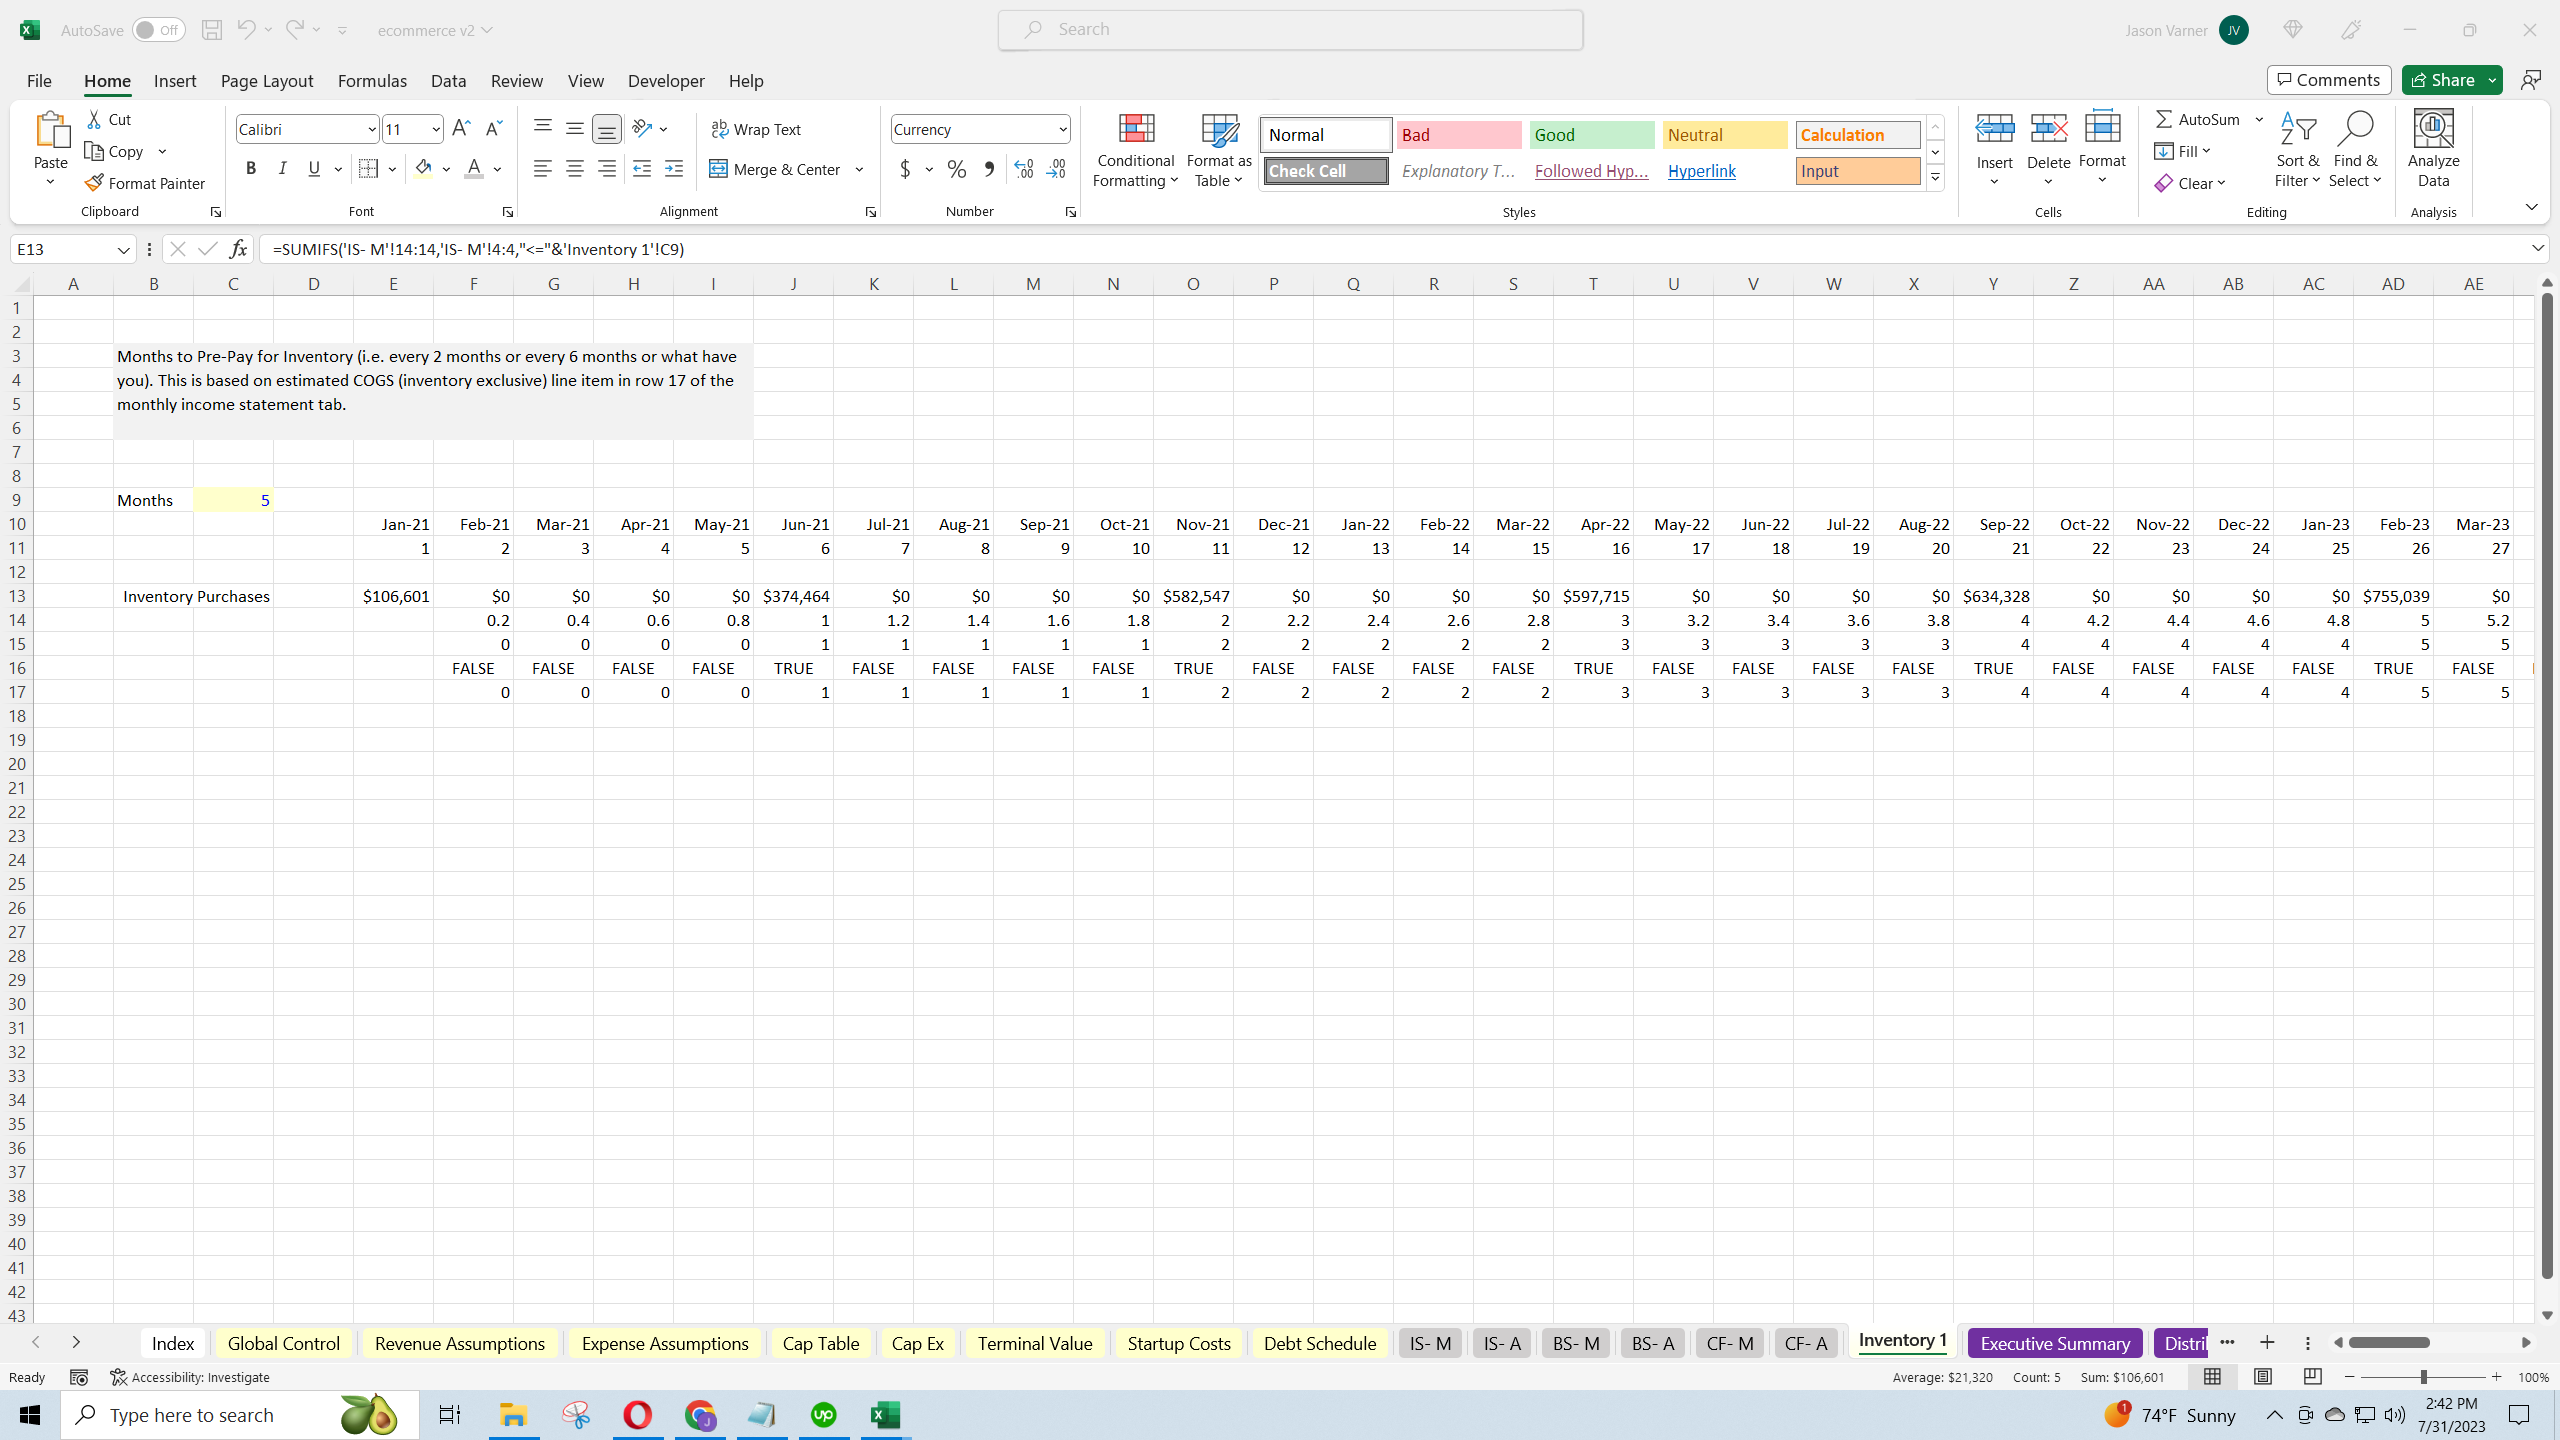
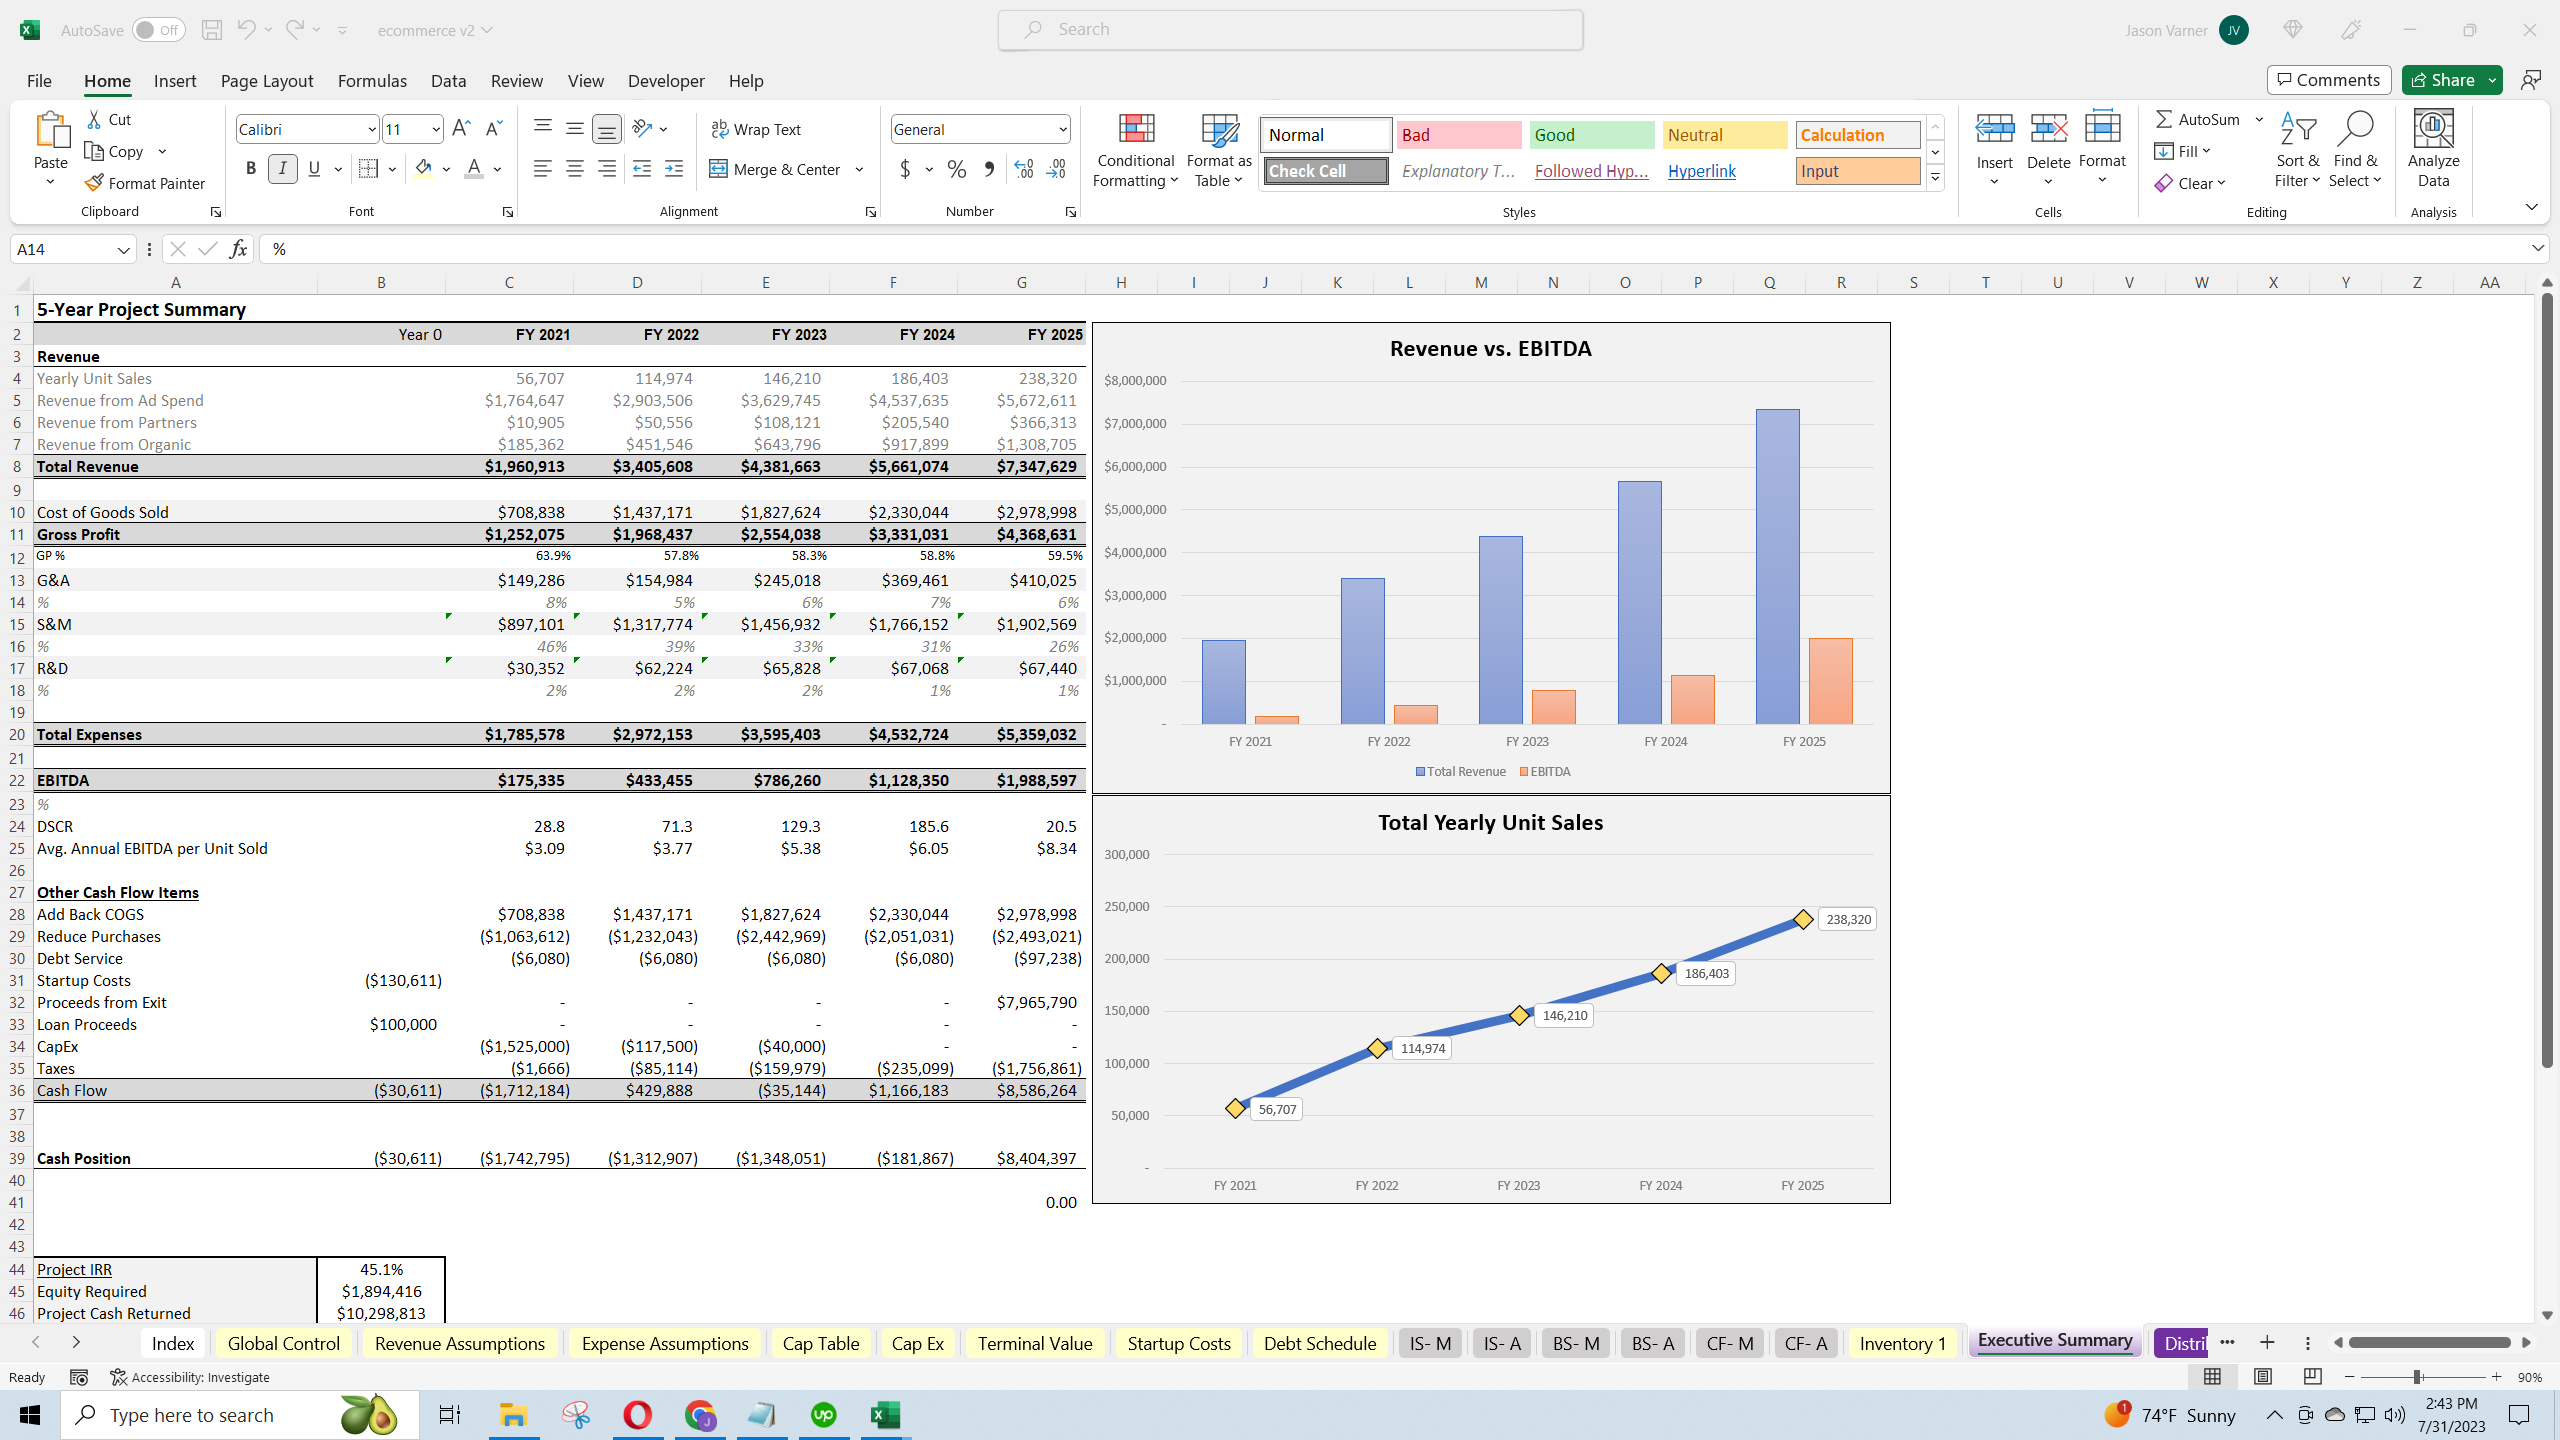
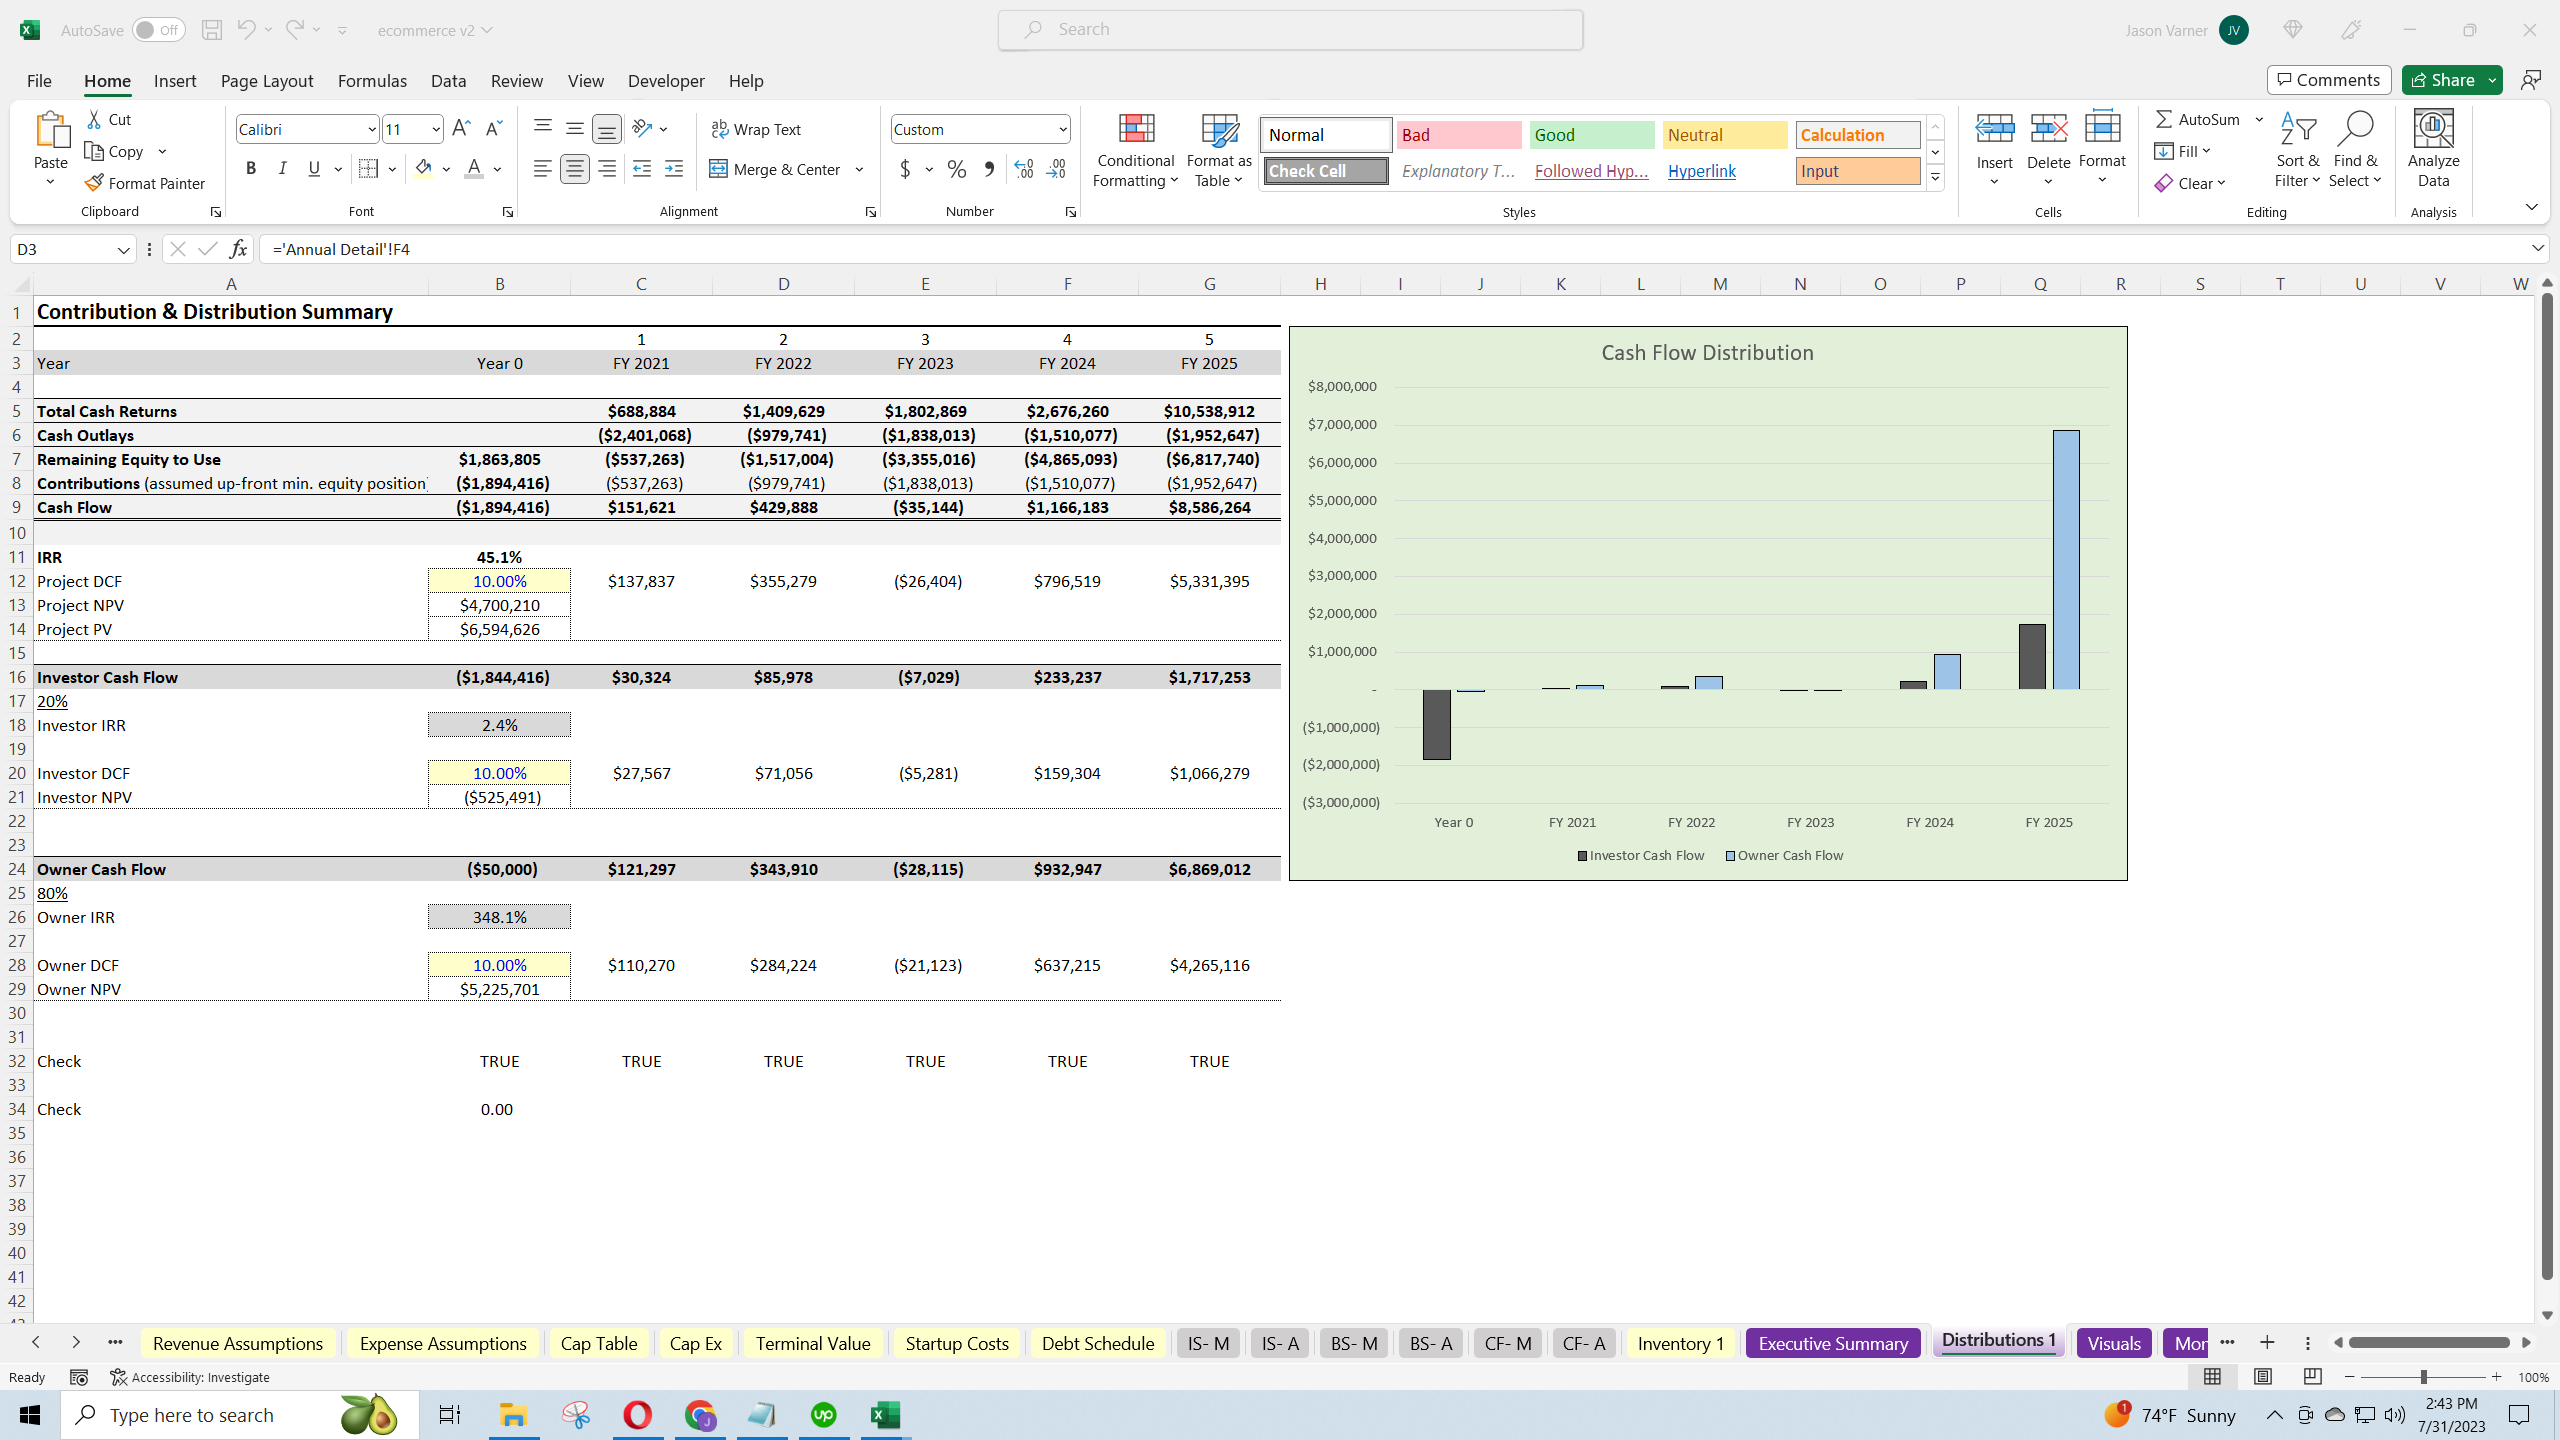
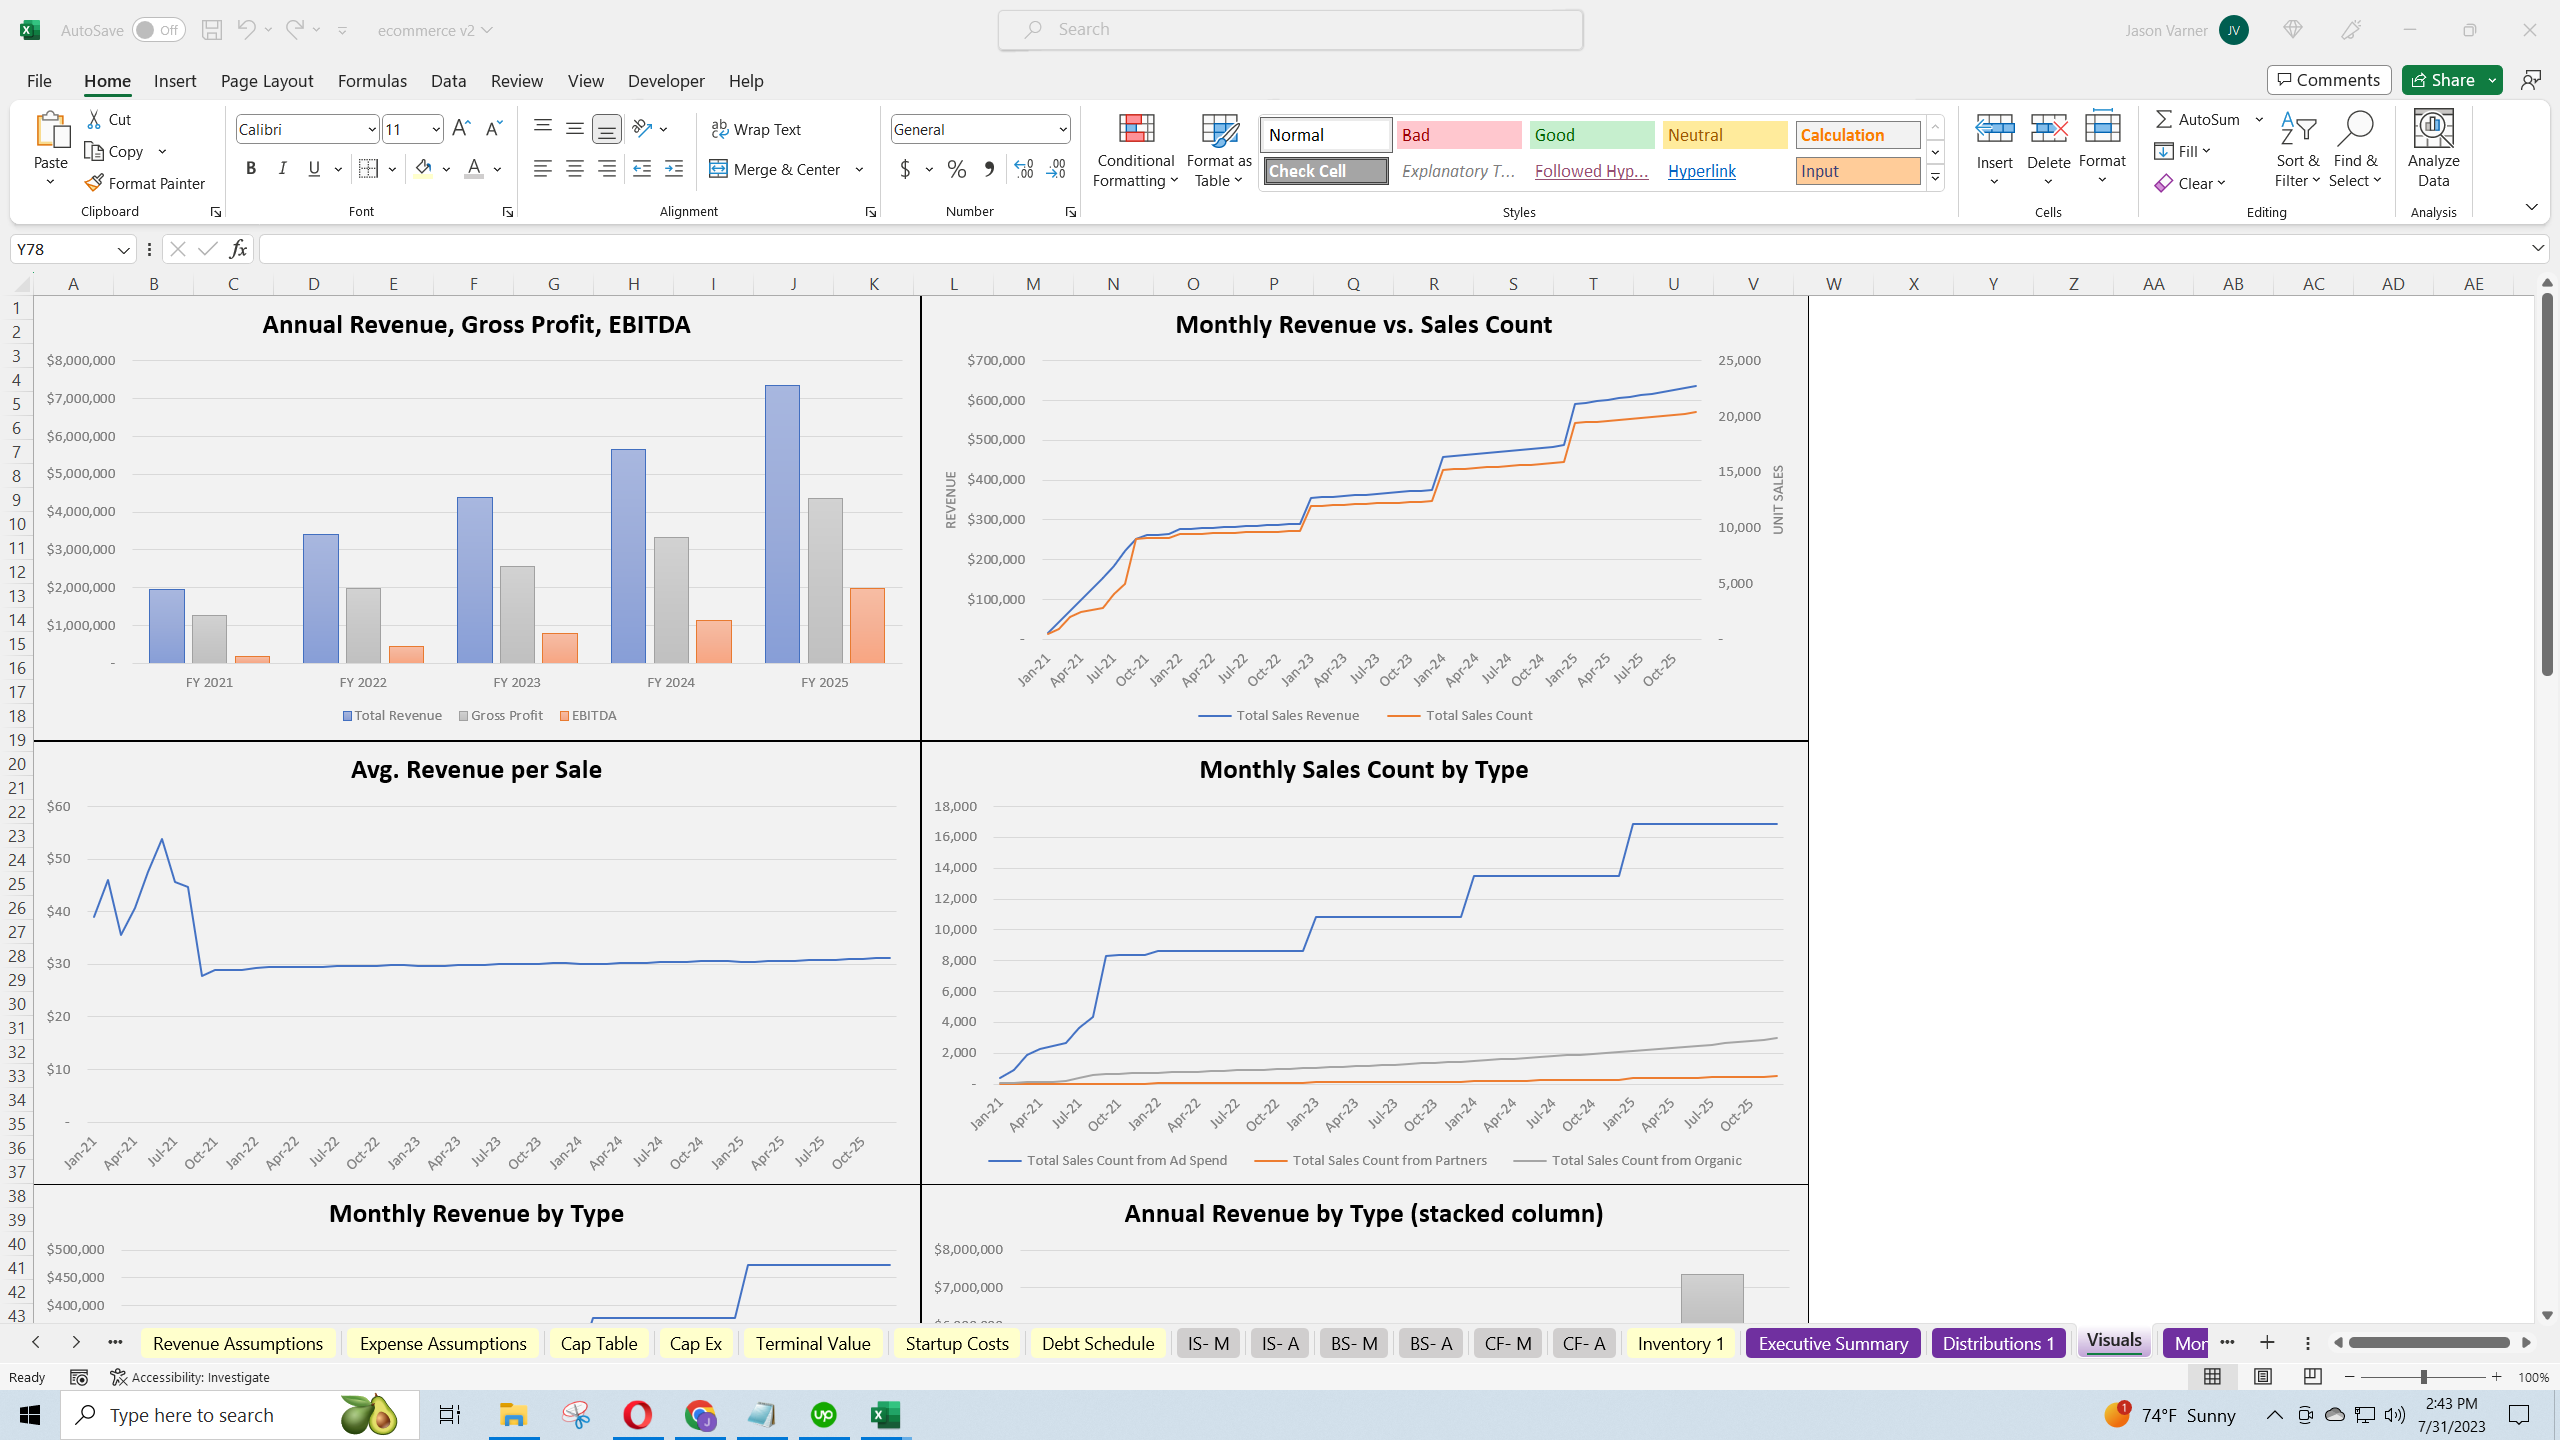
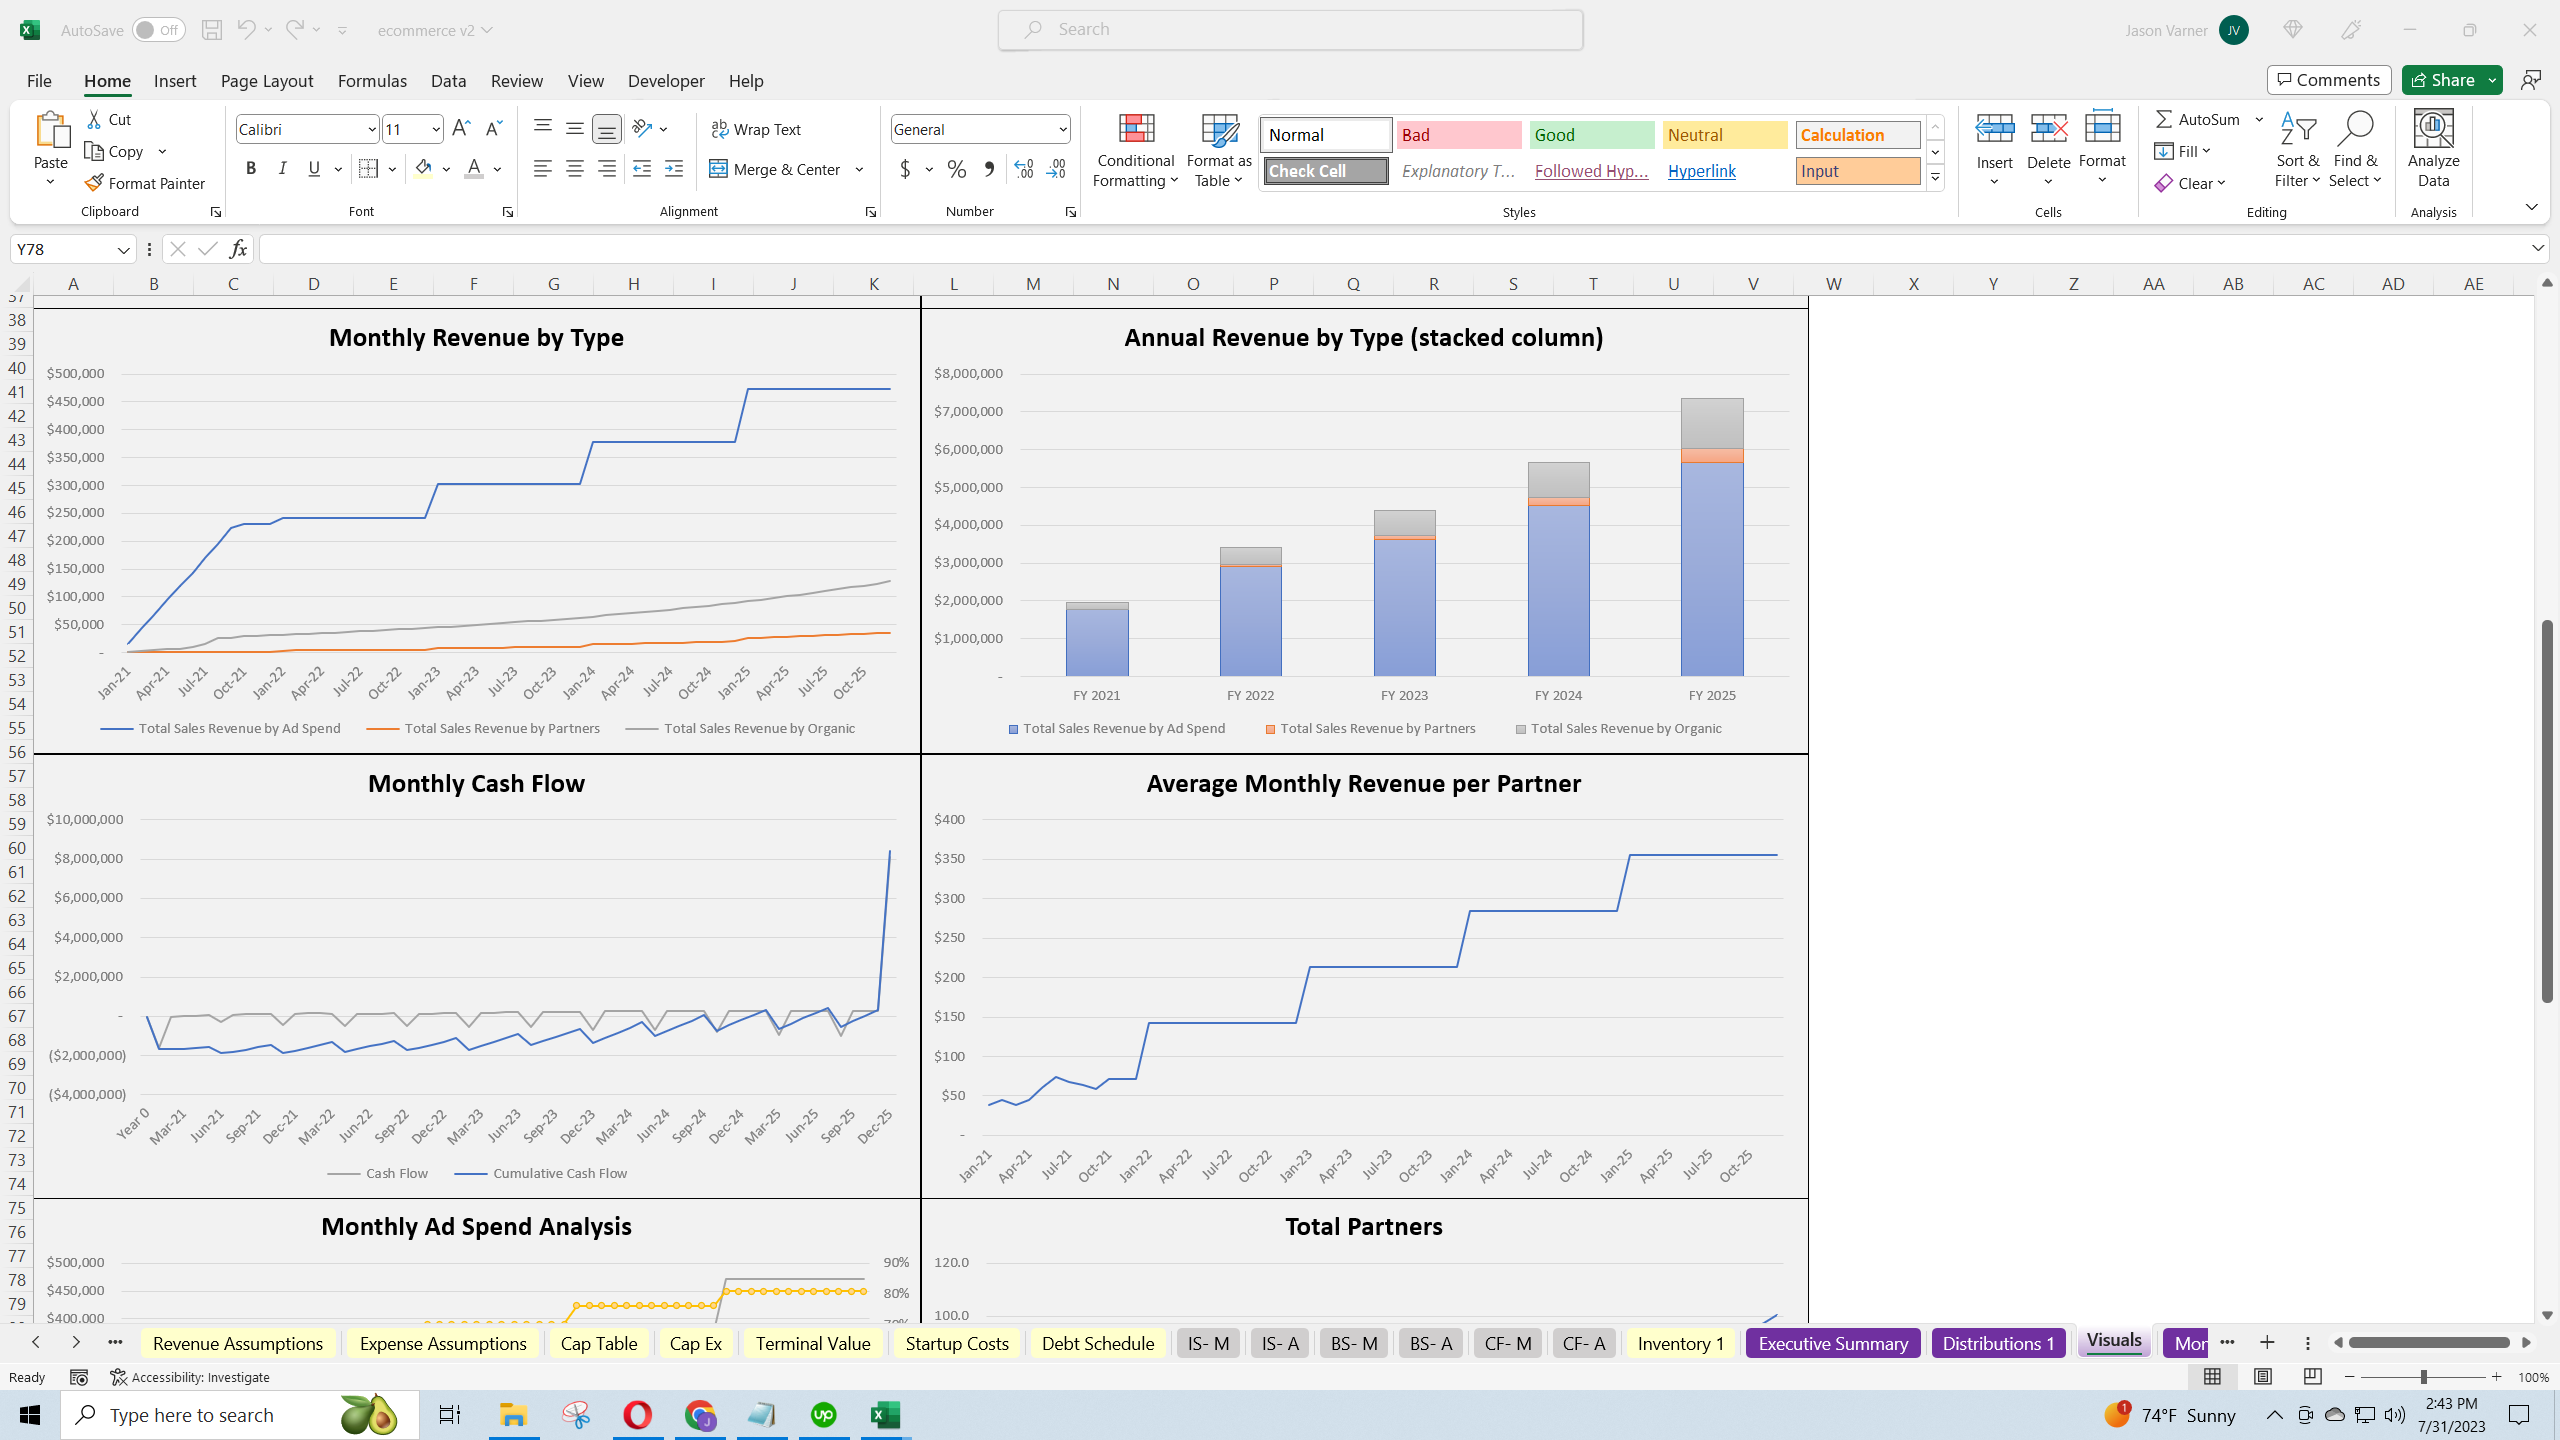
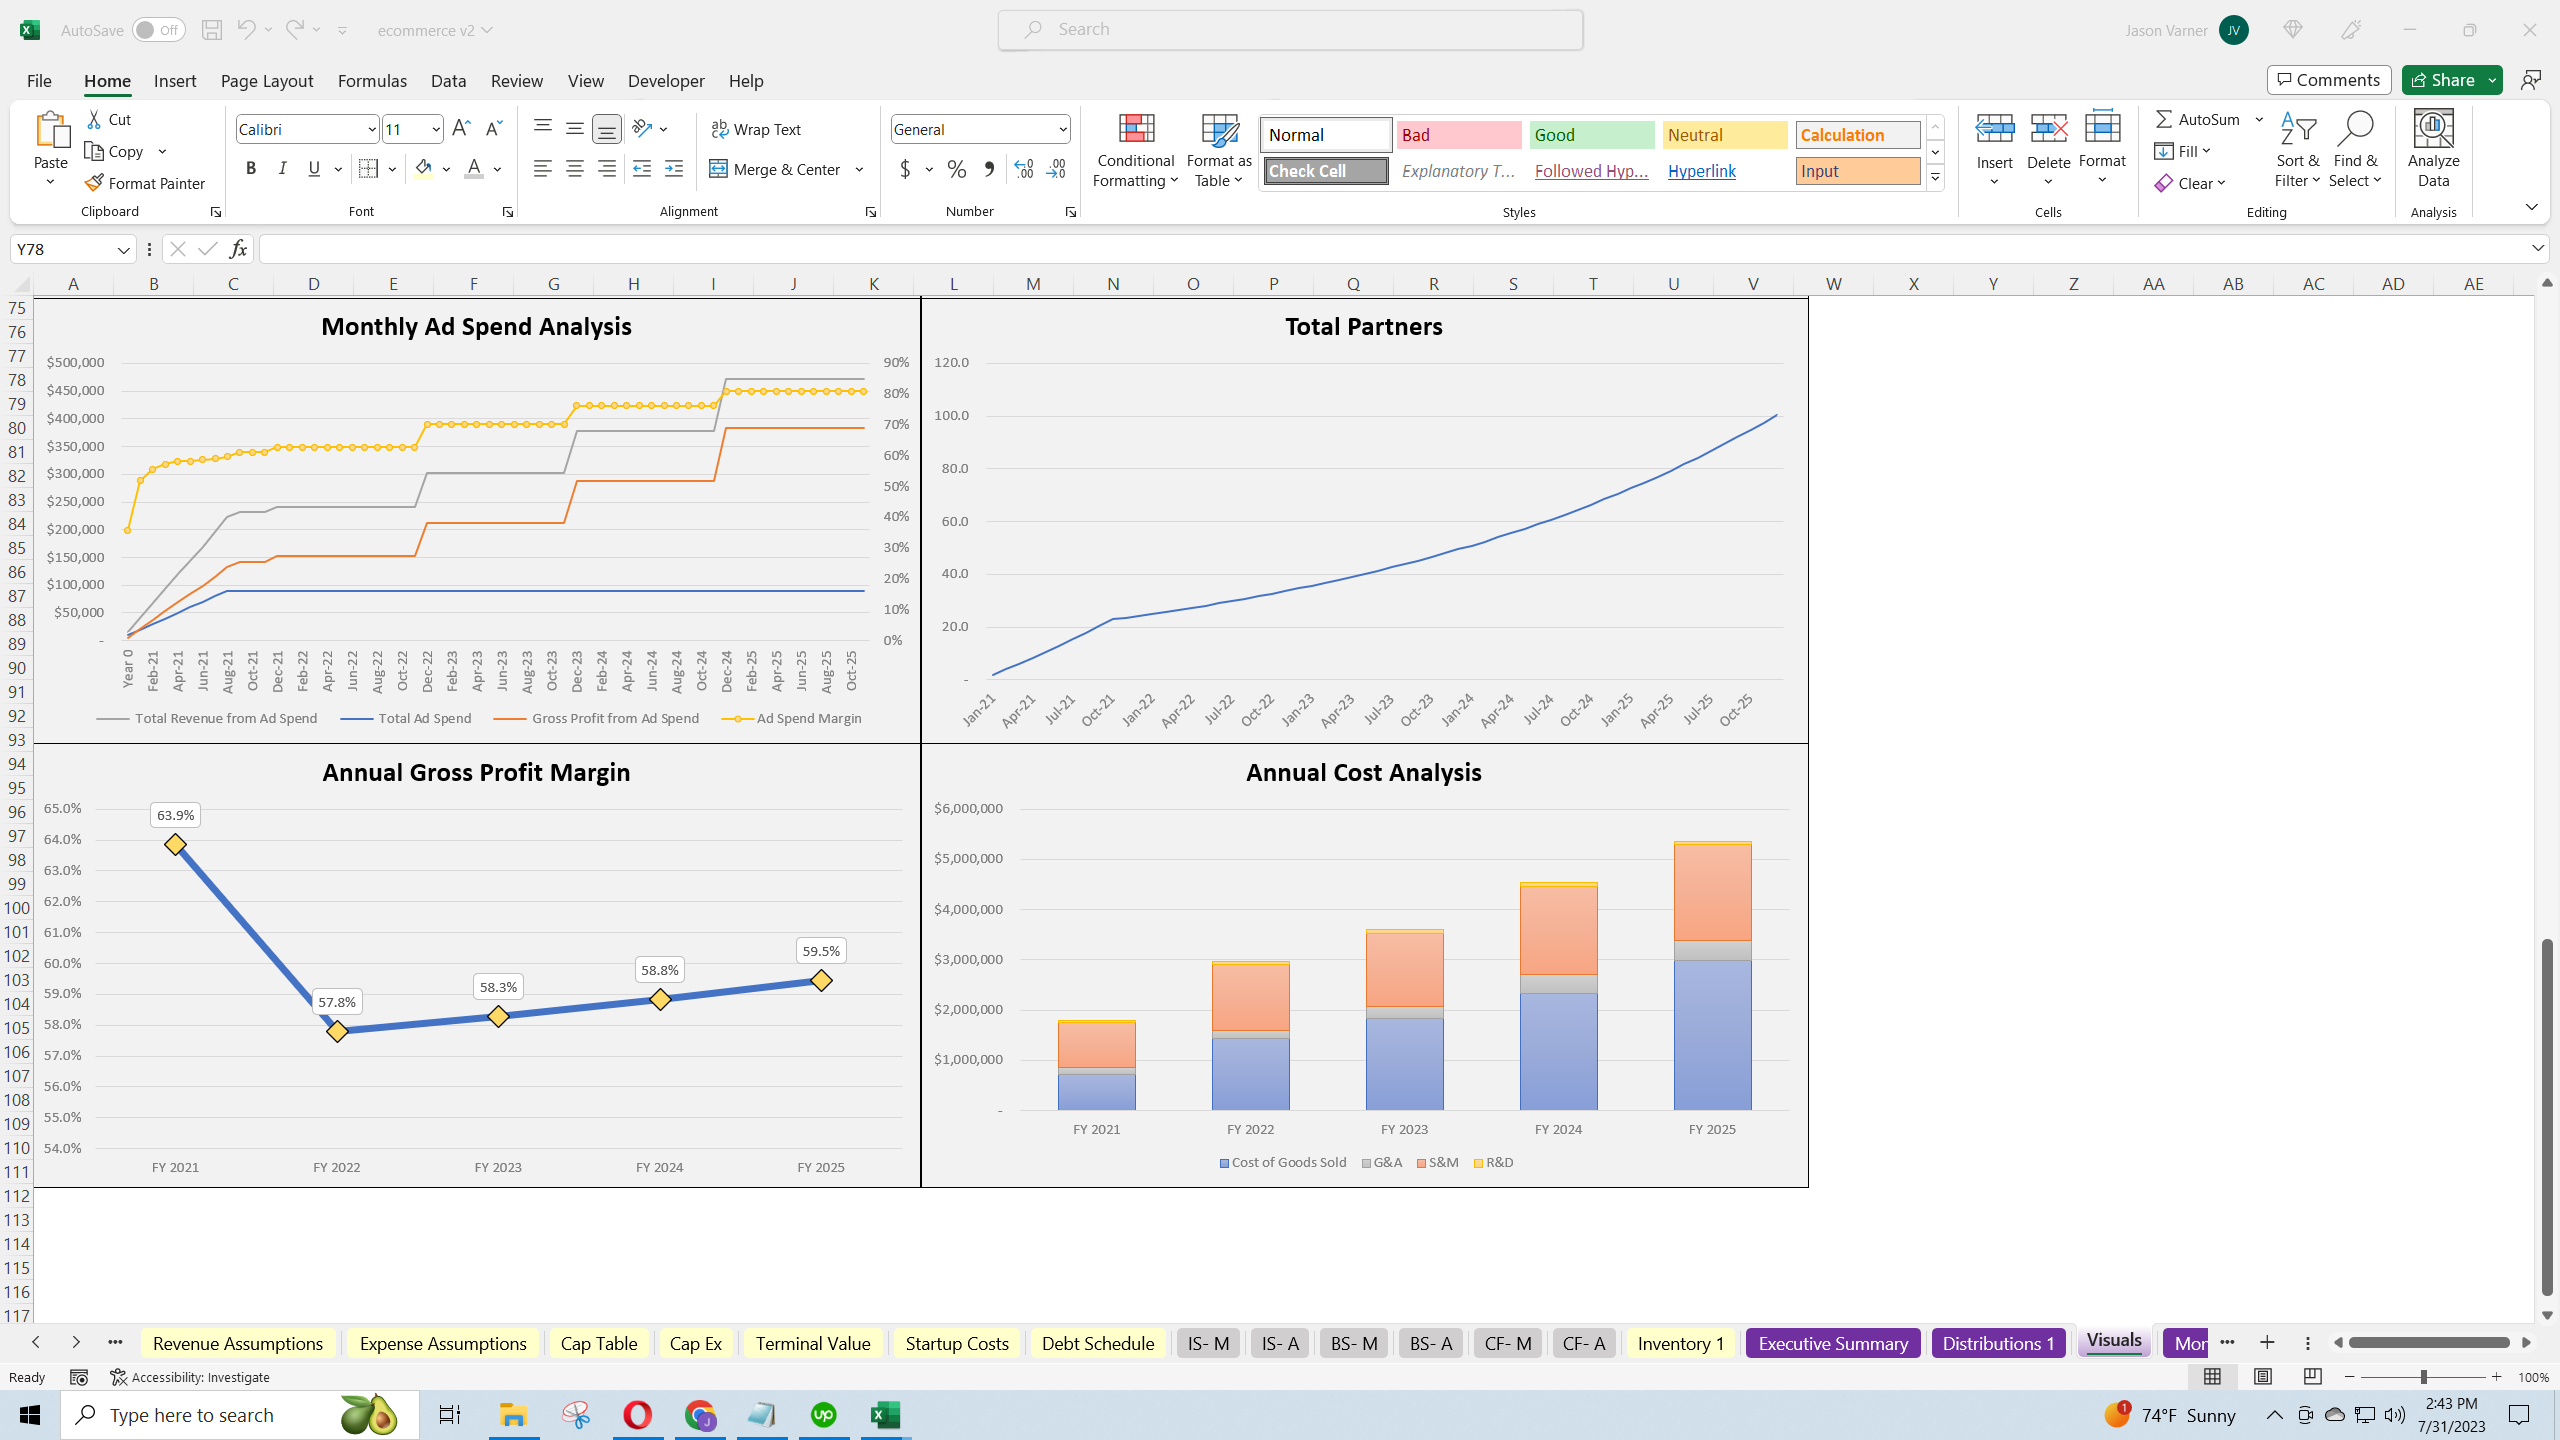
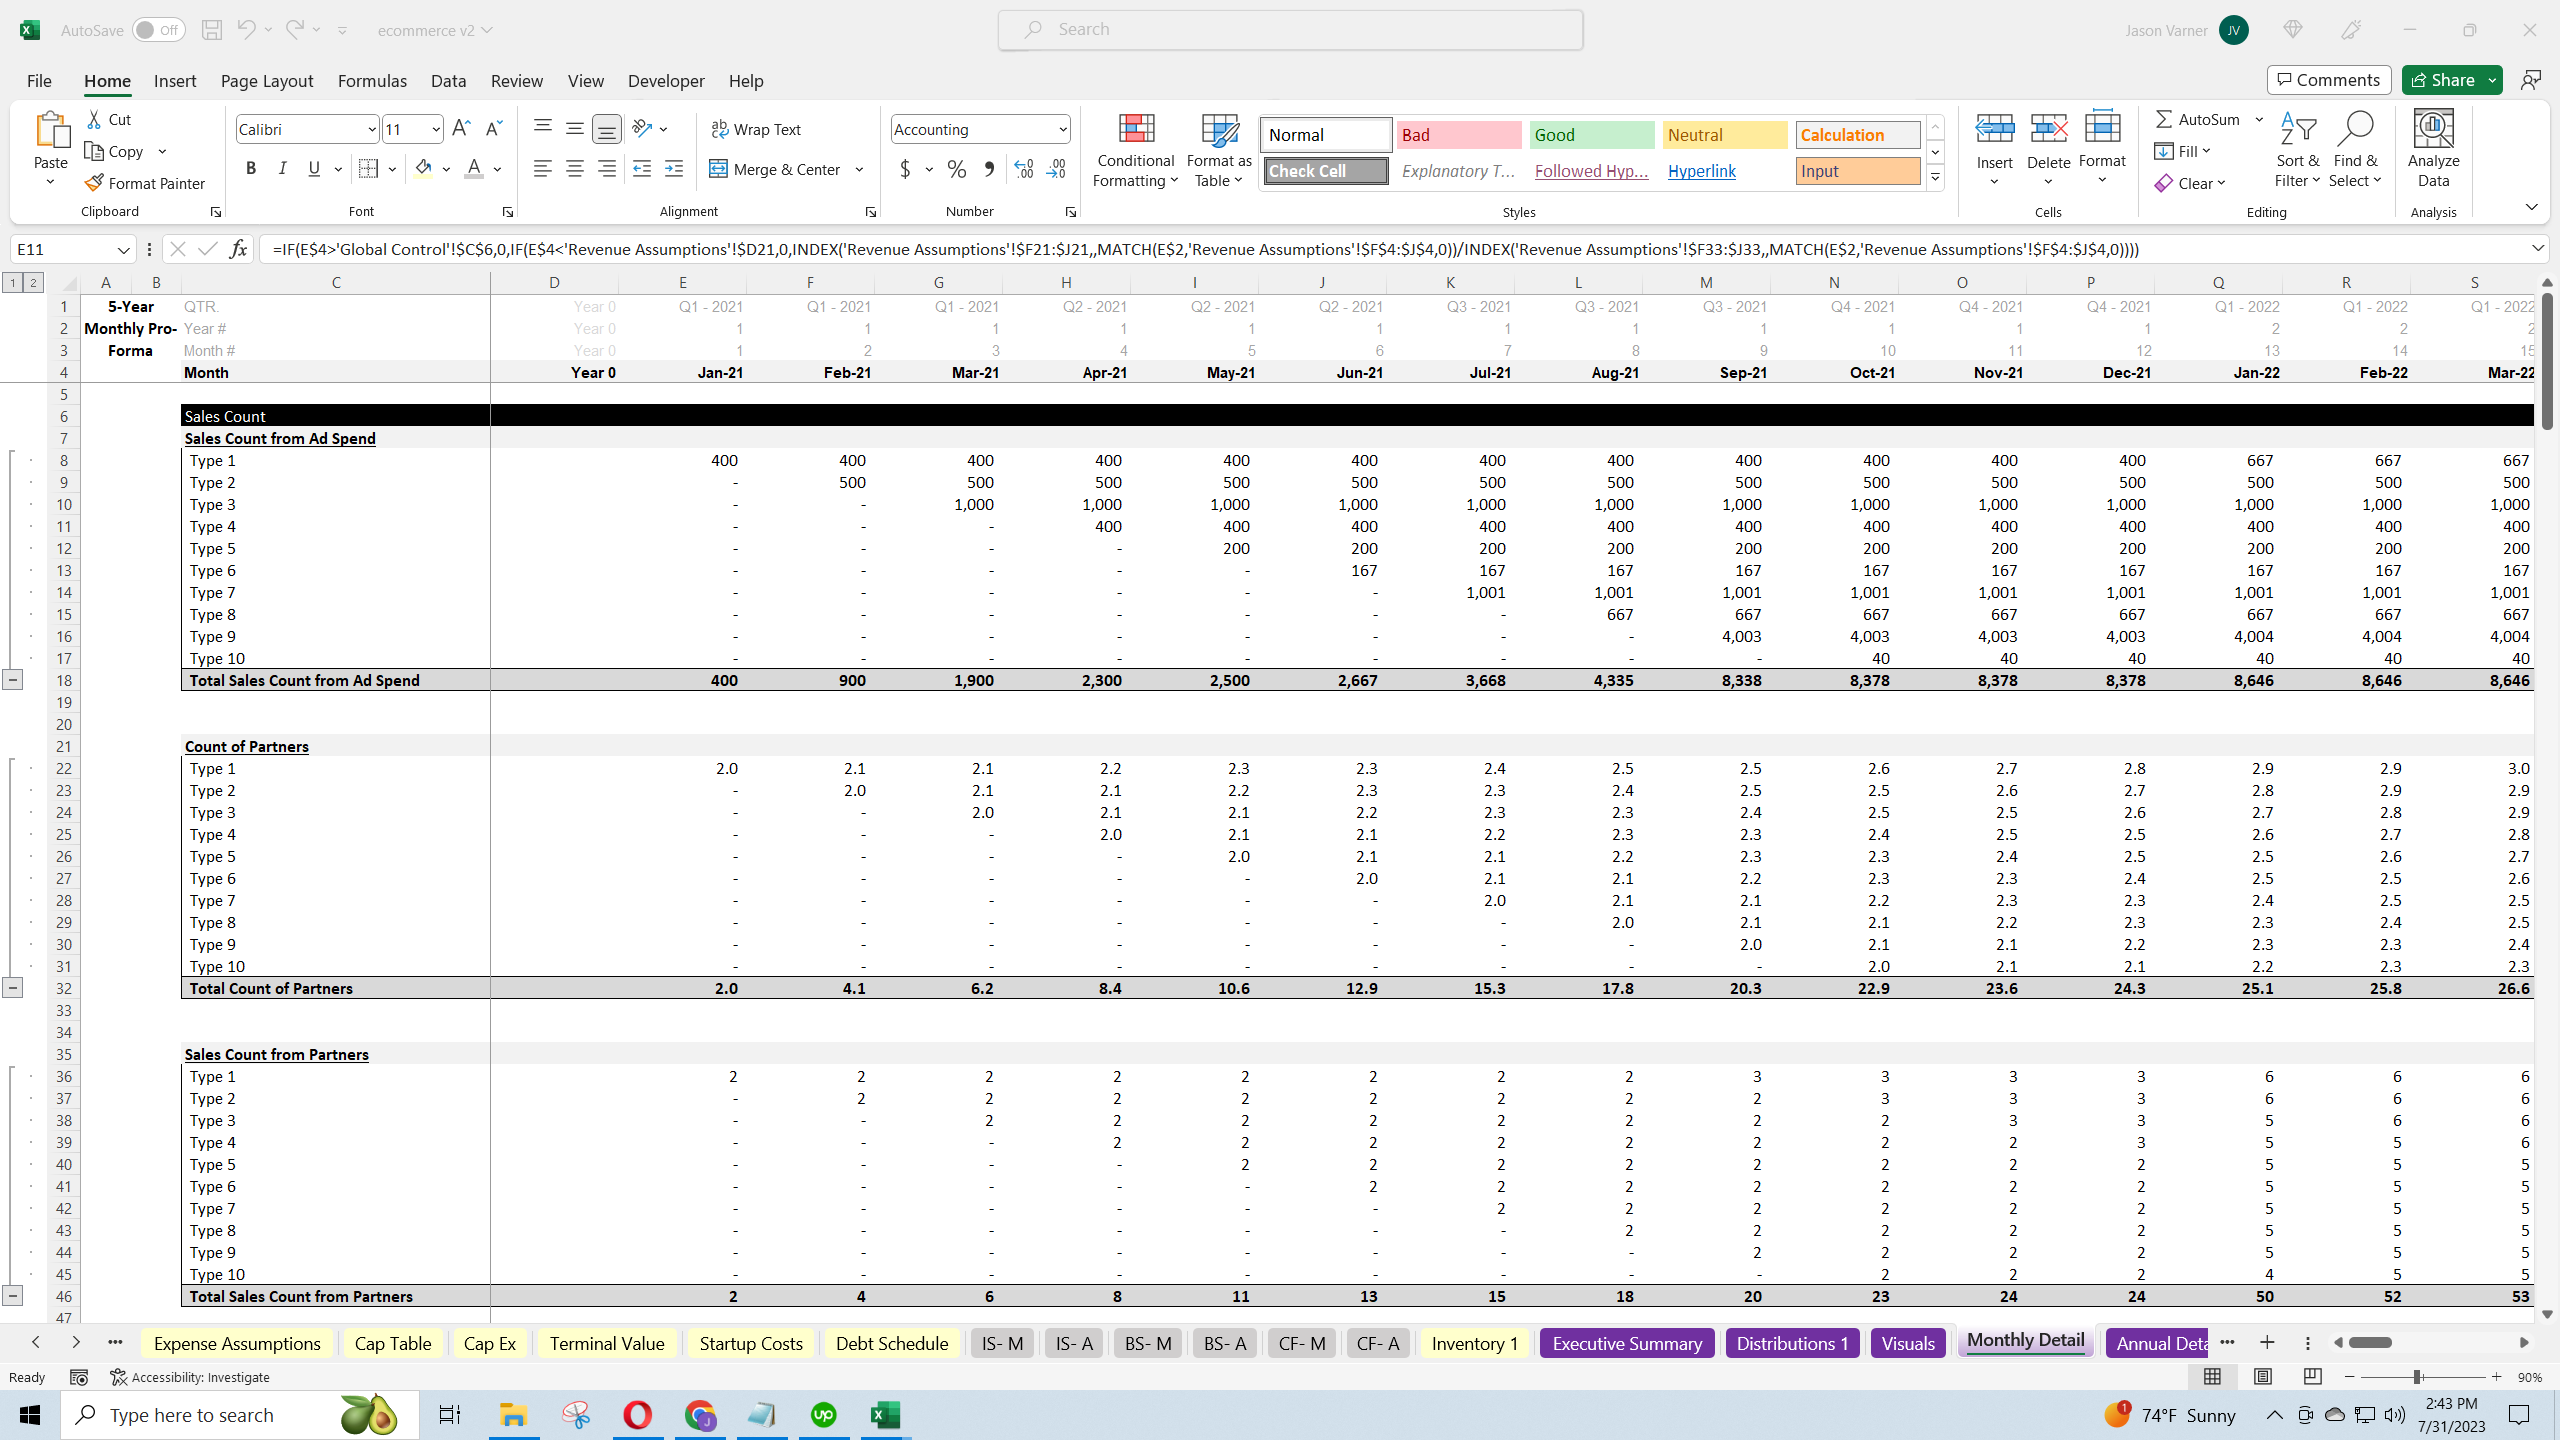
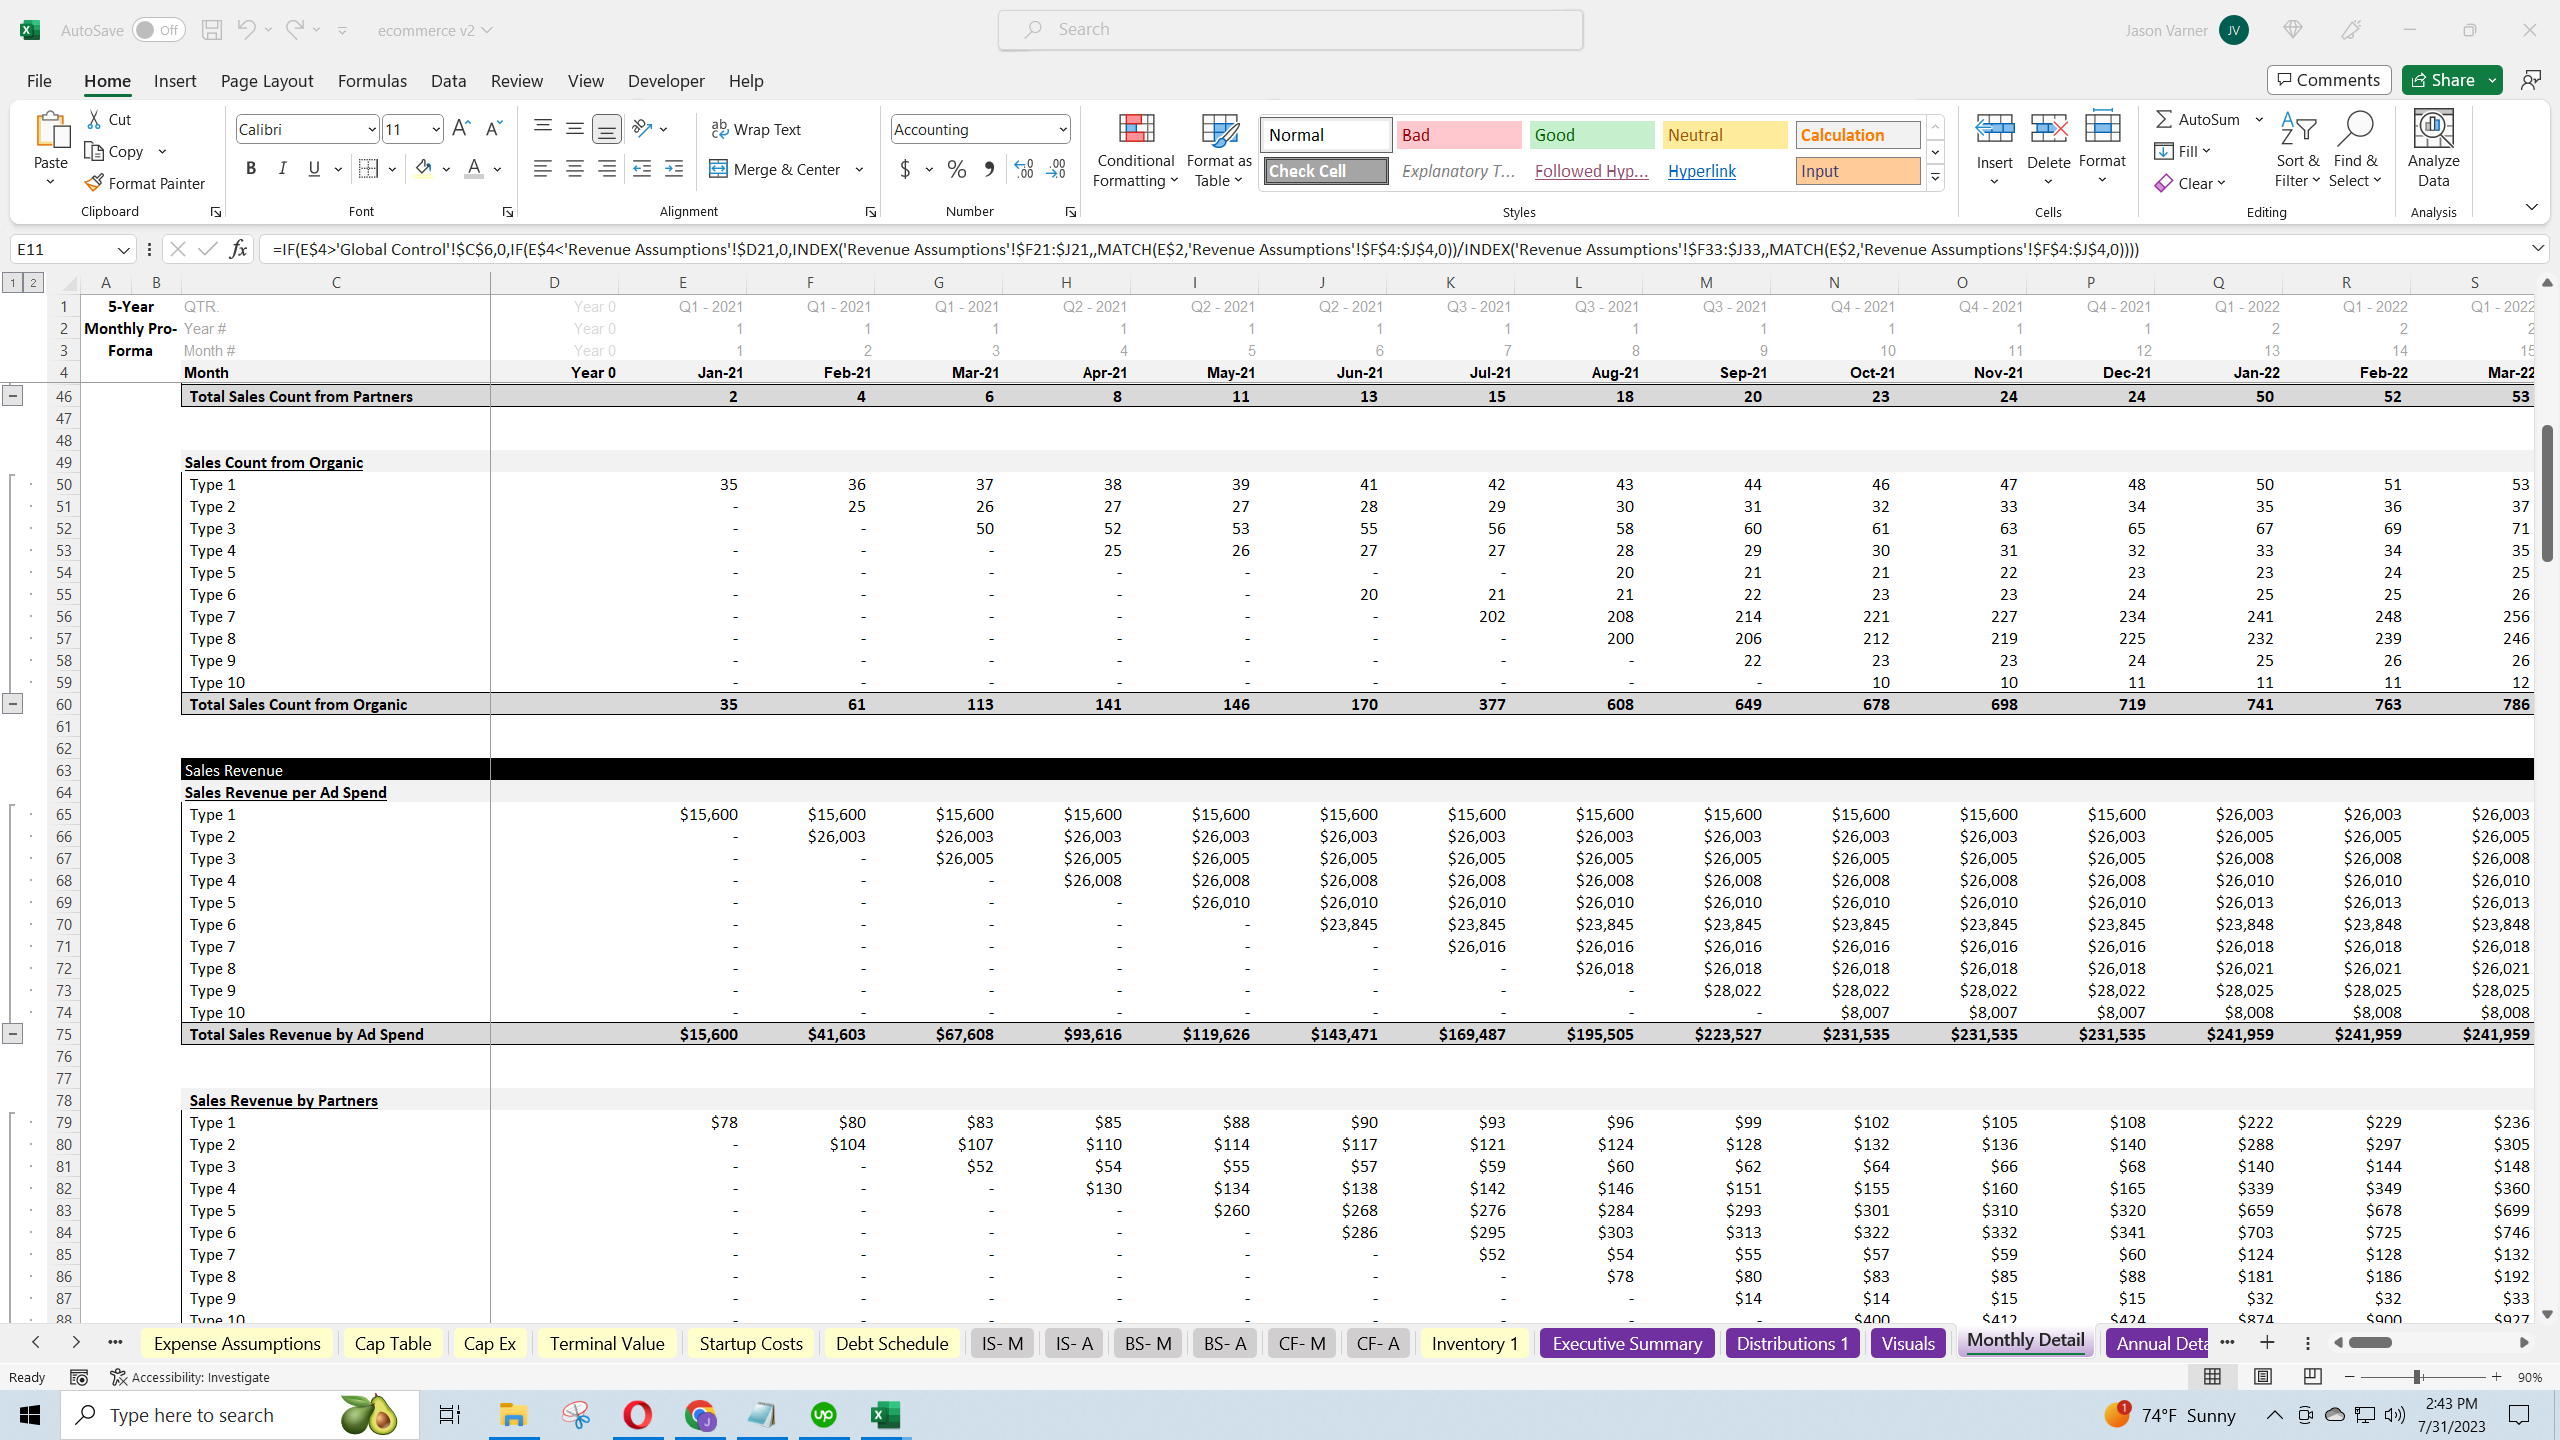
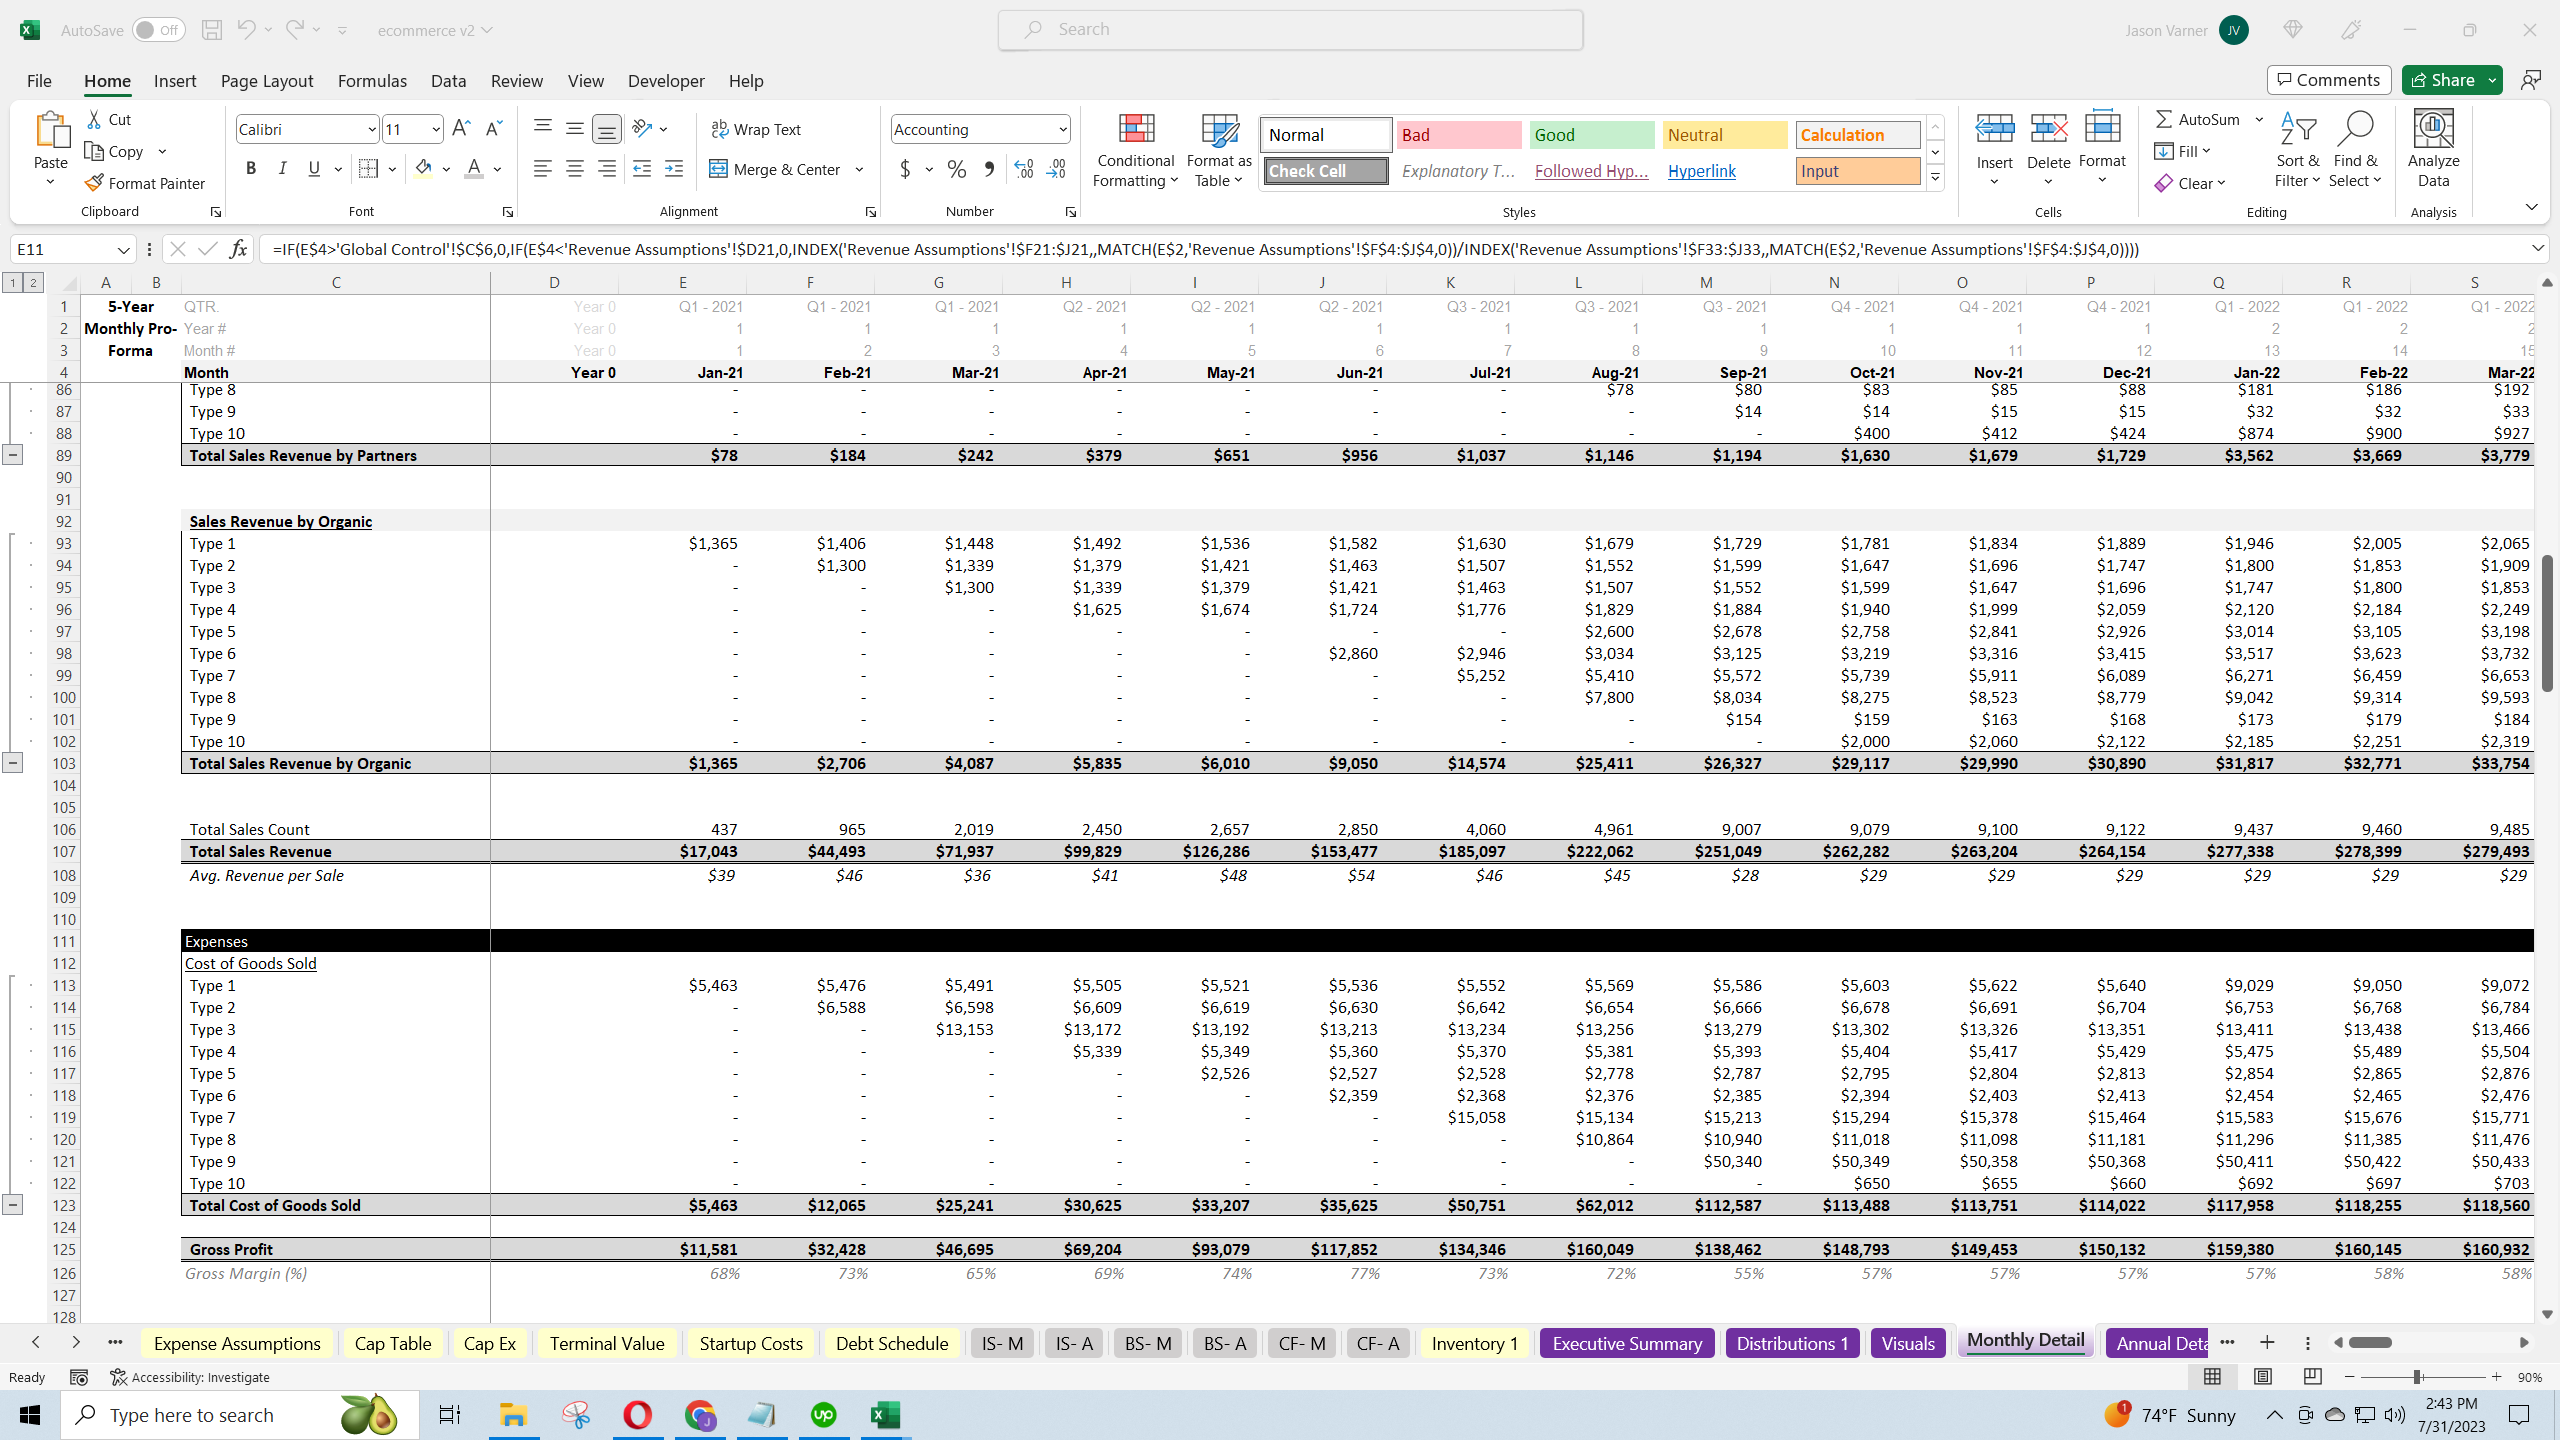
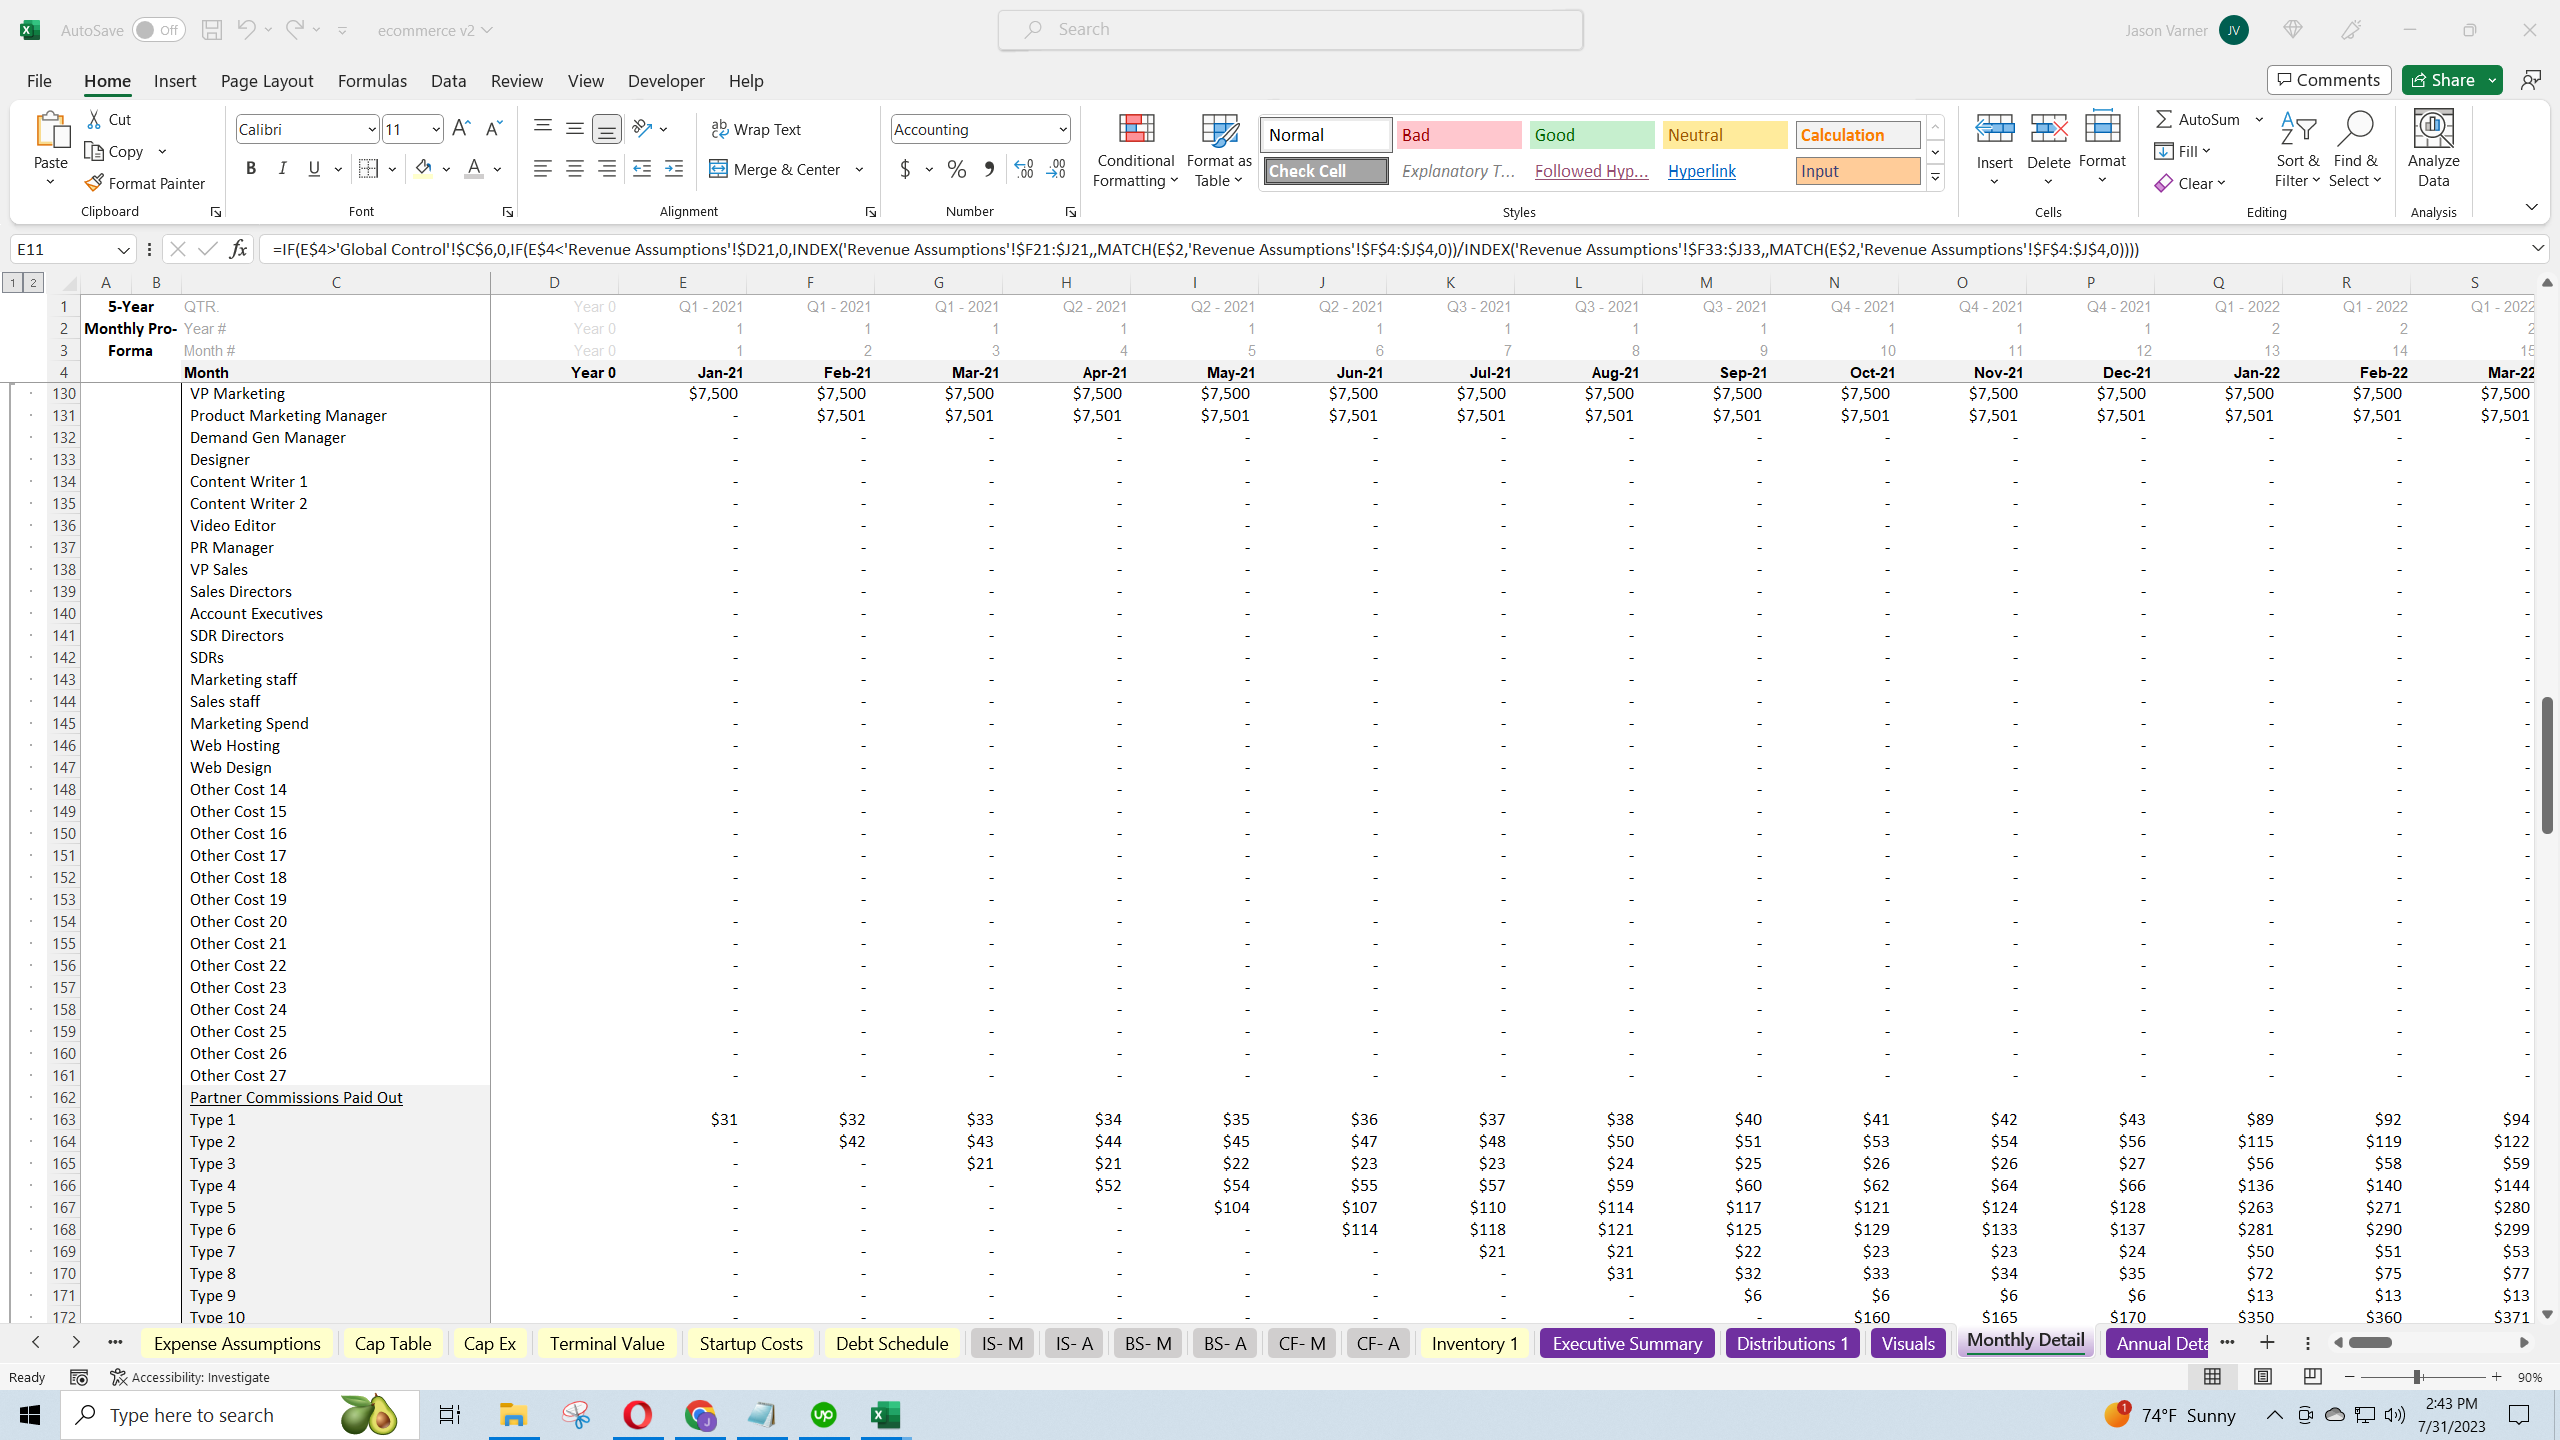
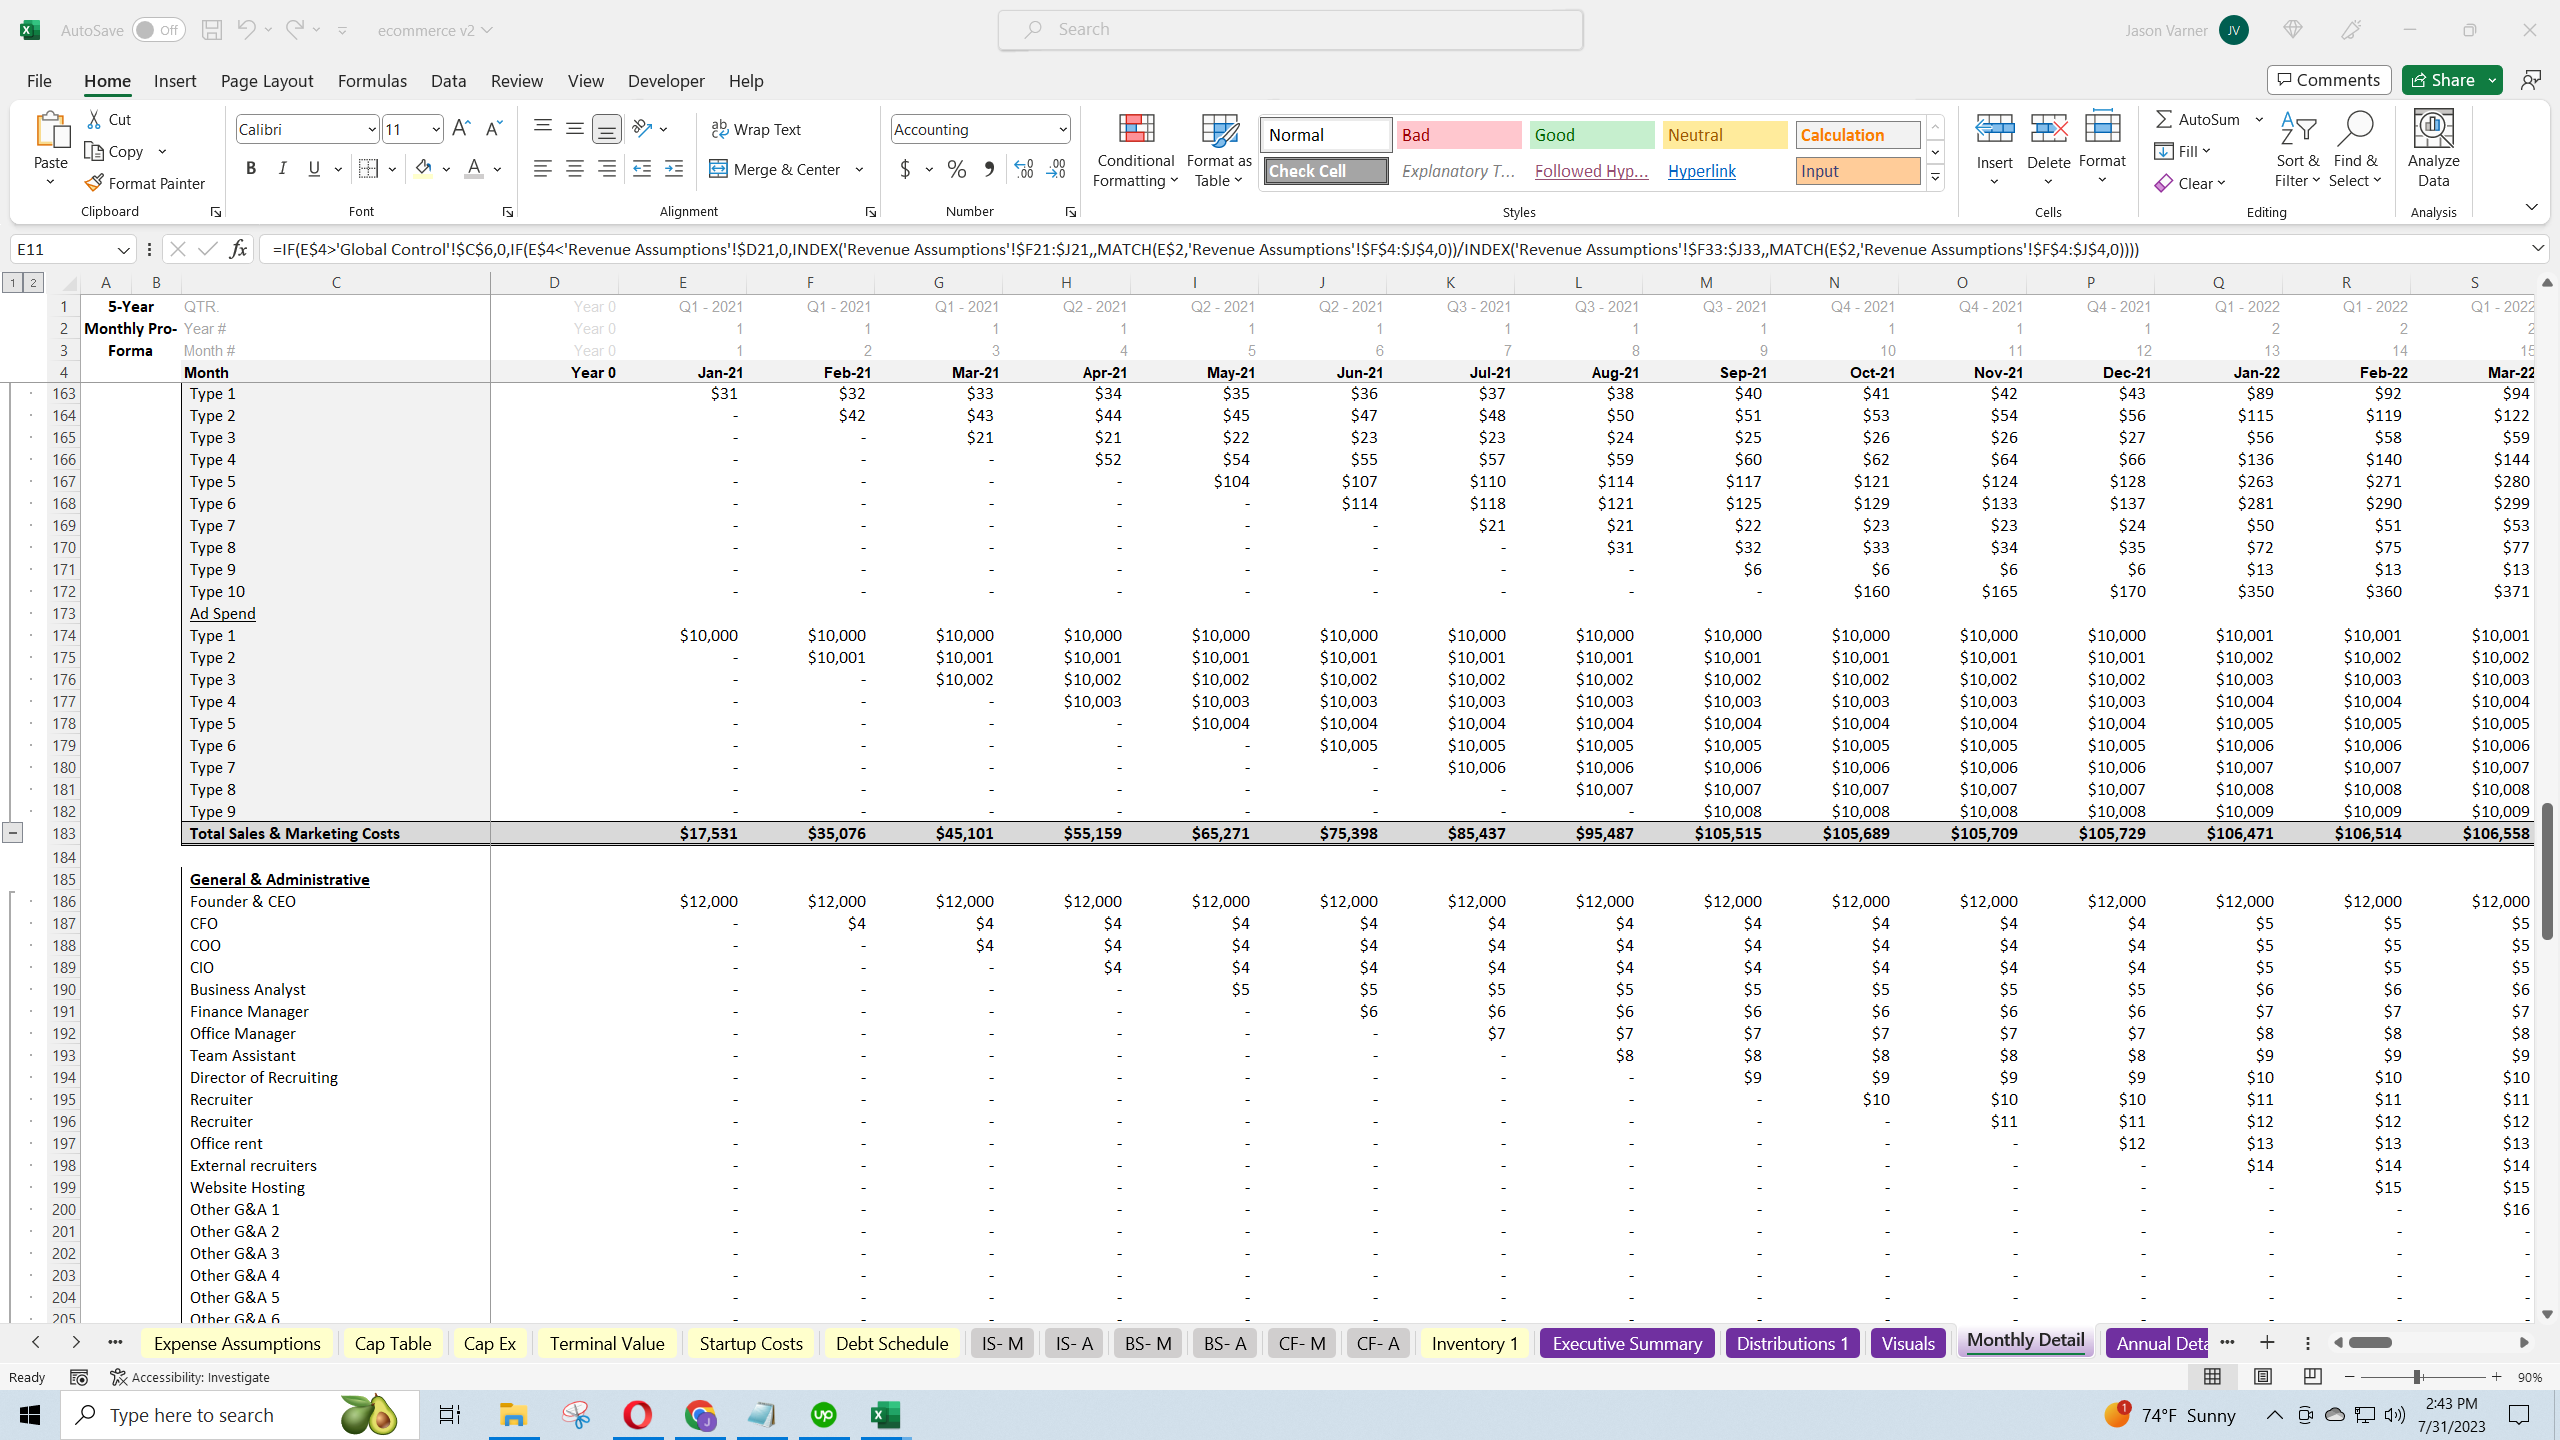
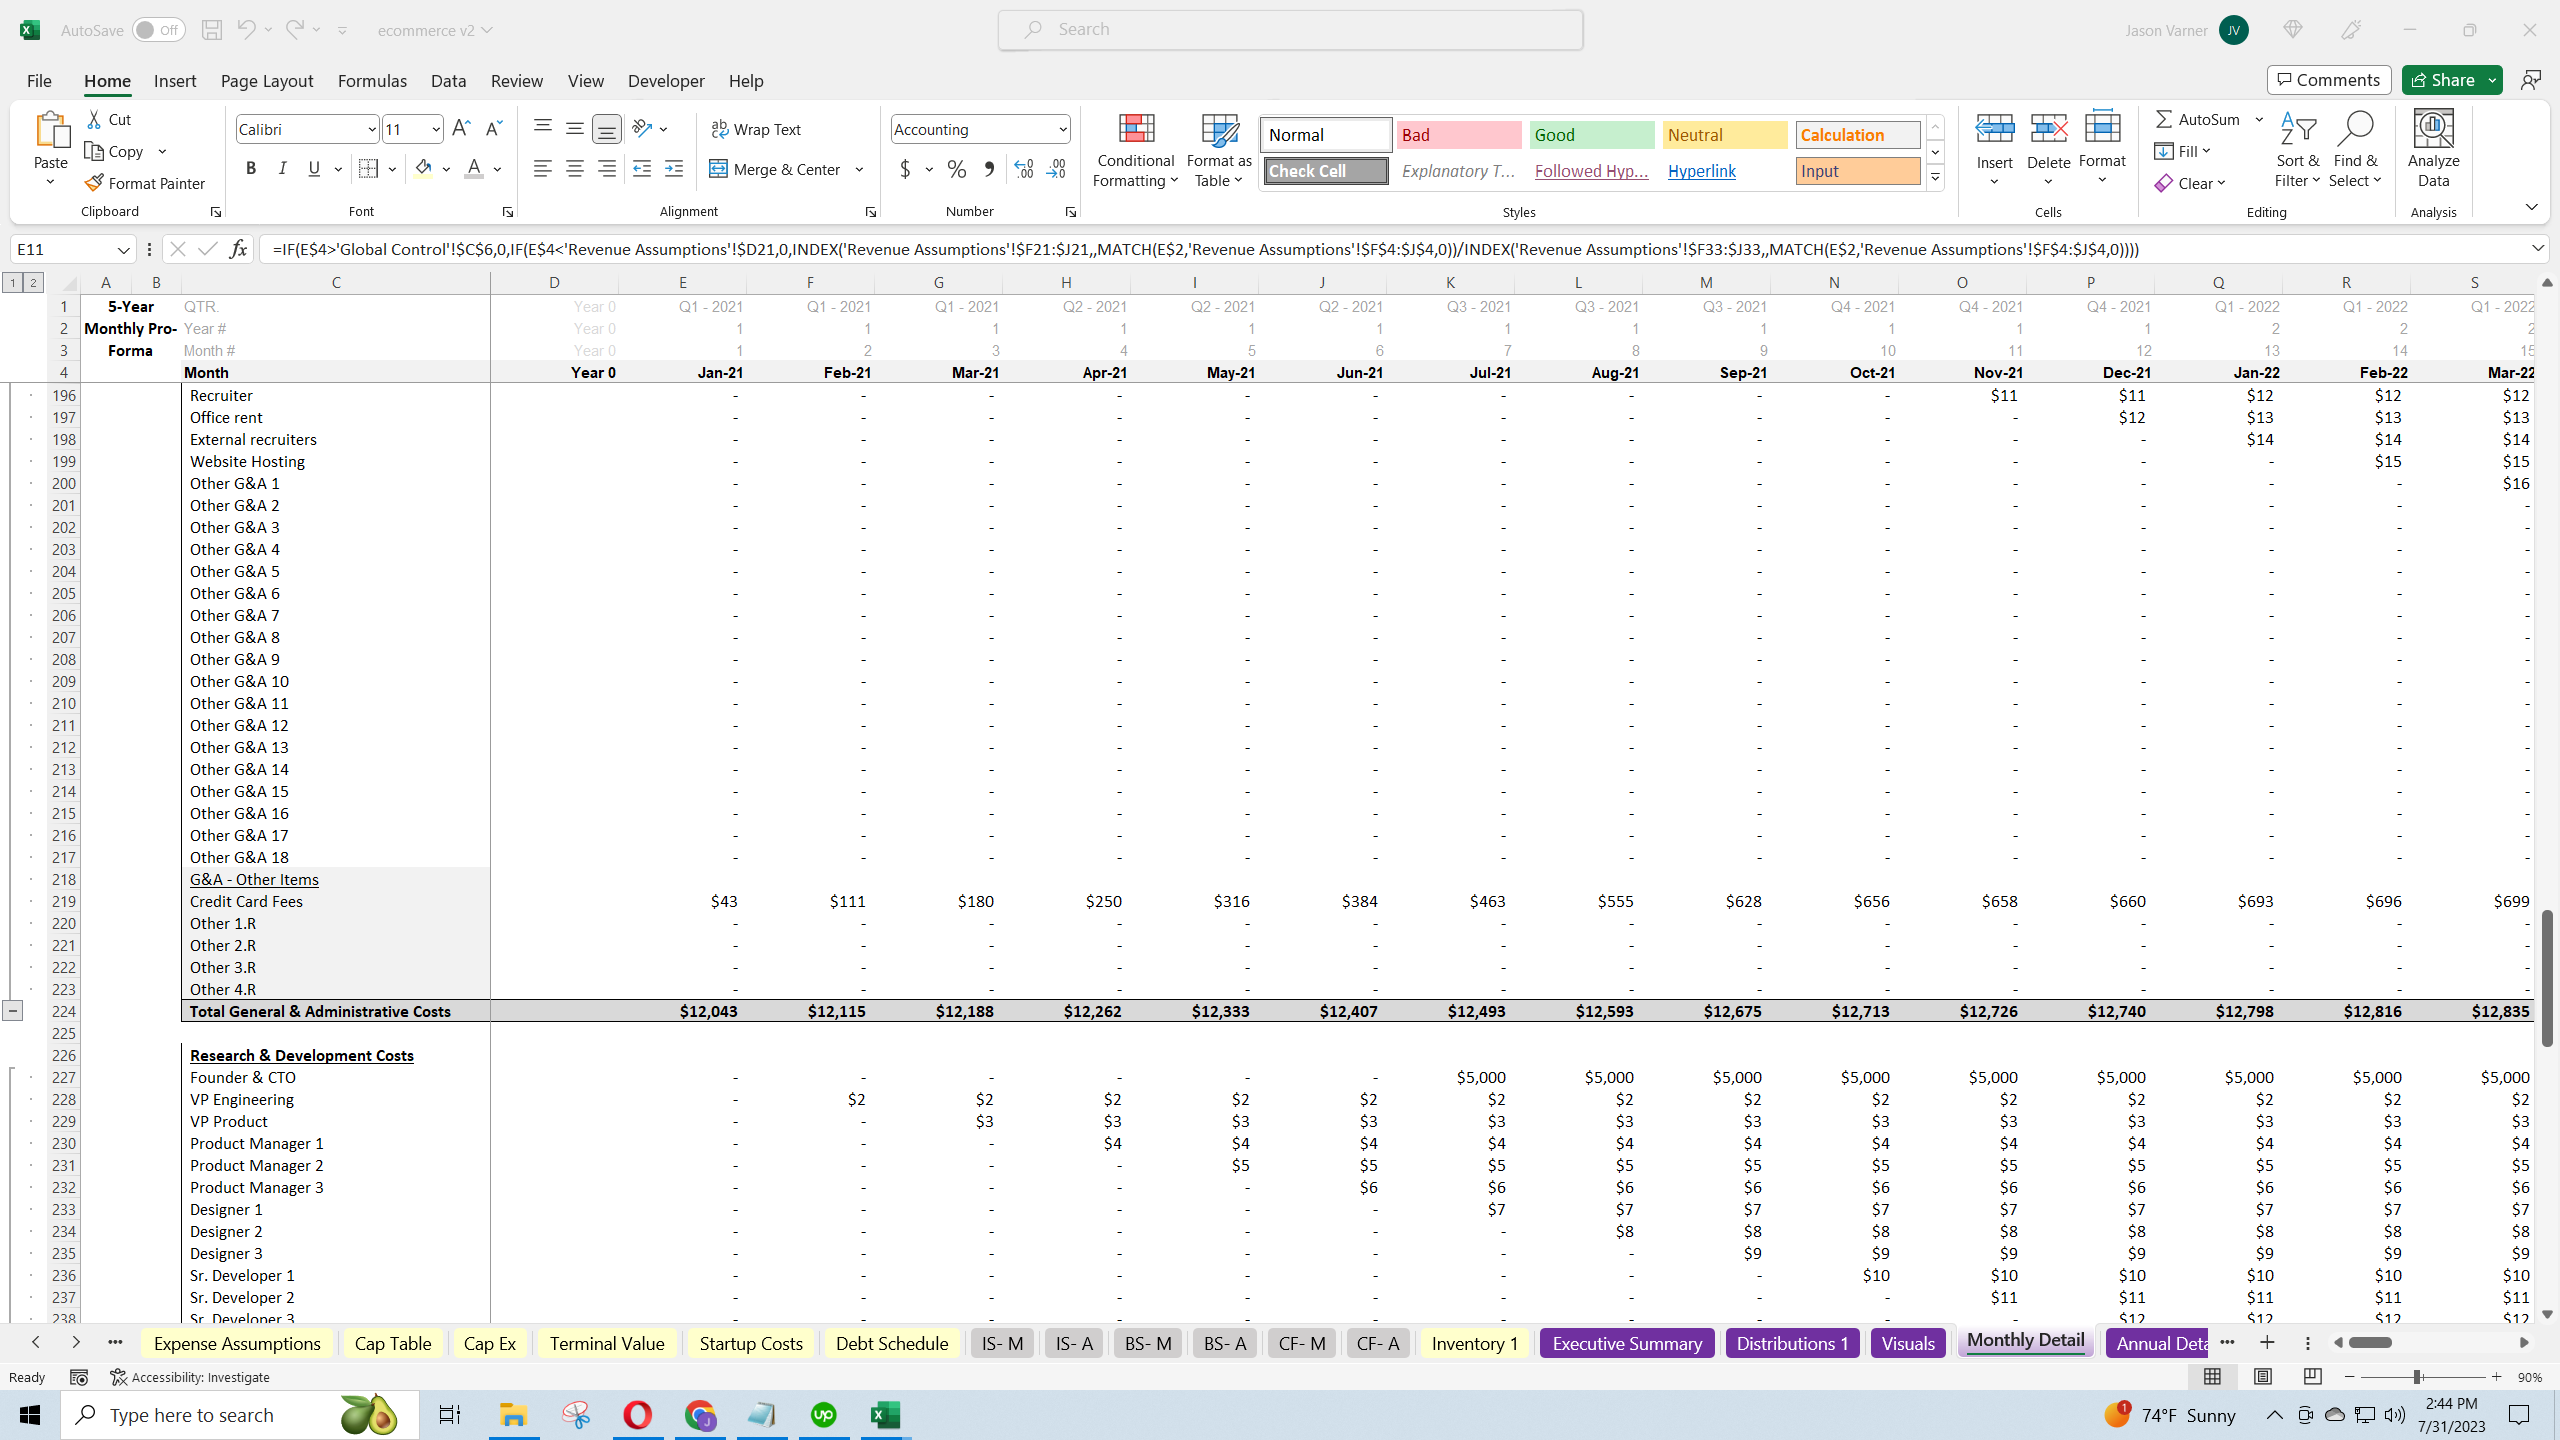
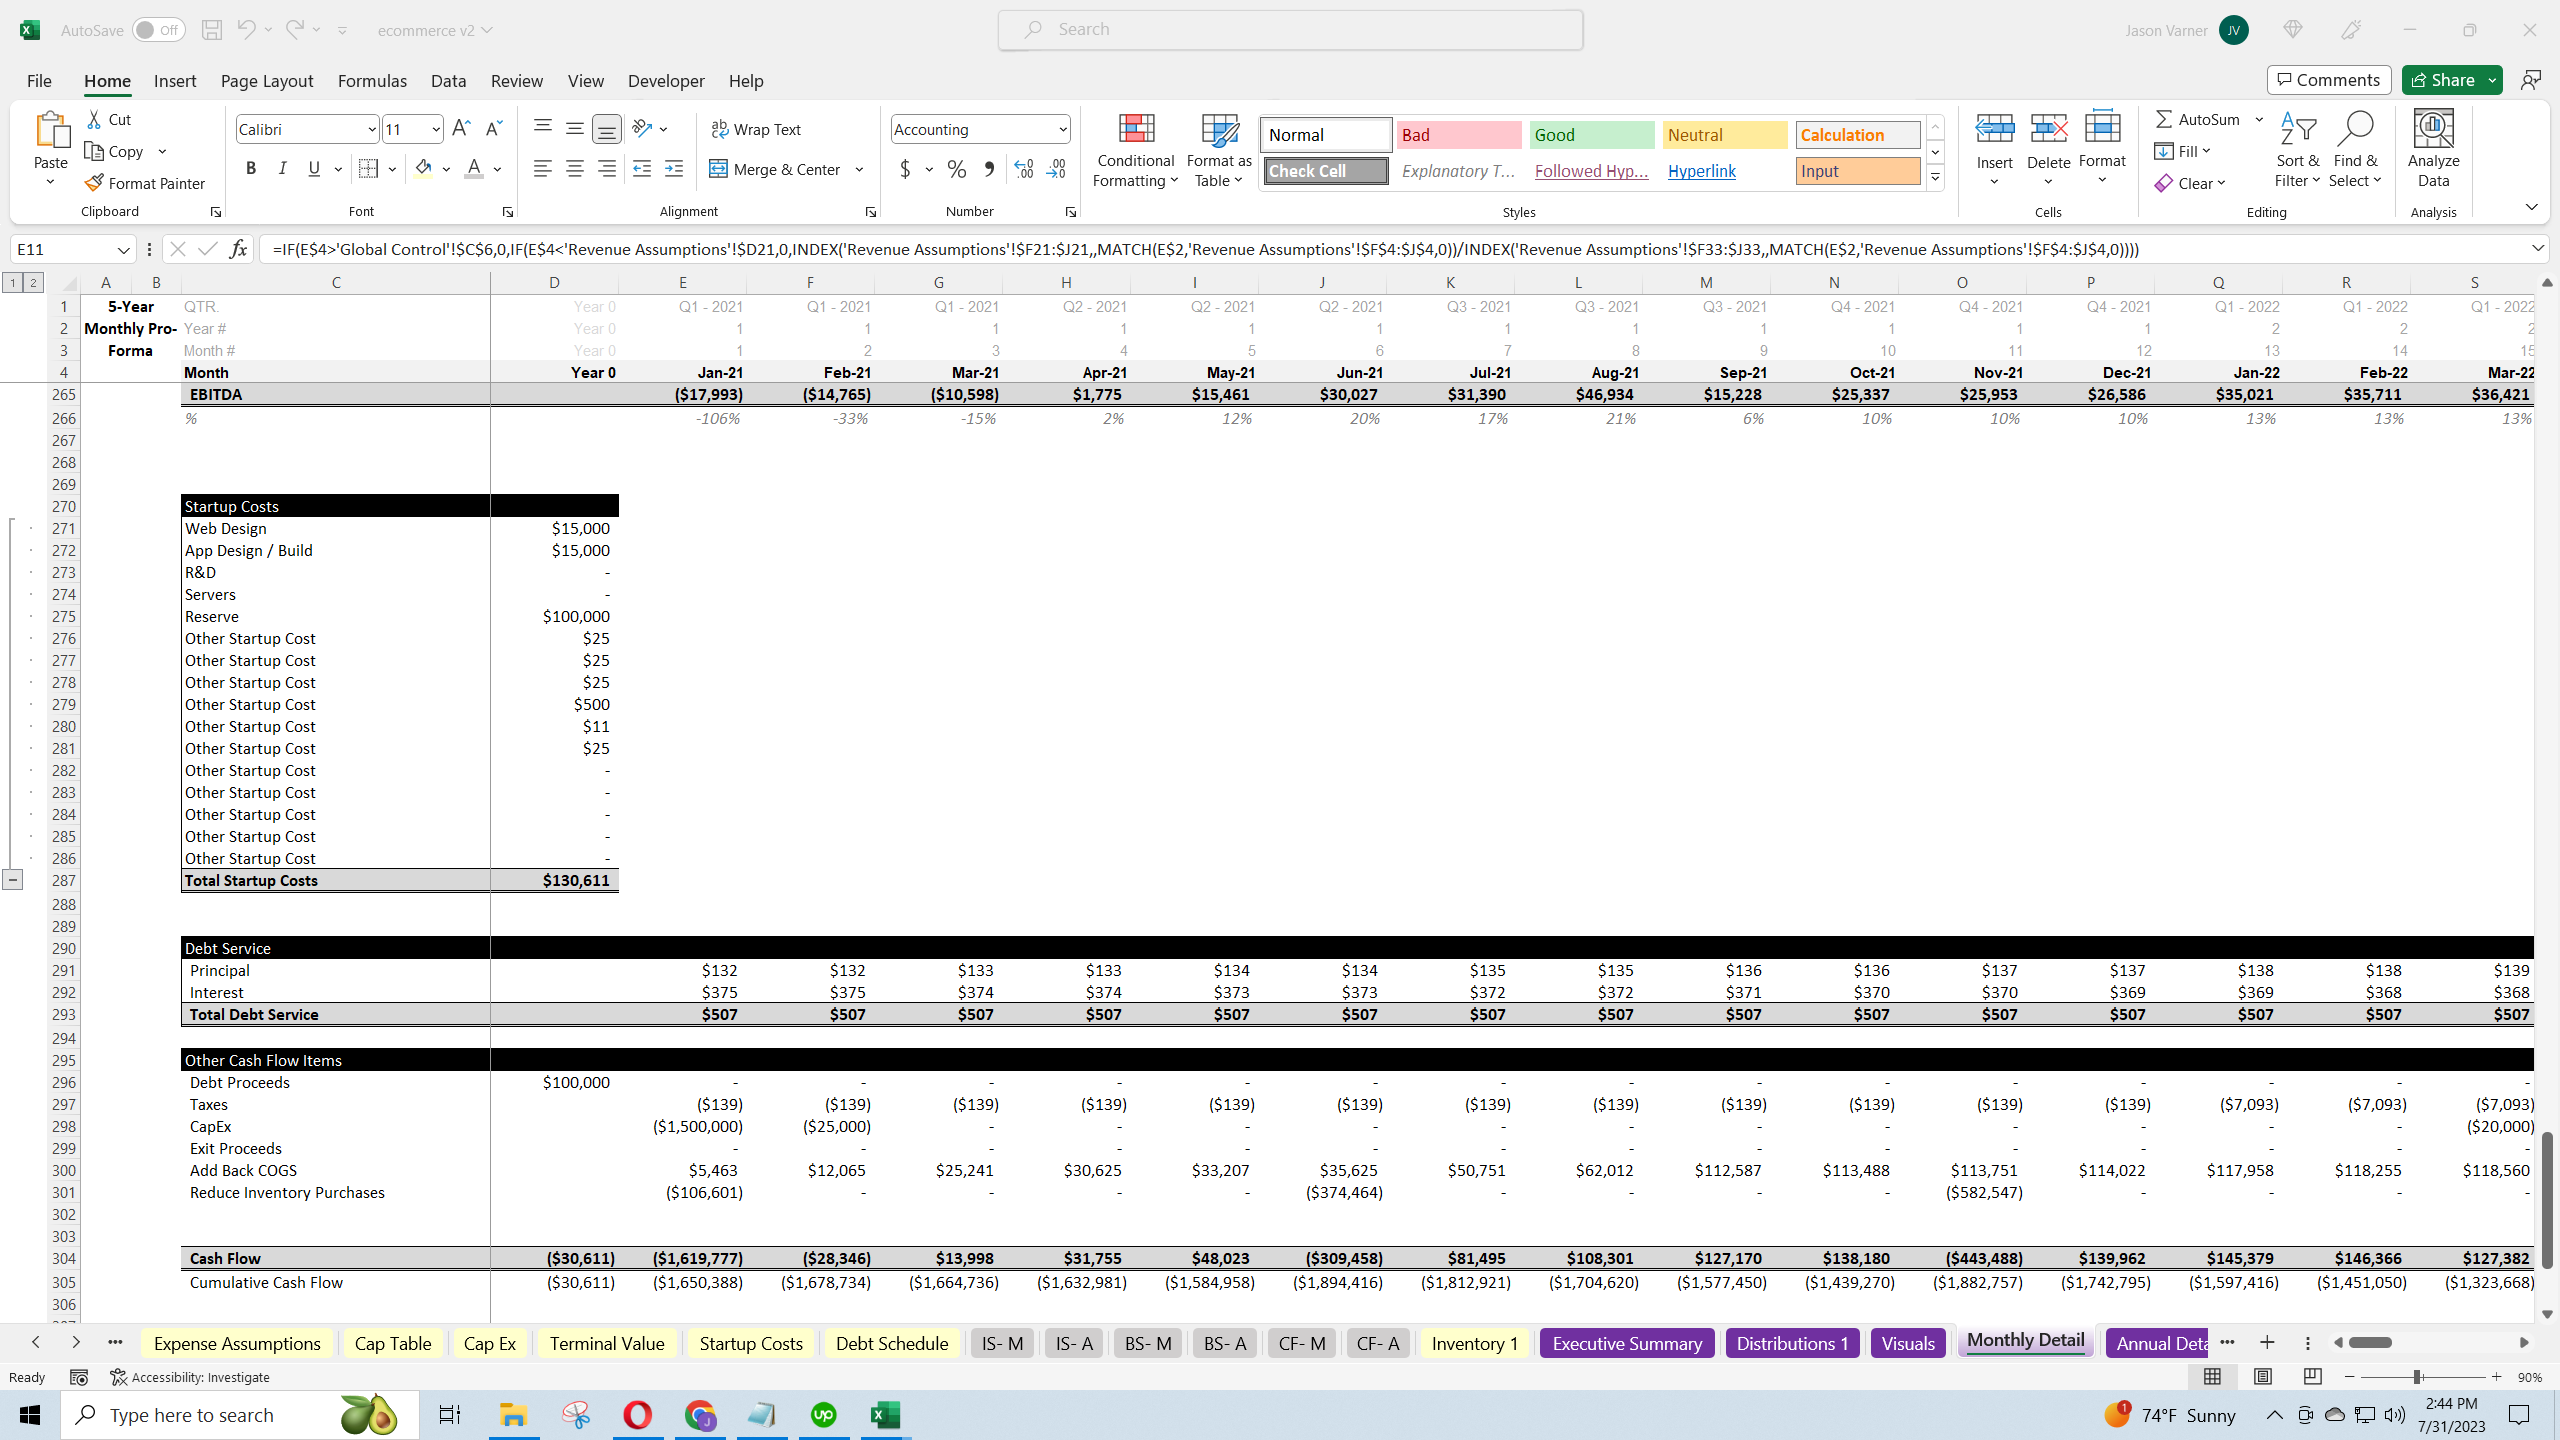
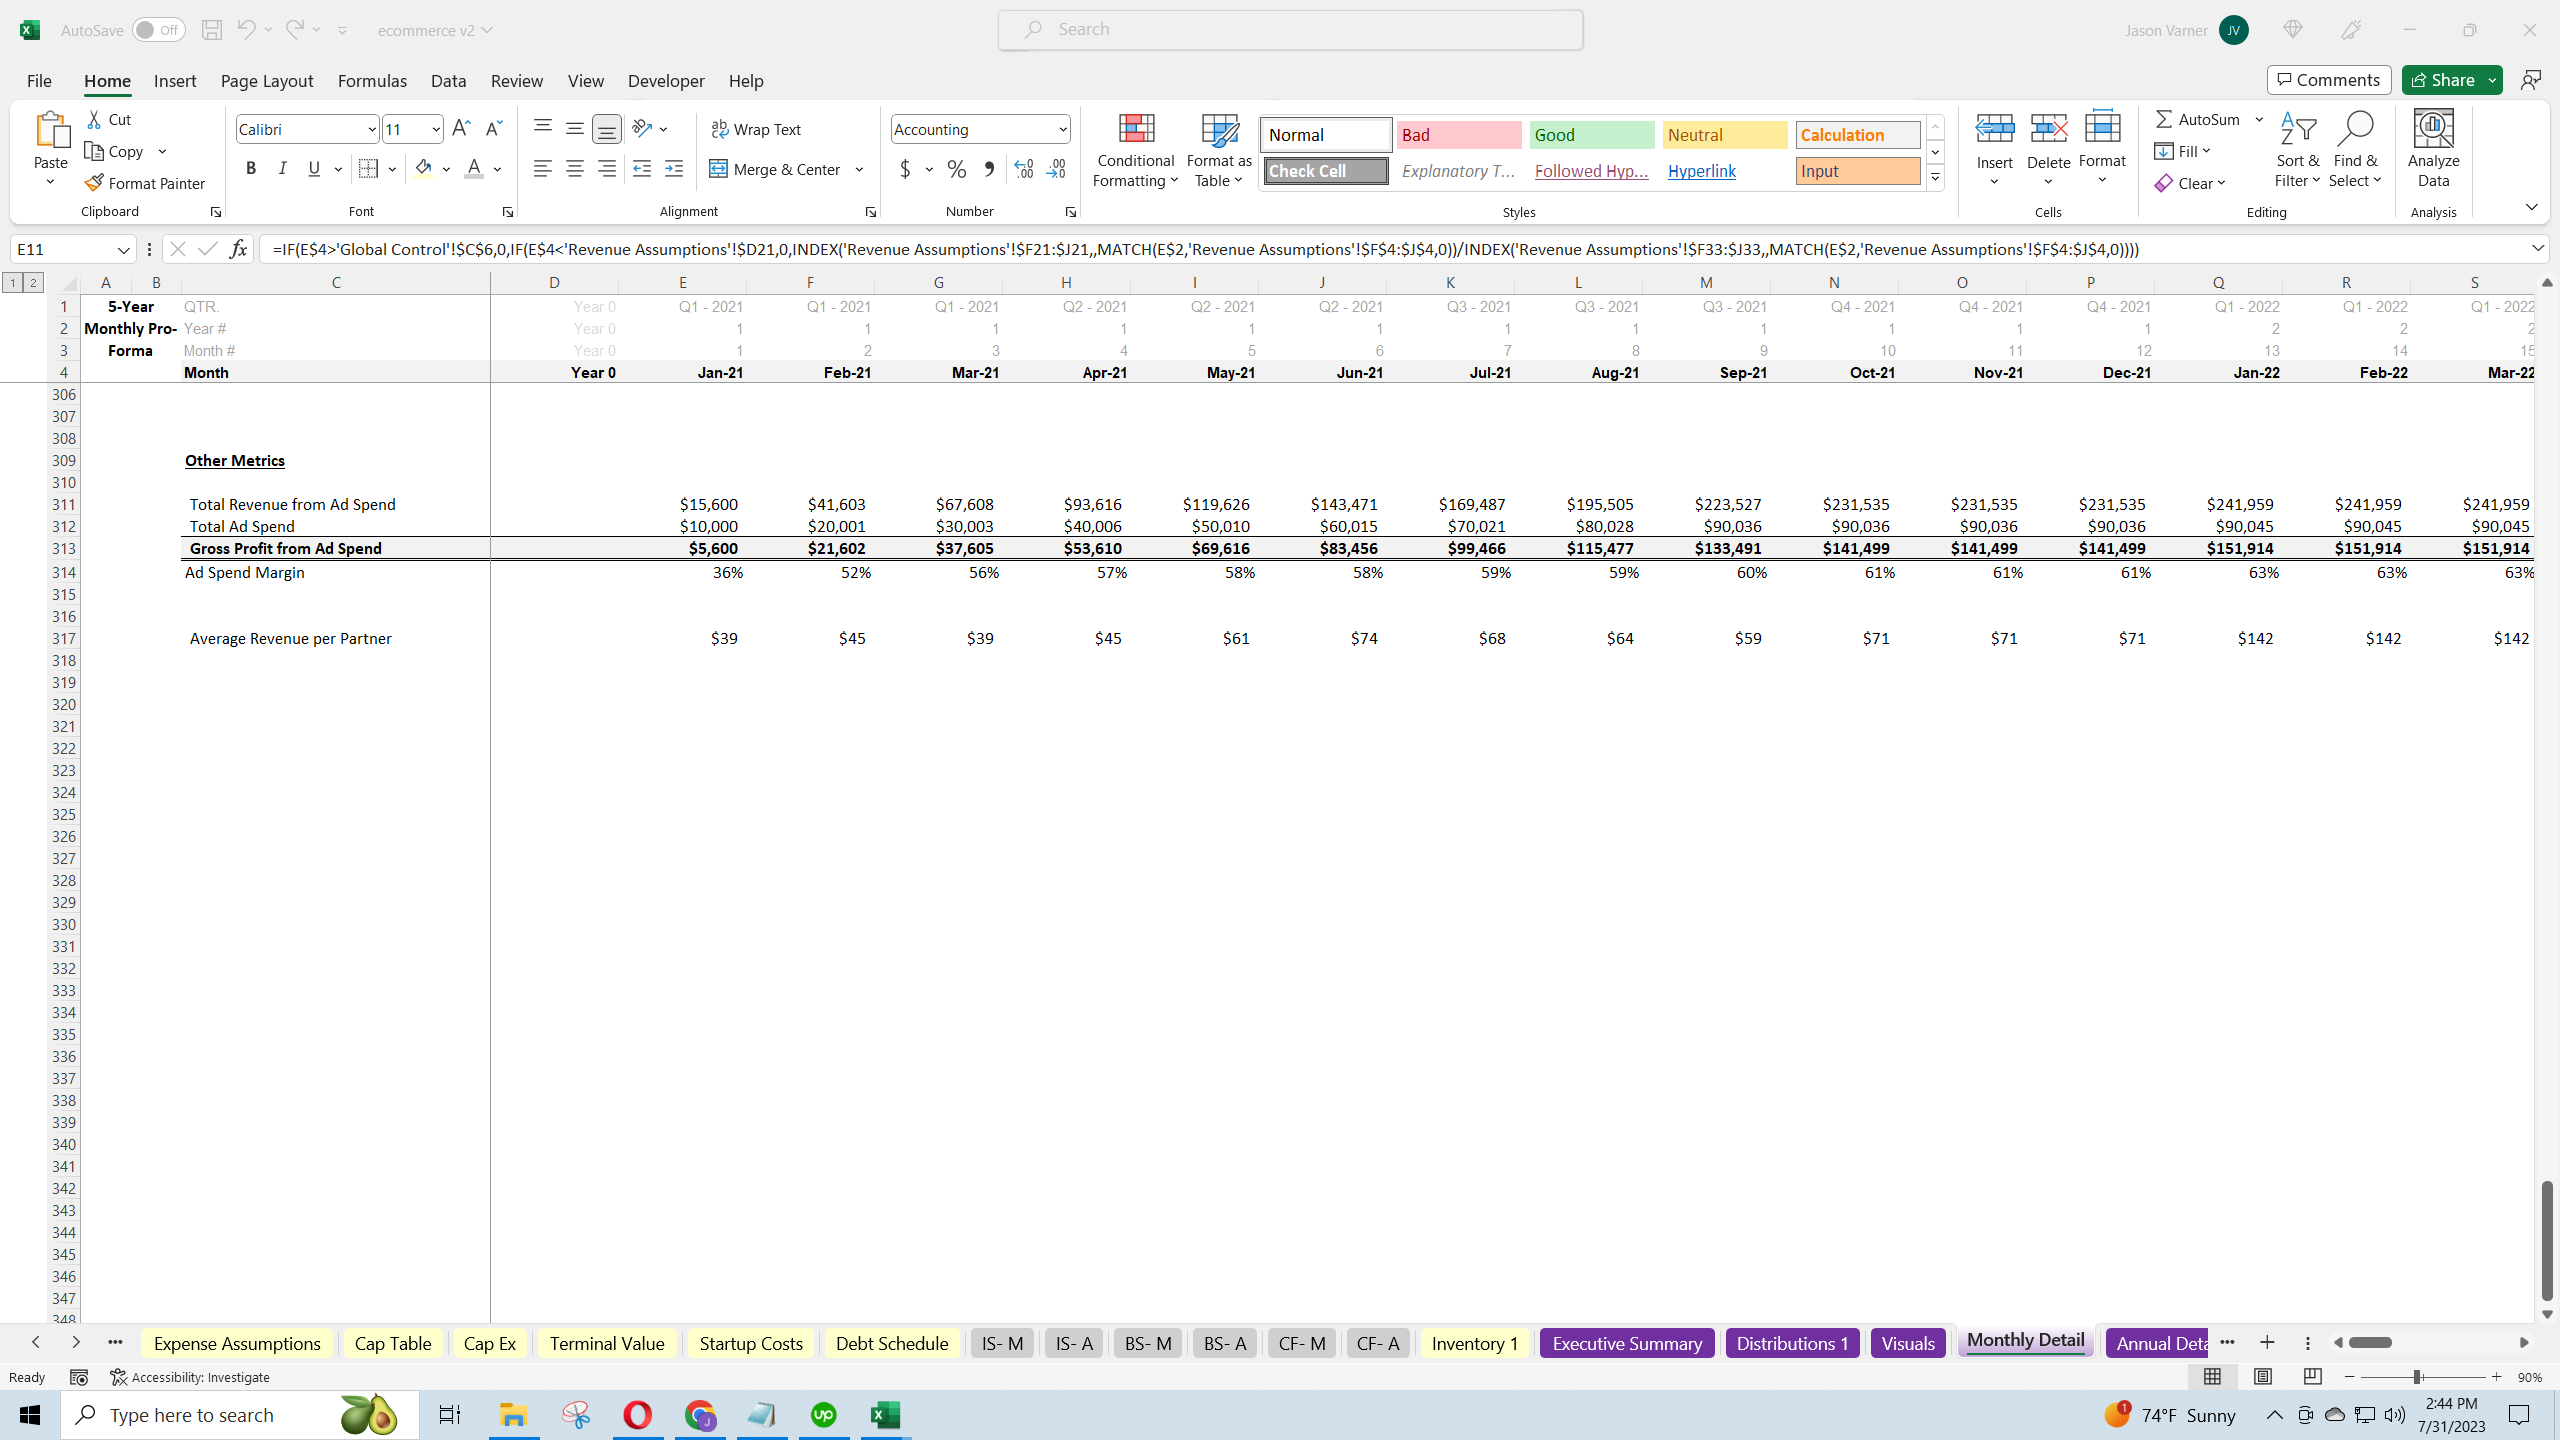
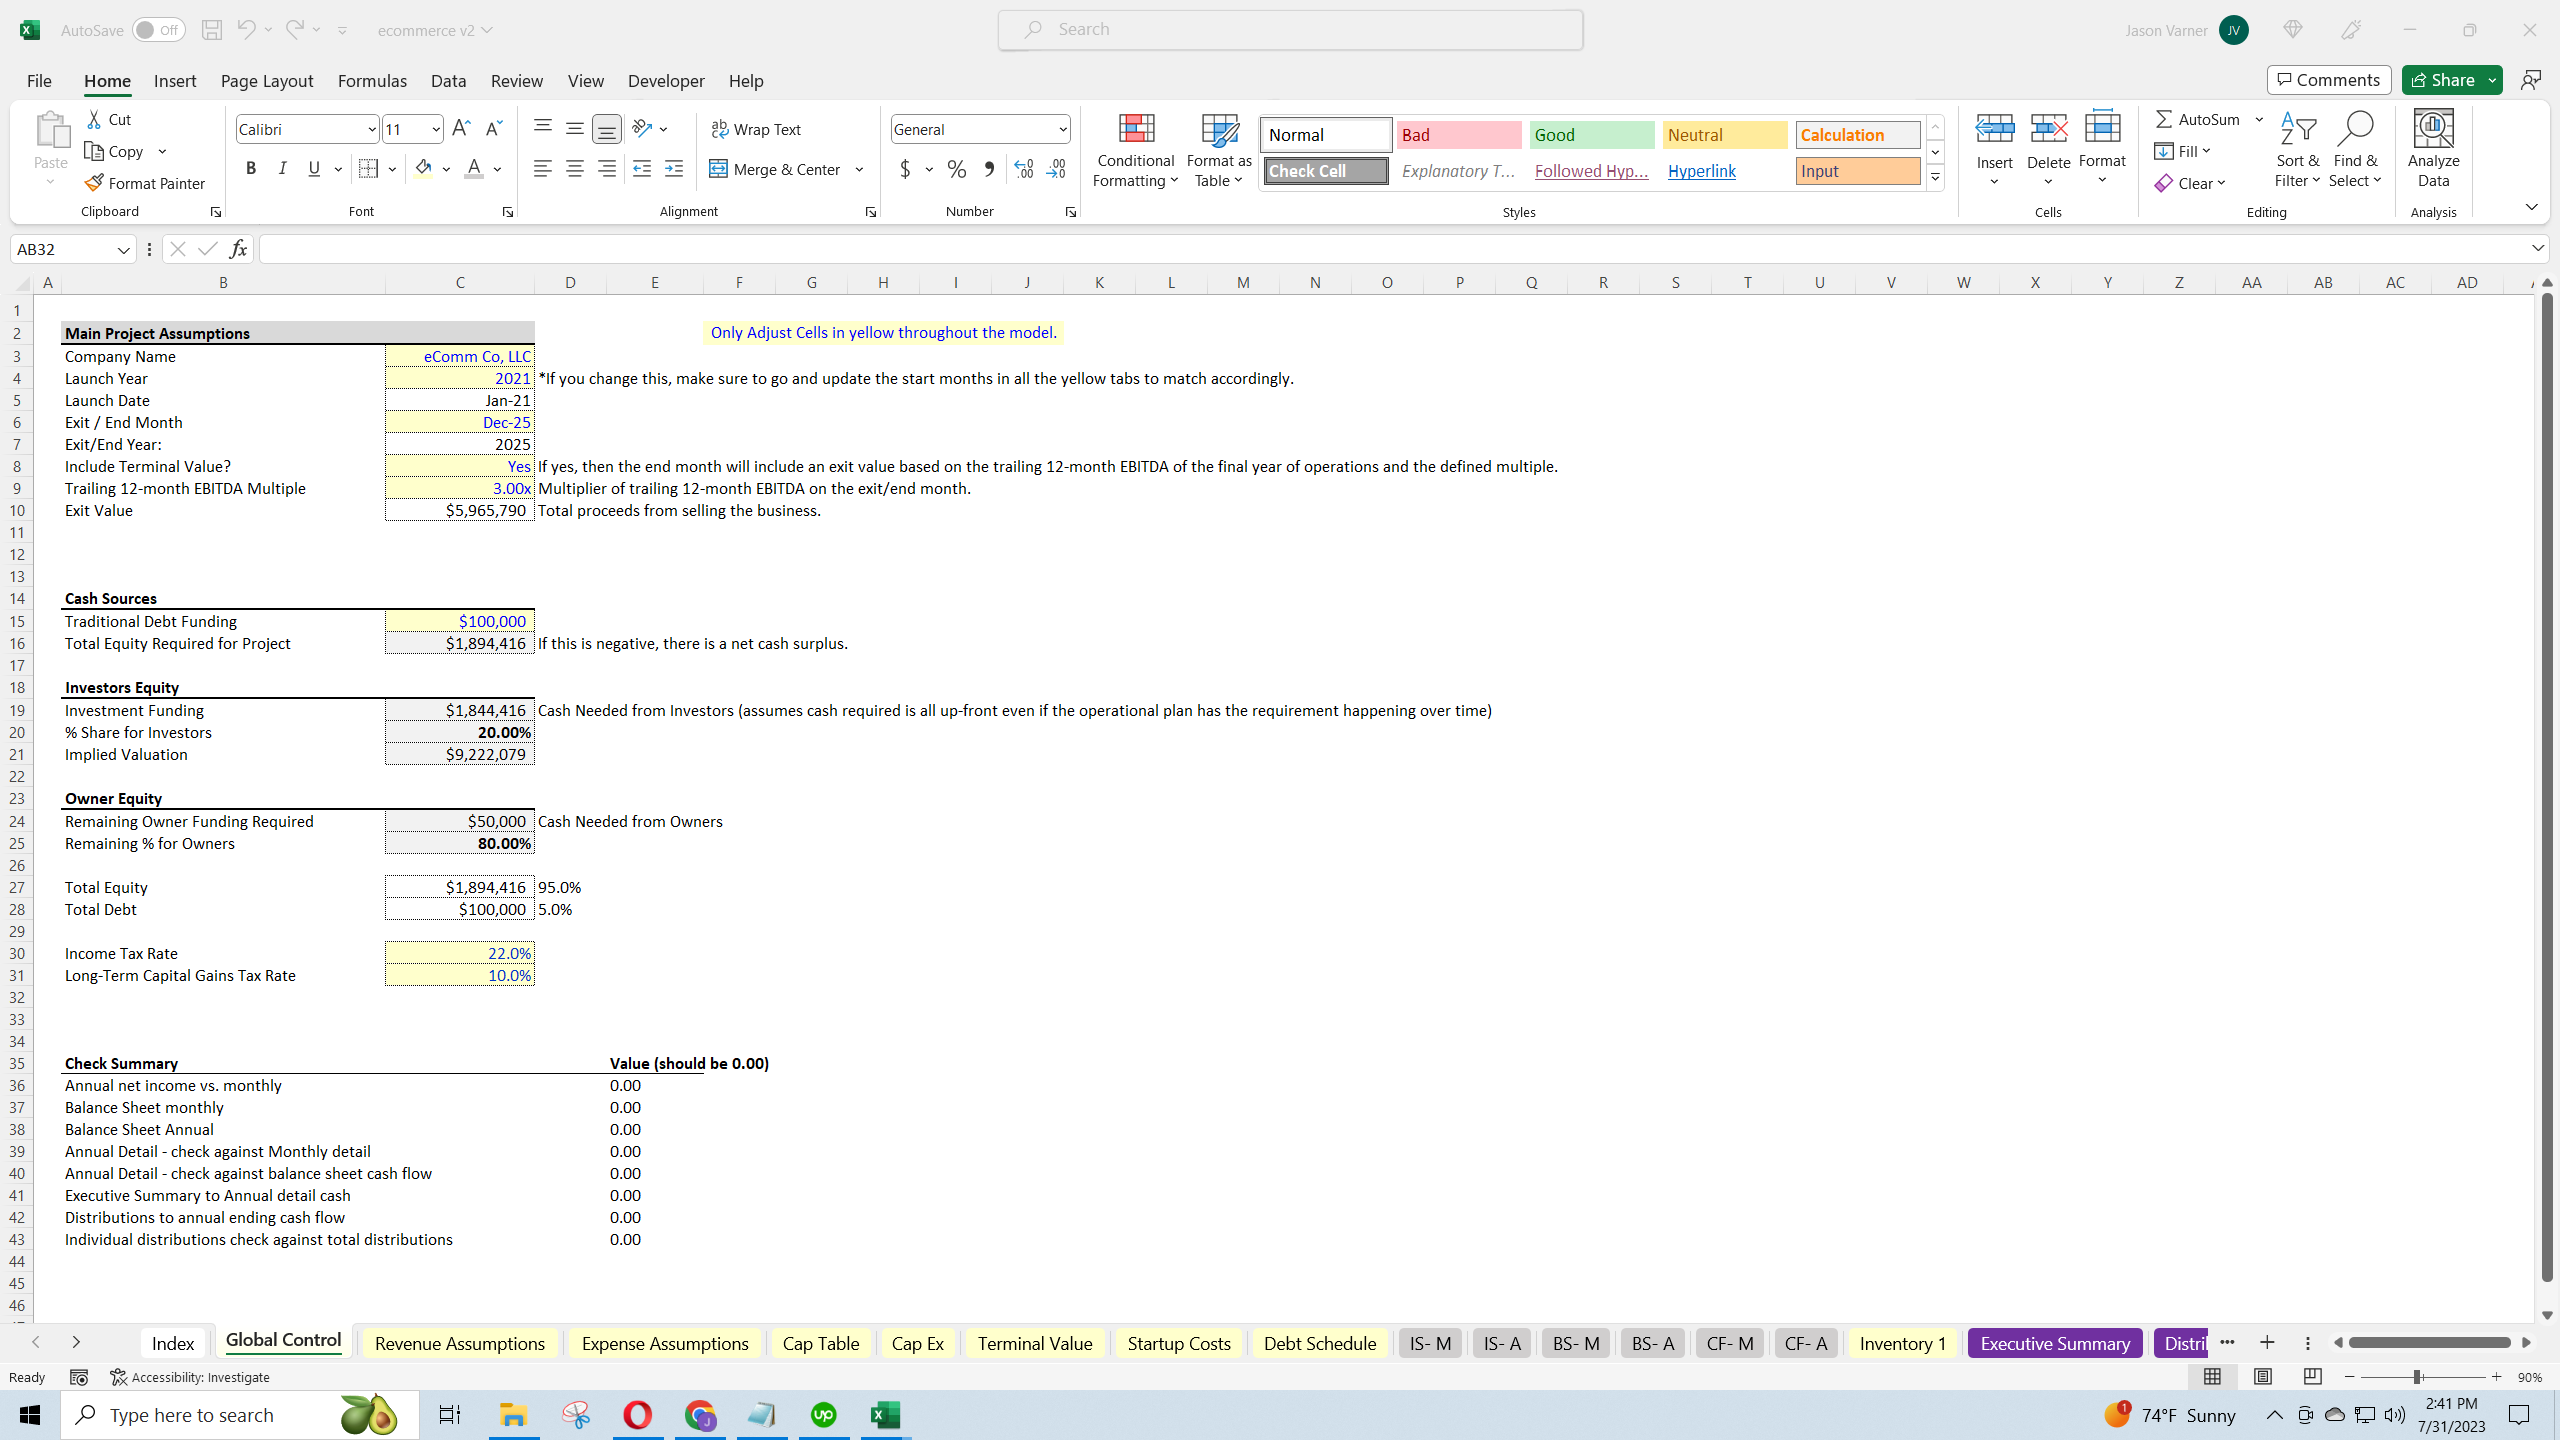
eCommerce 5-Year Financial Model: Ad Spend / Partnerships / Organic Sales Channels
A complete 5-year financial model for the eCommerce space. Includes three statement model and cap table.
Further information
Forecast eCommerce financial statements and DCF Analysis.
If your organization is selling digital products, drop shipping, and/or manufactured products online.
If you don't sell online.
