
Originally published: 04/08/2019 13:09
Last version published: 22/12/2023 09:12
Publication number: ELQ-95824-6
View all versions & Certificate
Last version published: 22/12/2023 09:12
Publication number: ELQ-95824-6
View all versions & Certificate

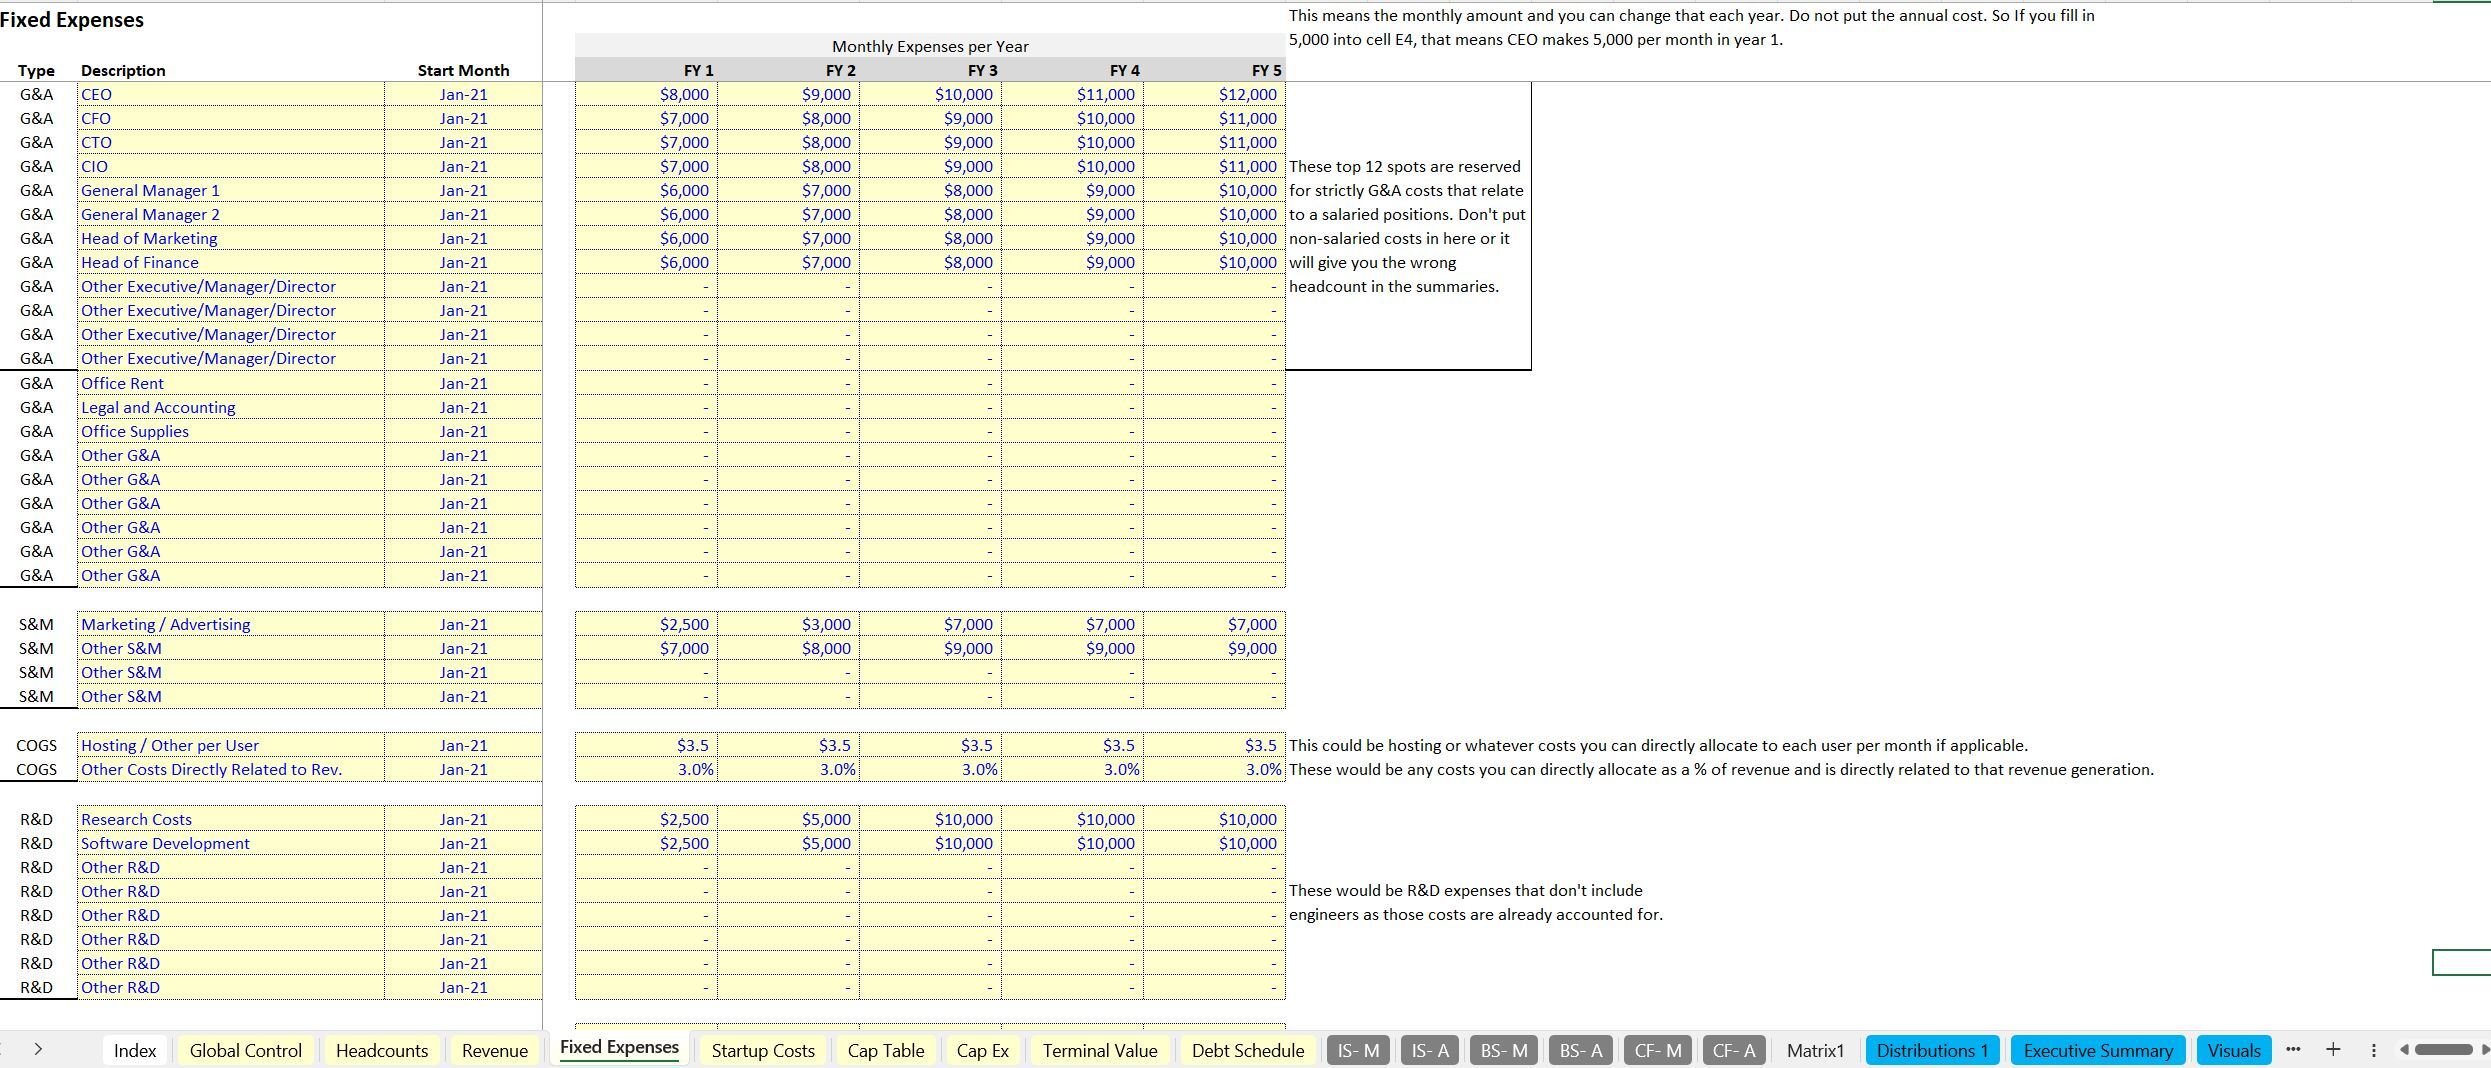
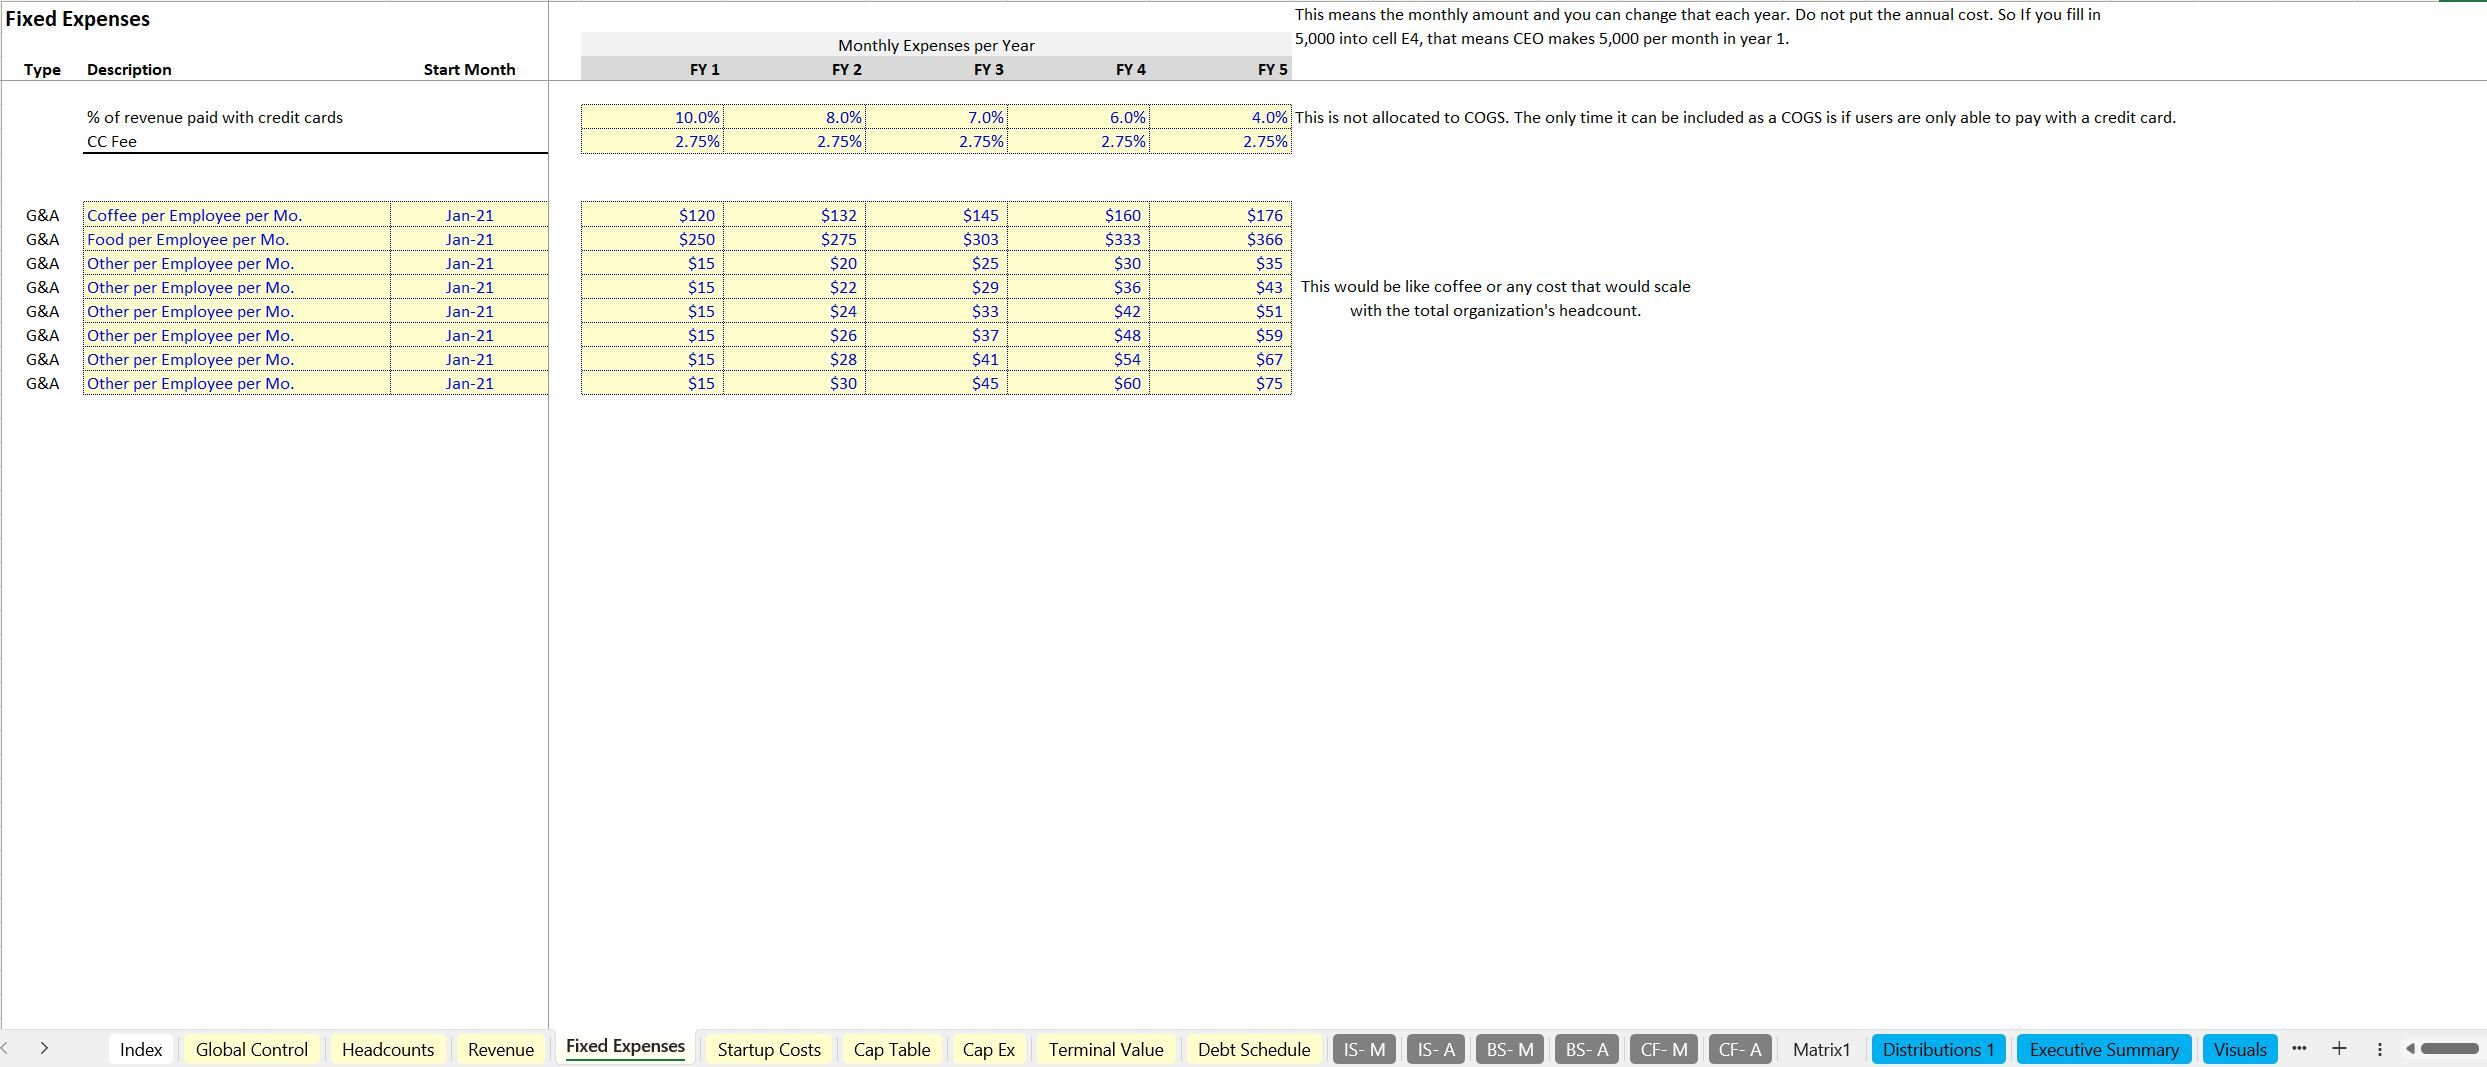
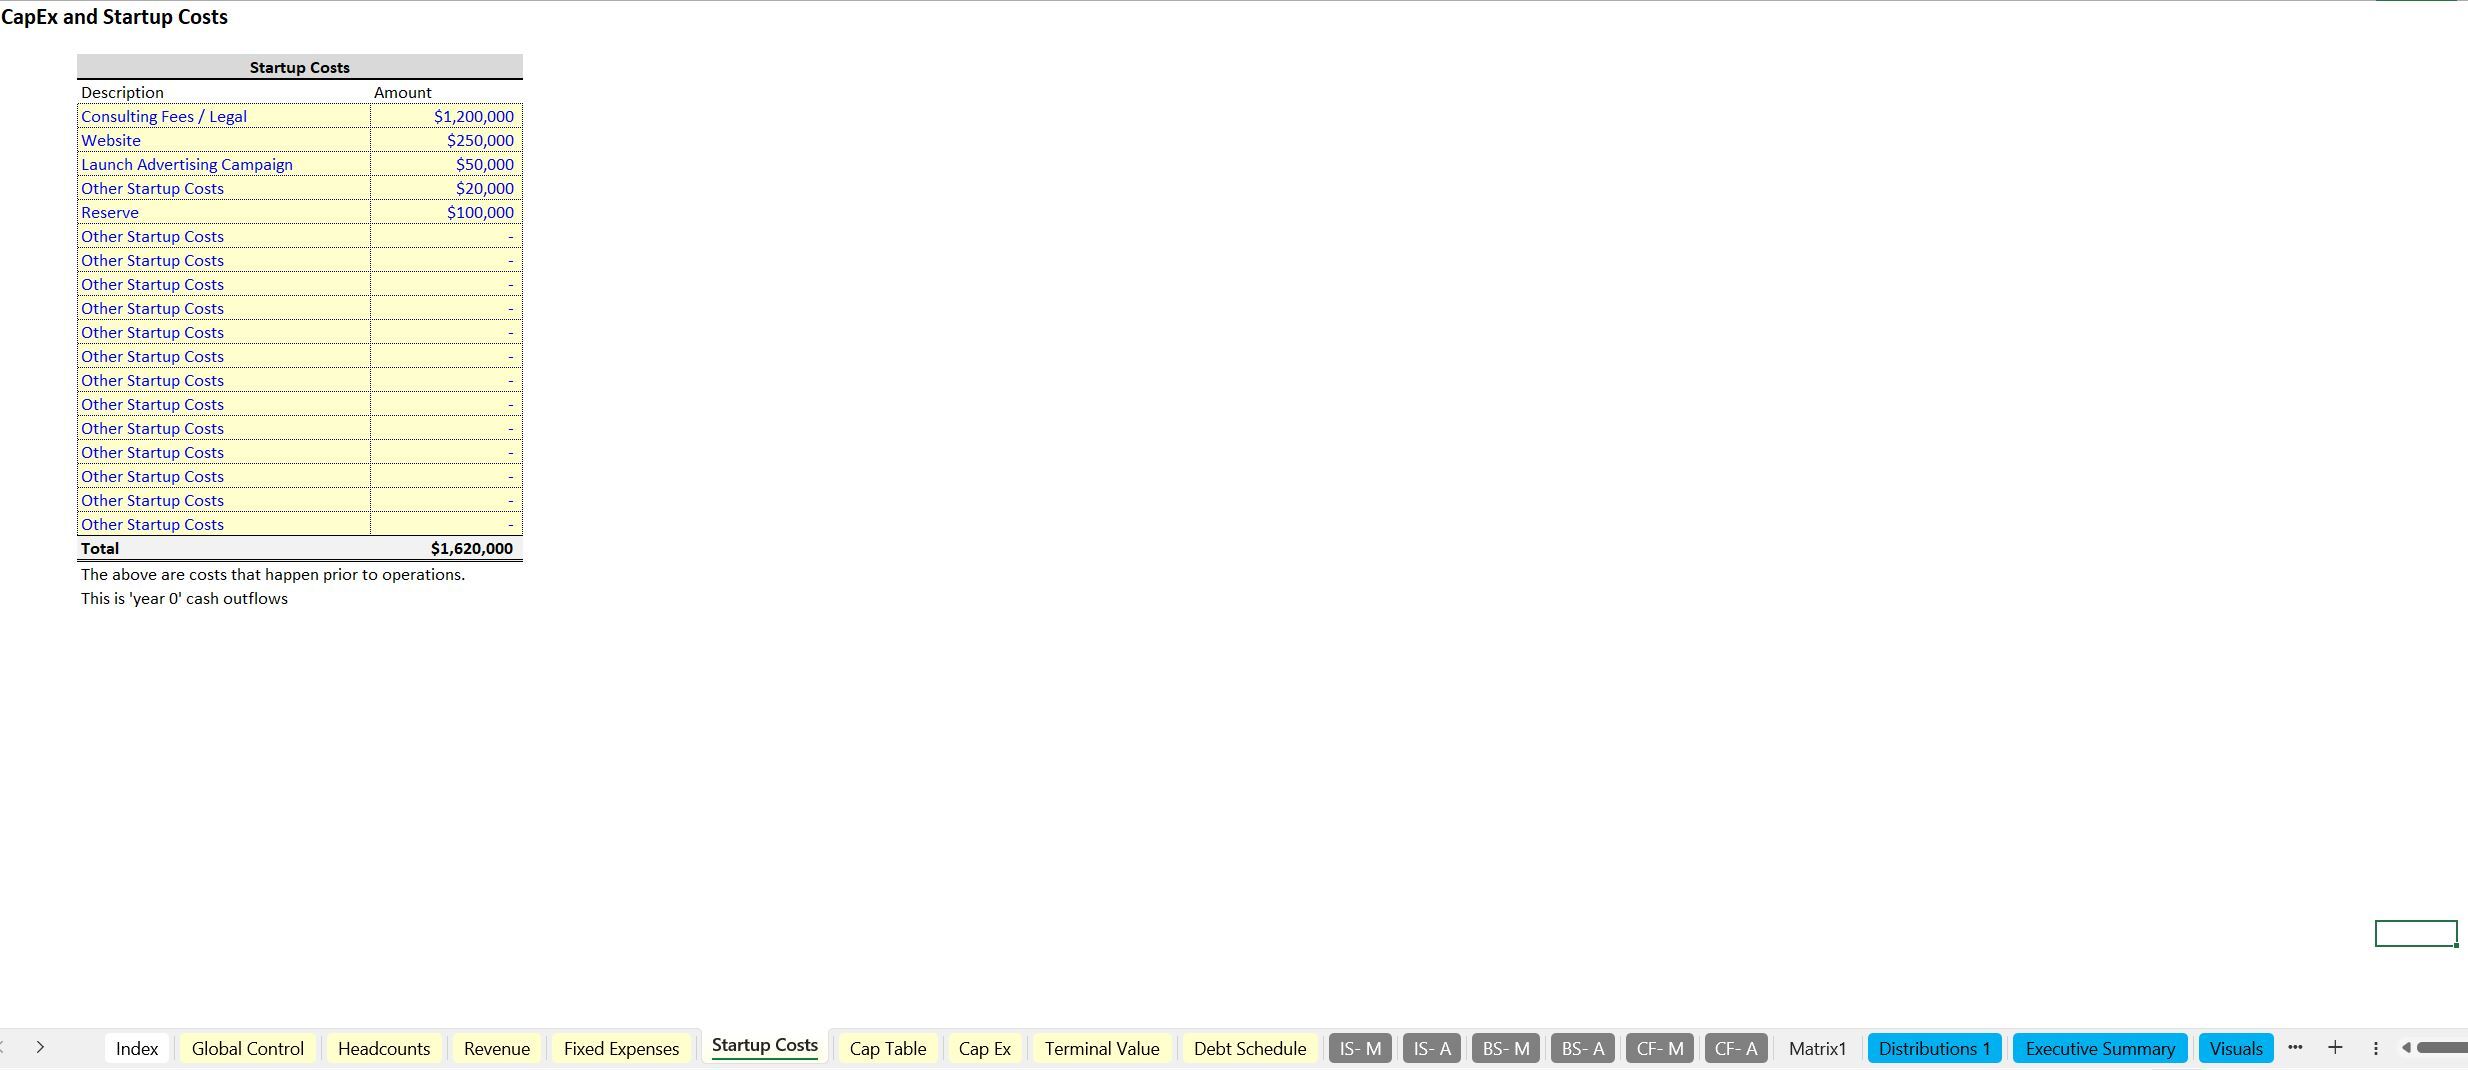
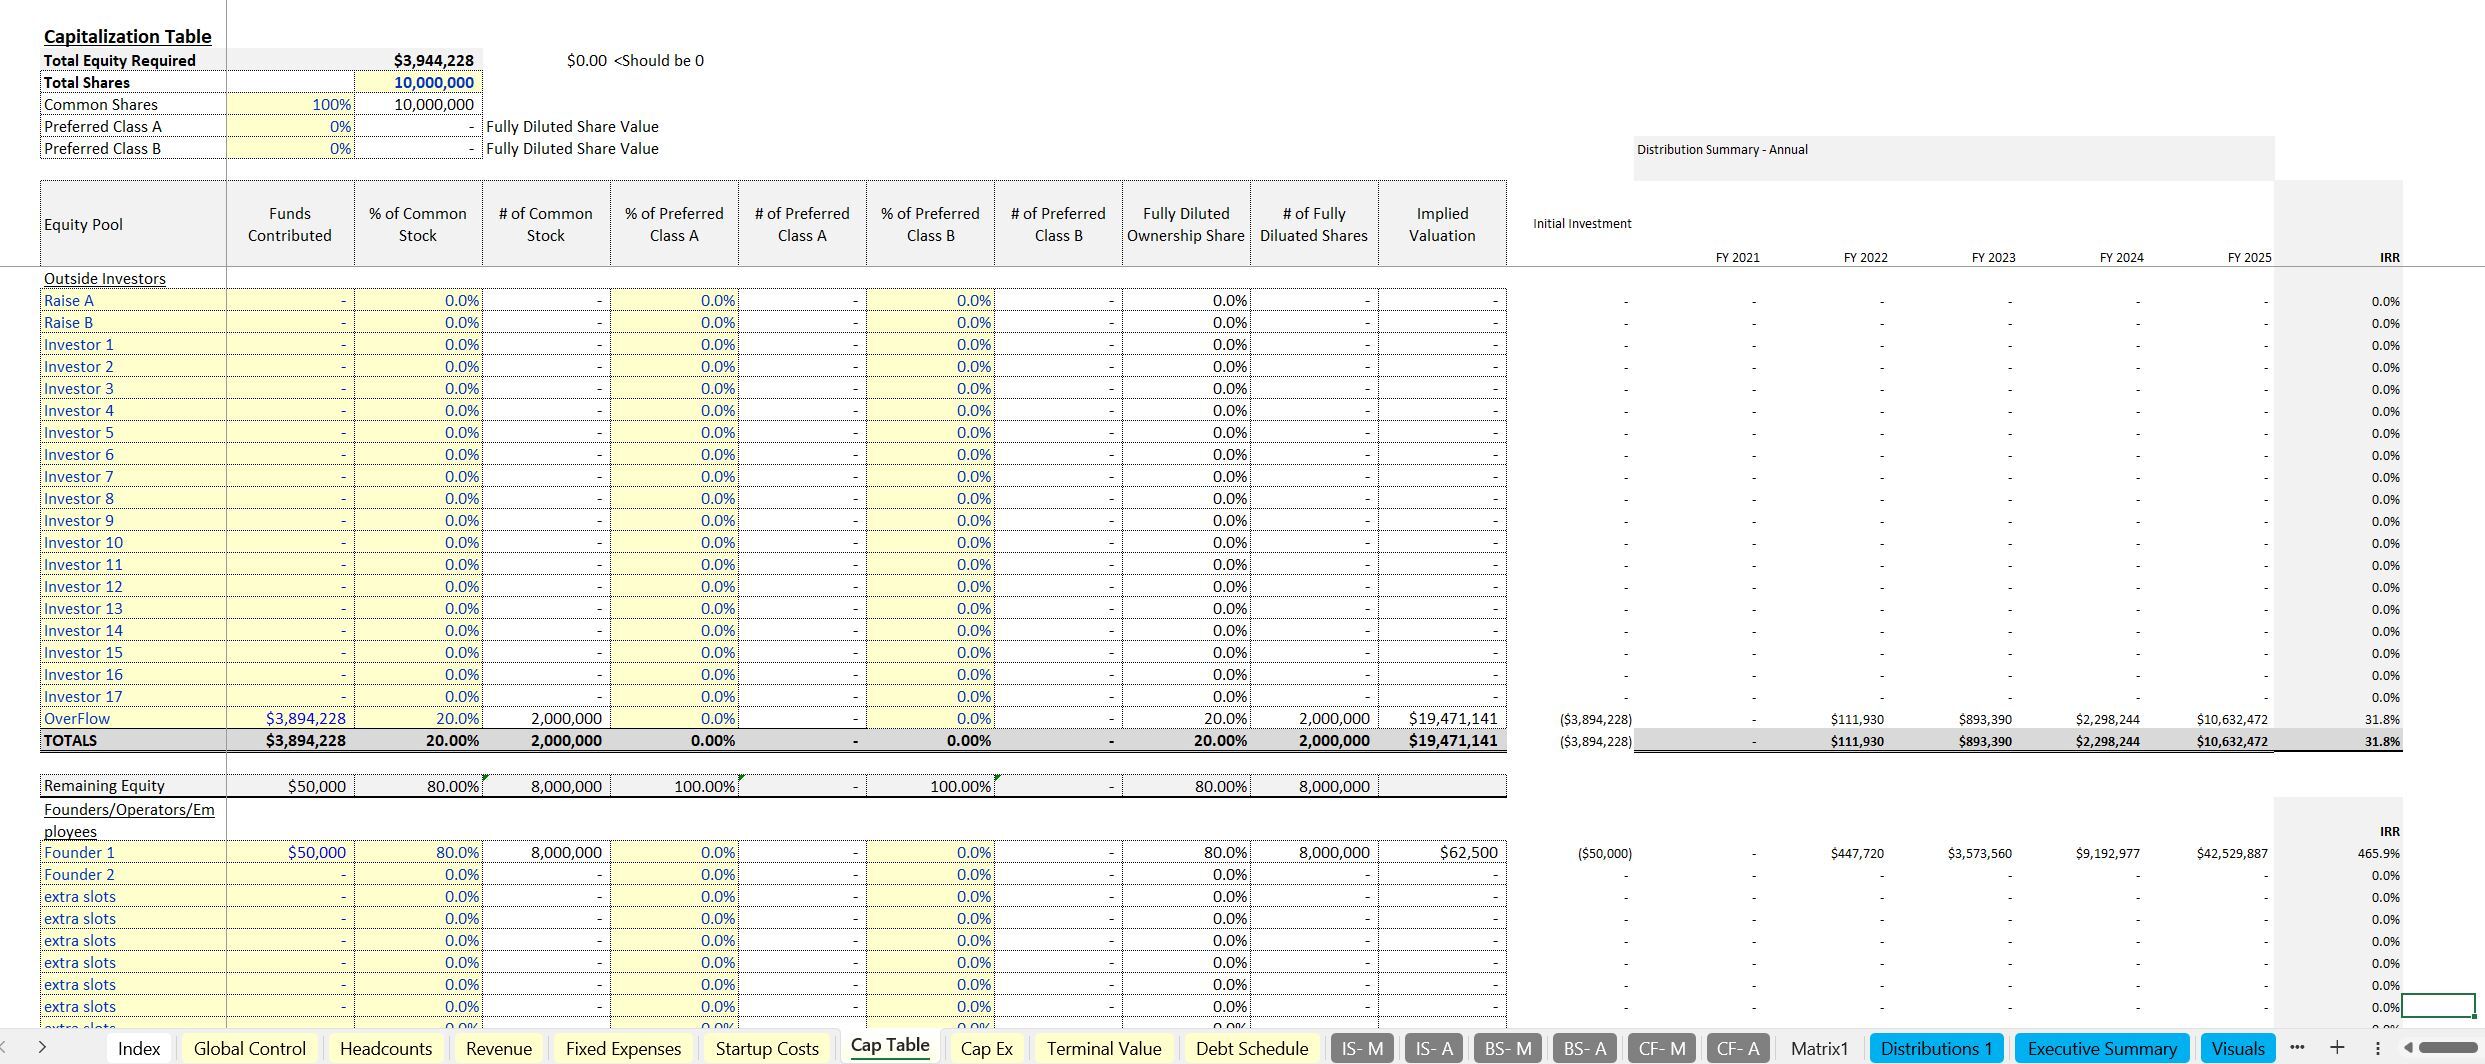
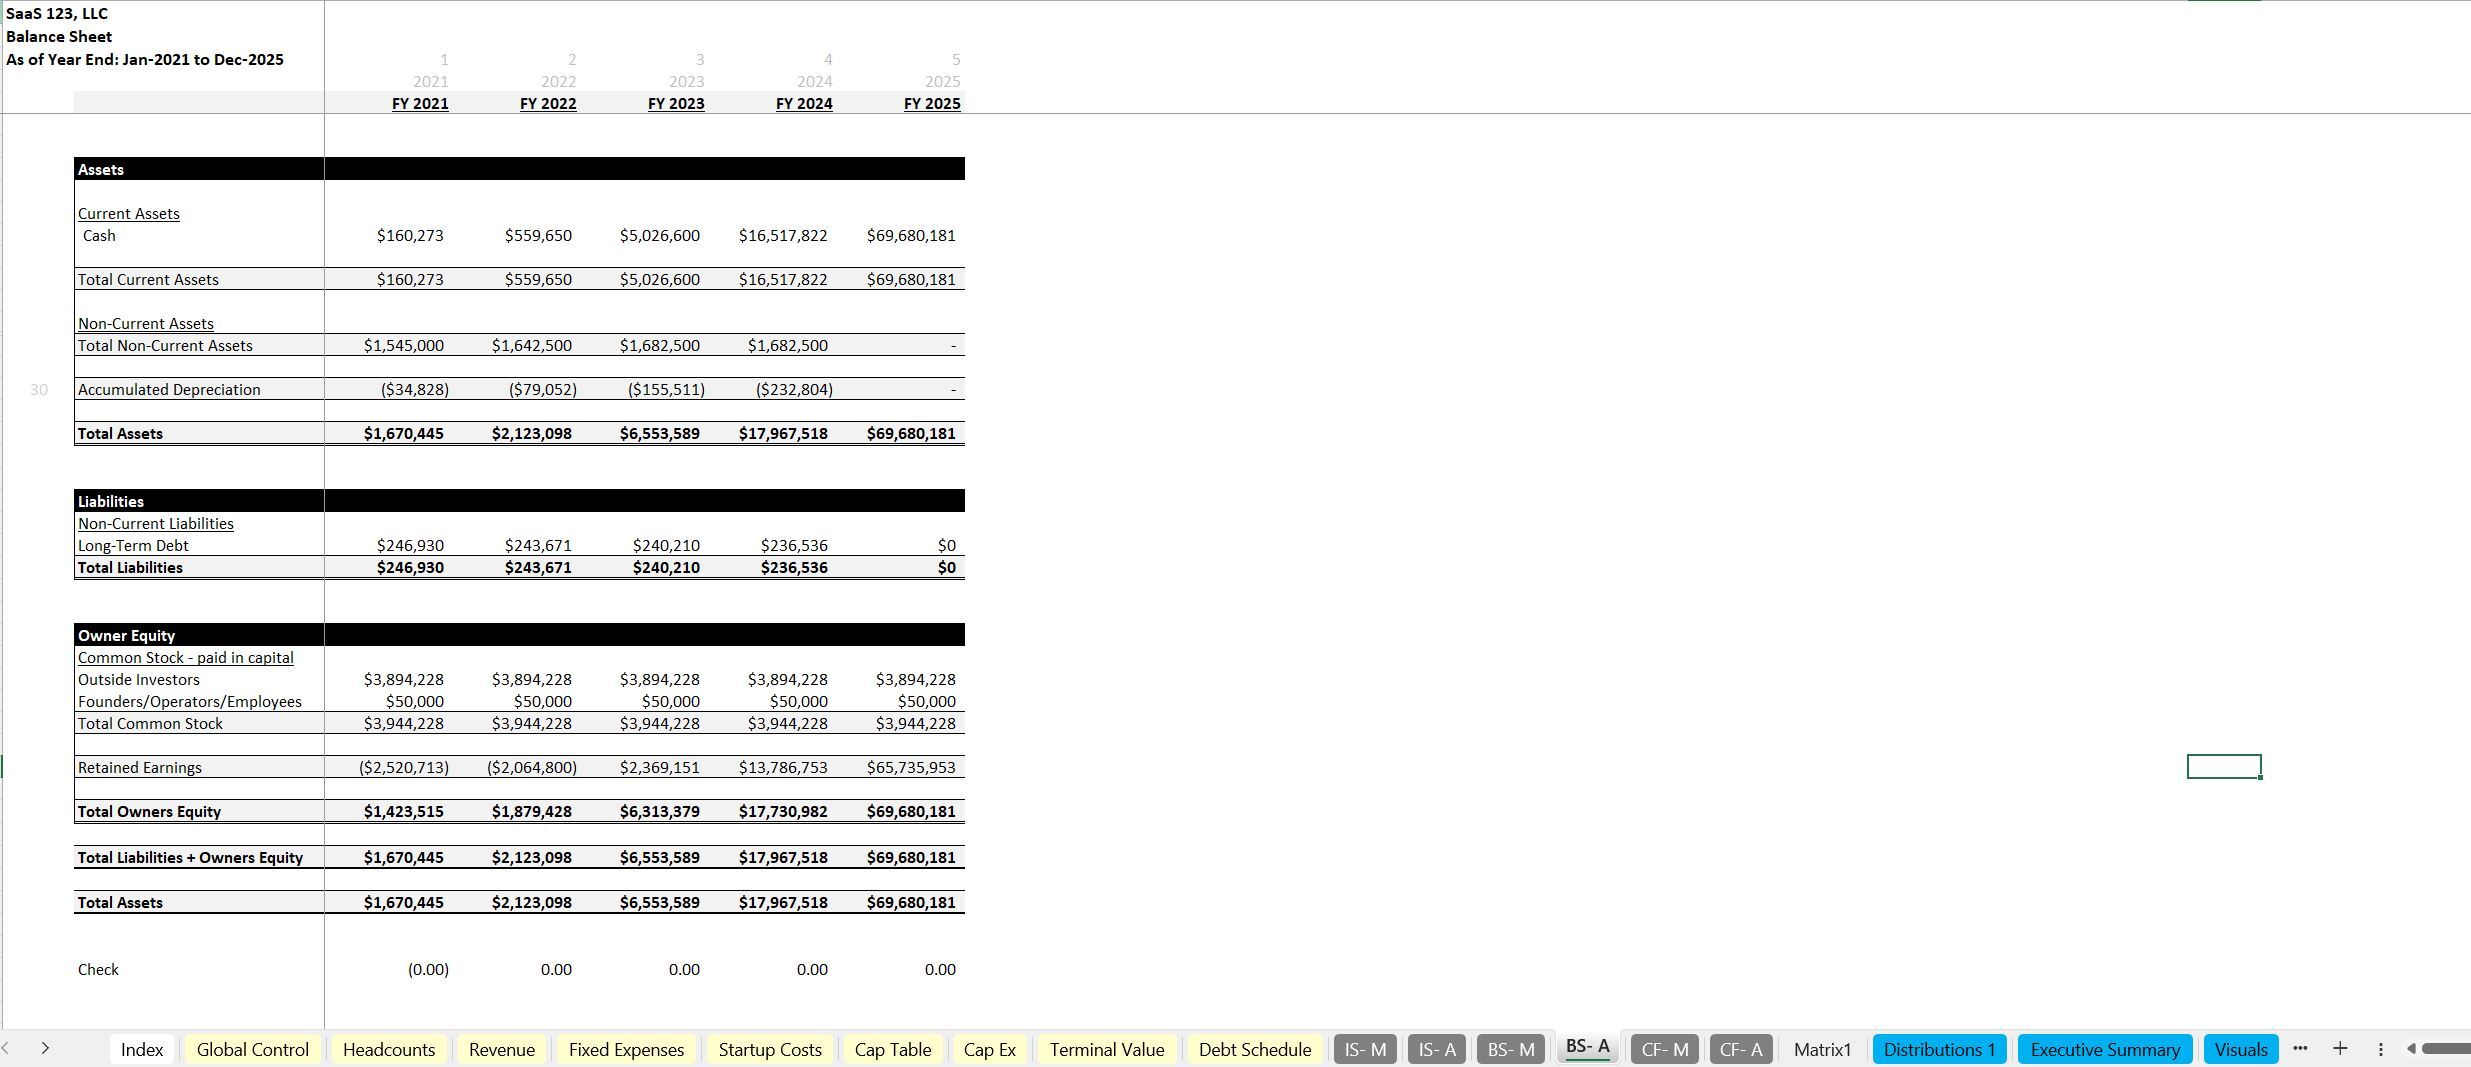
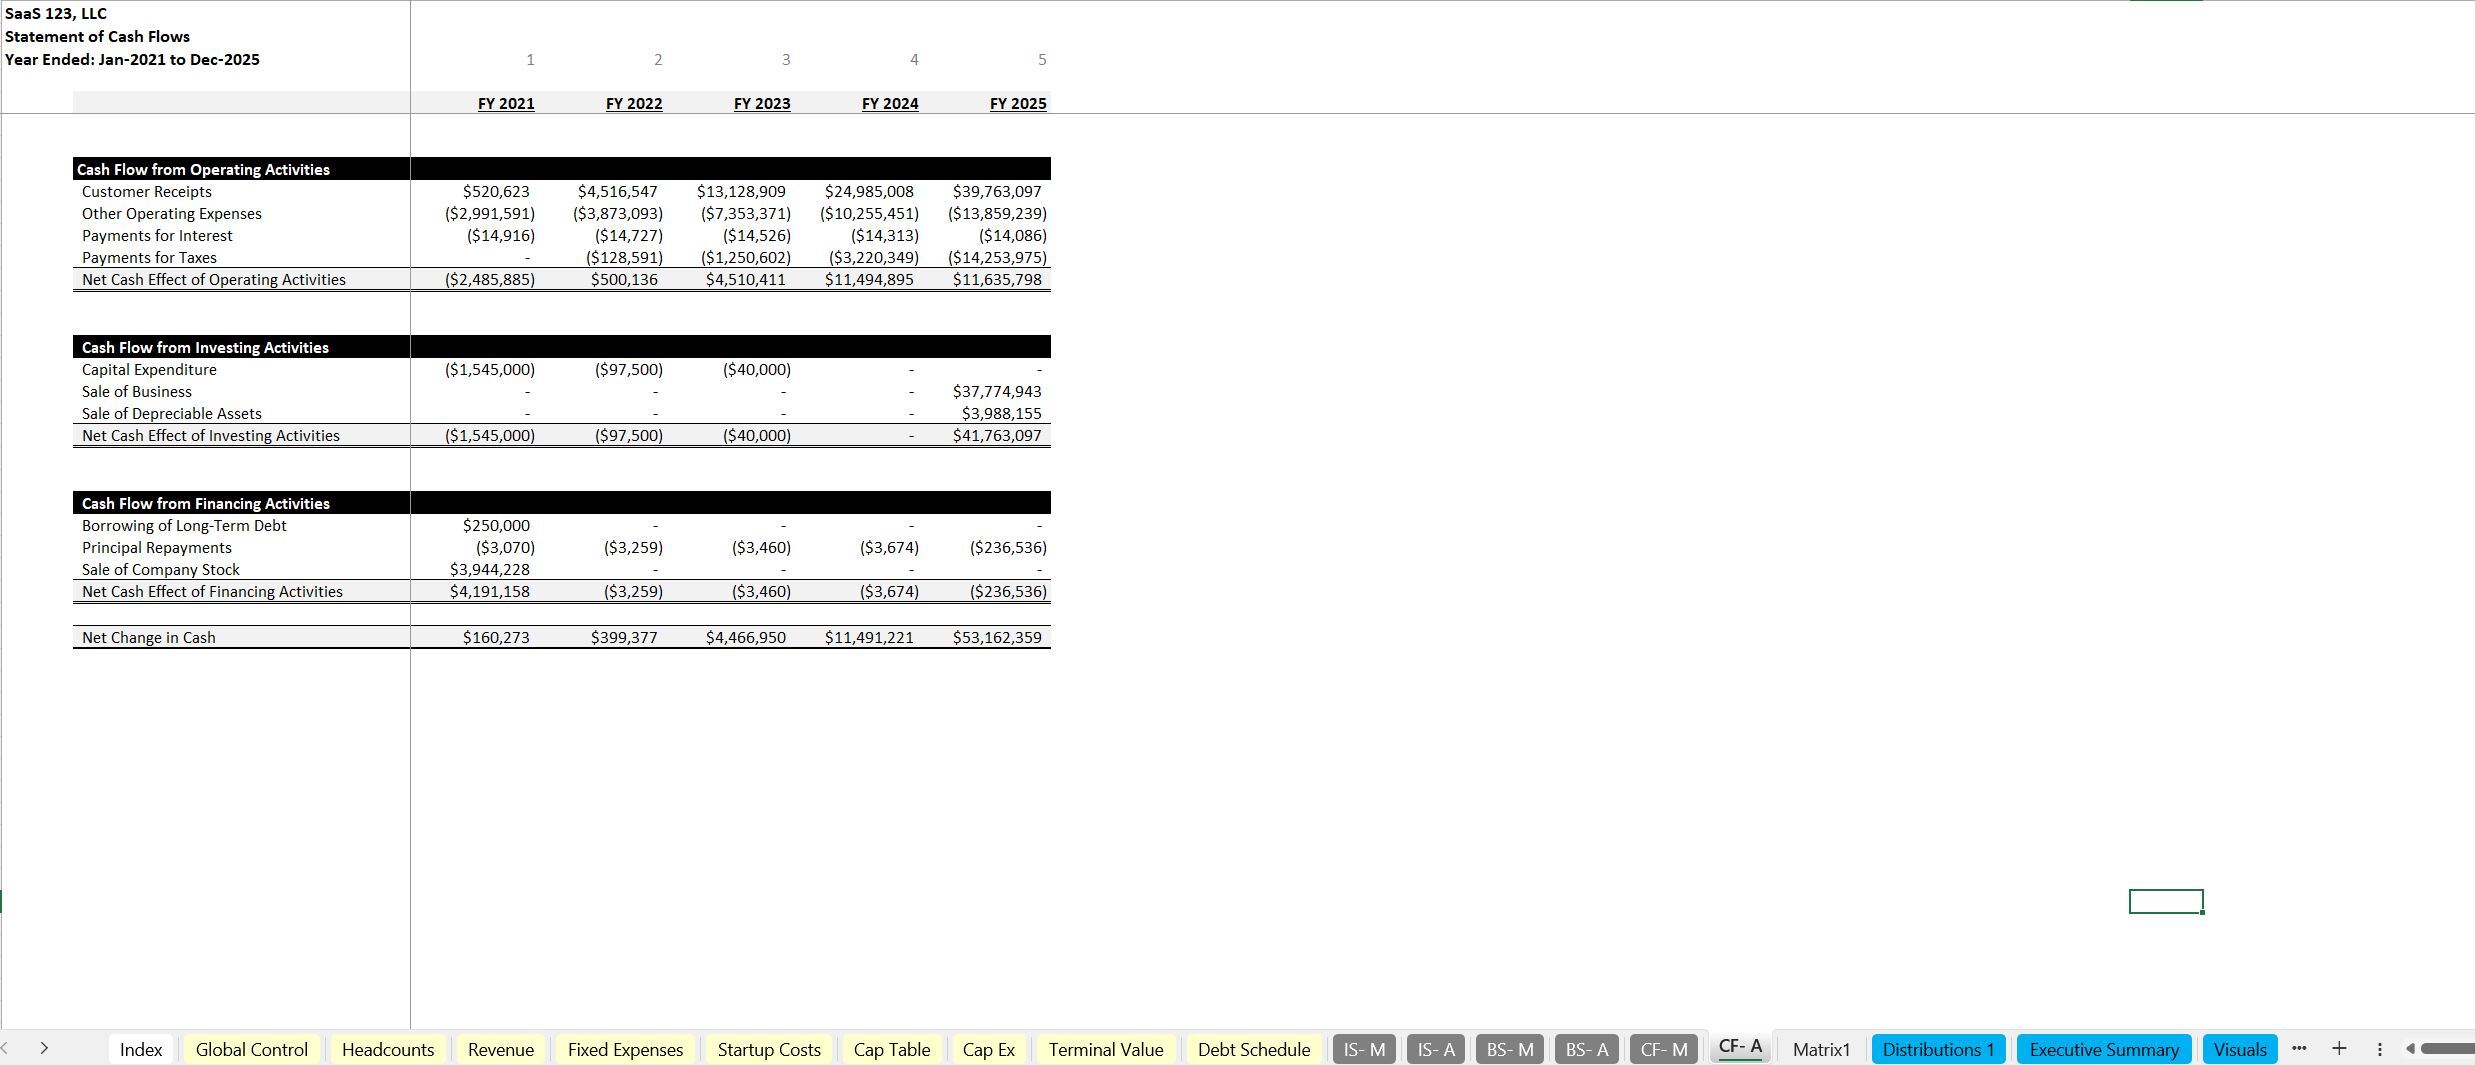
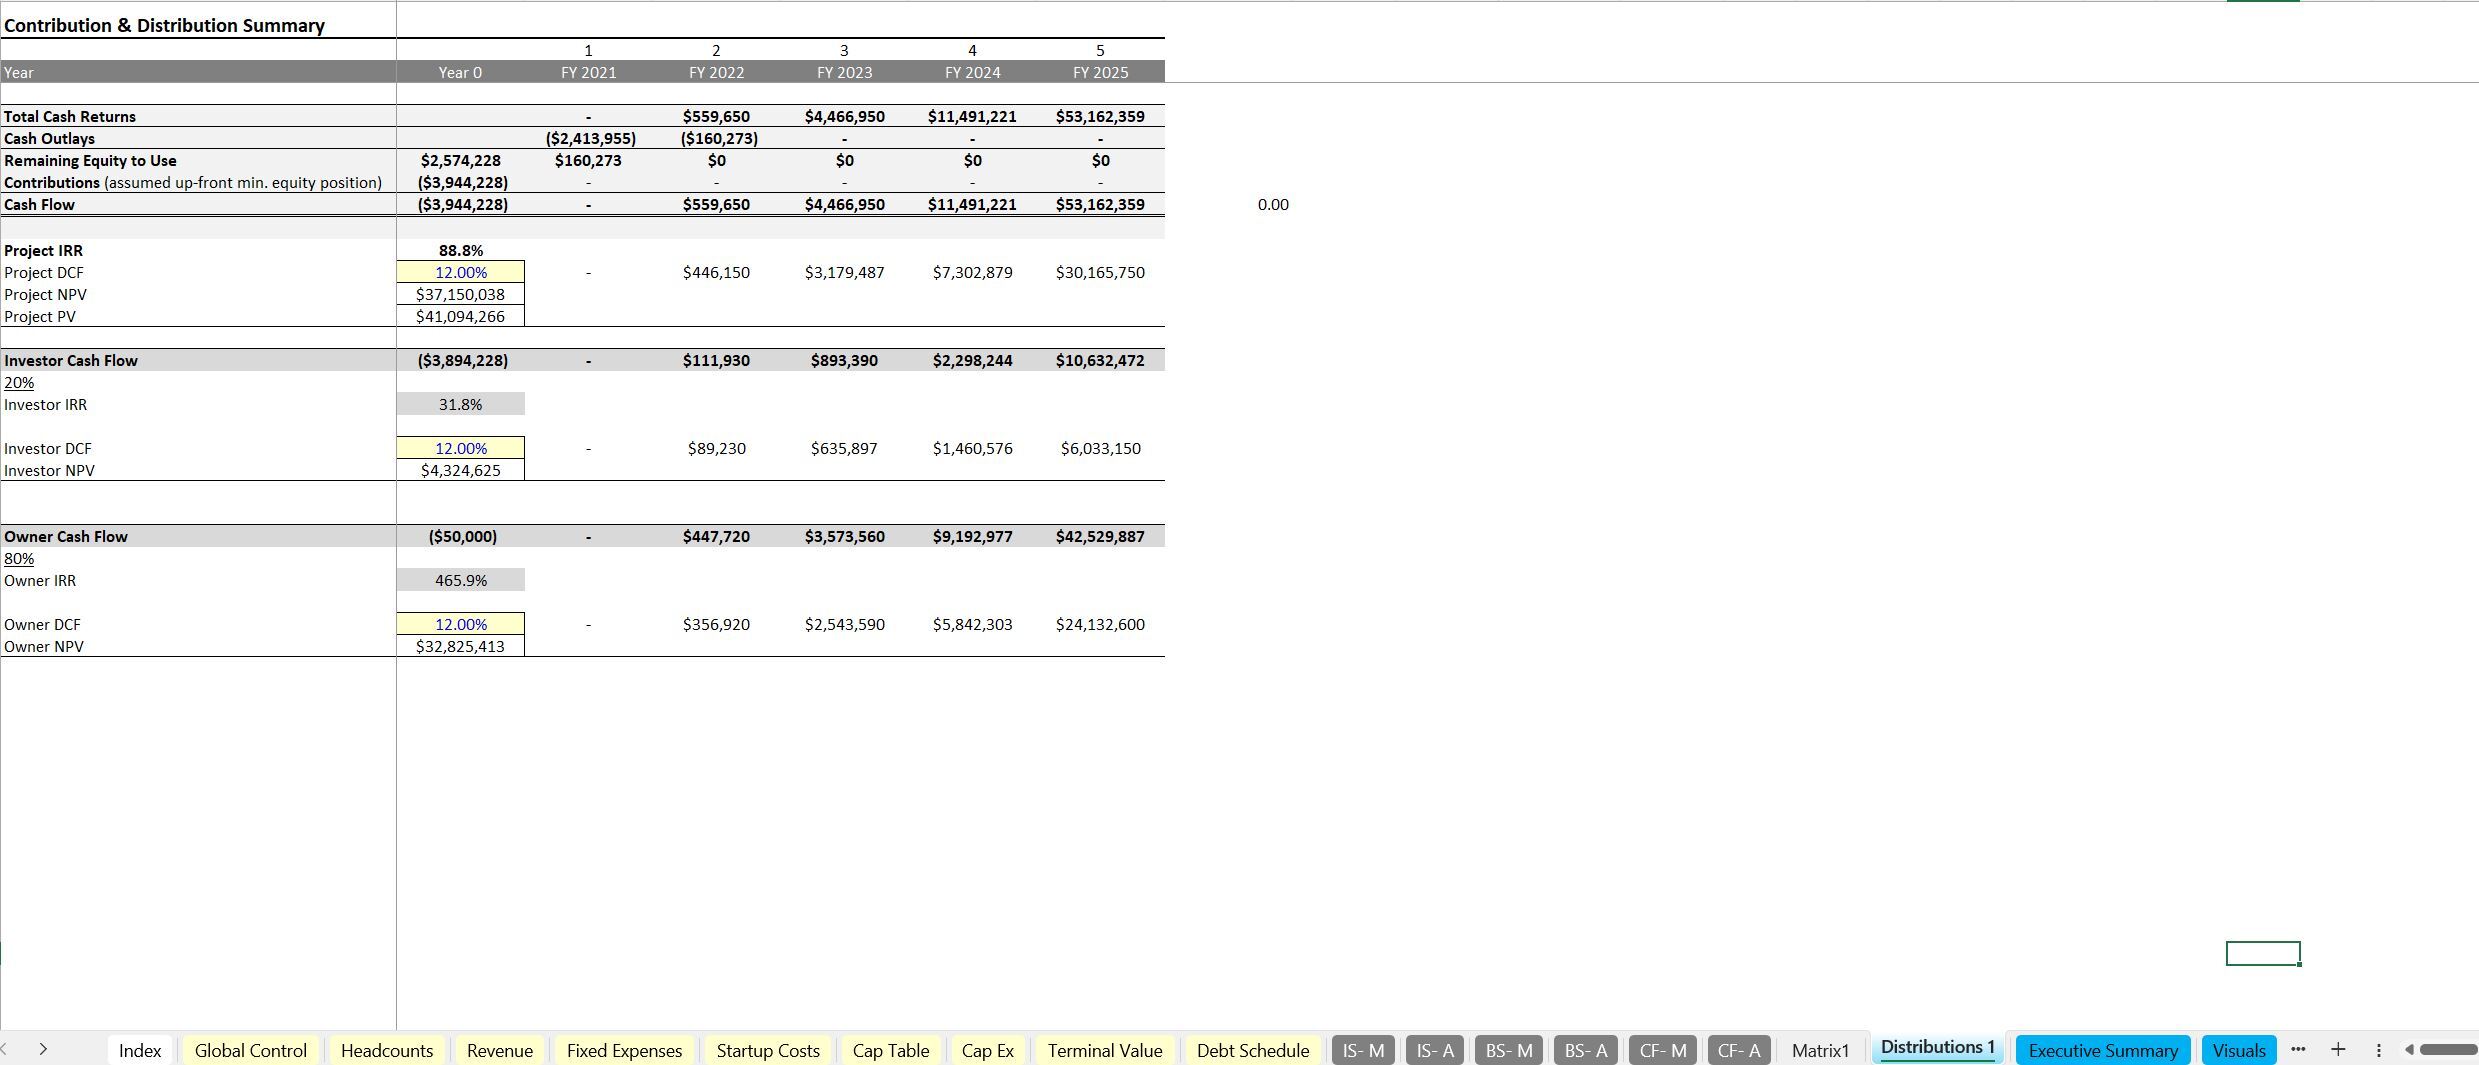
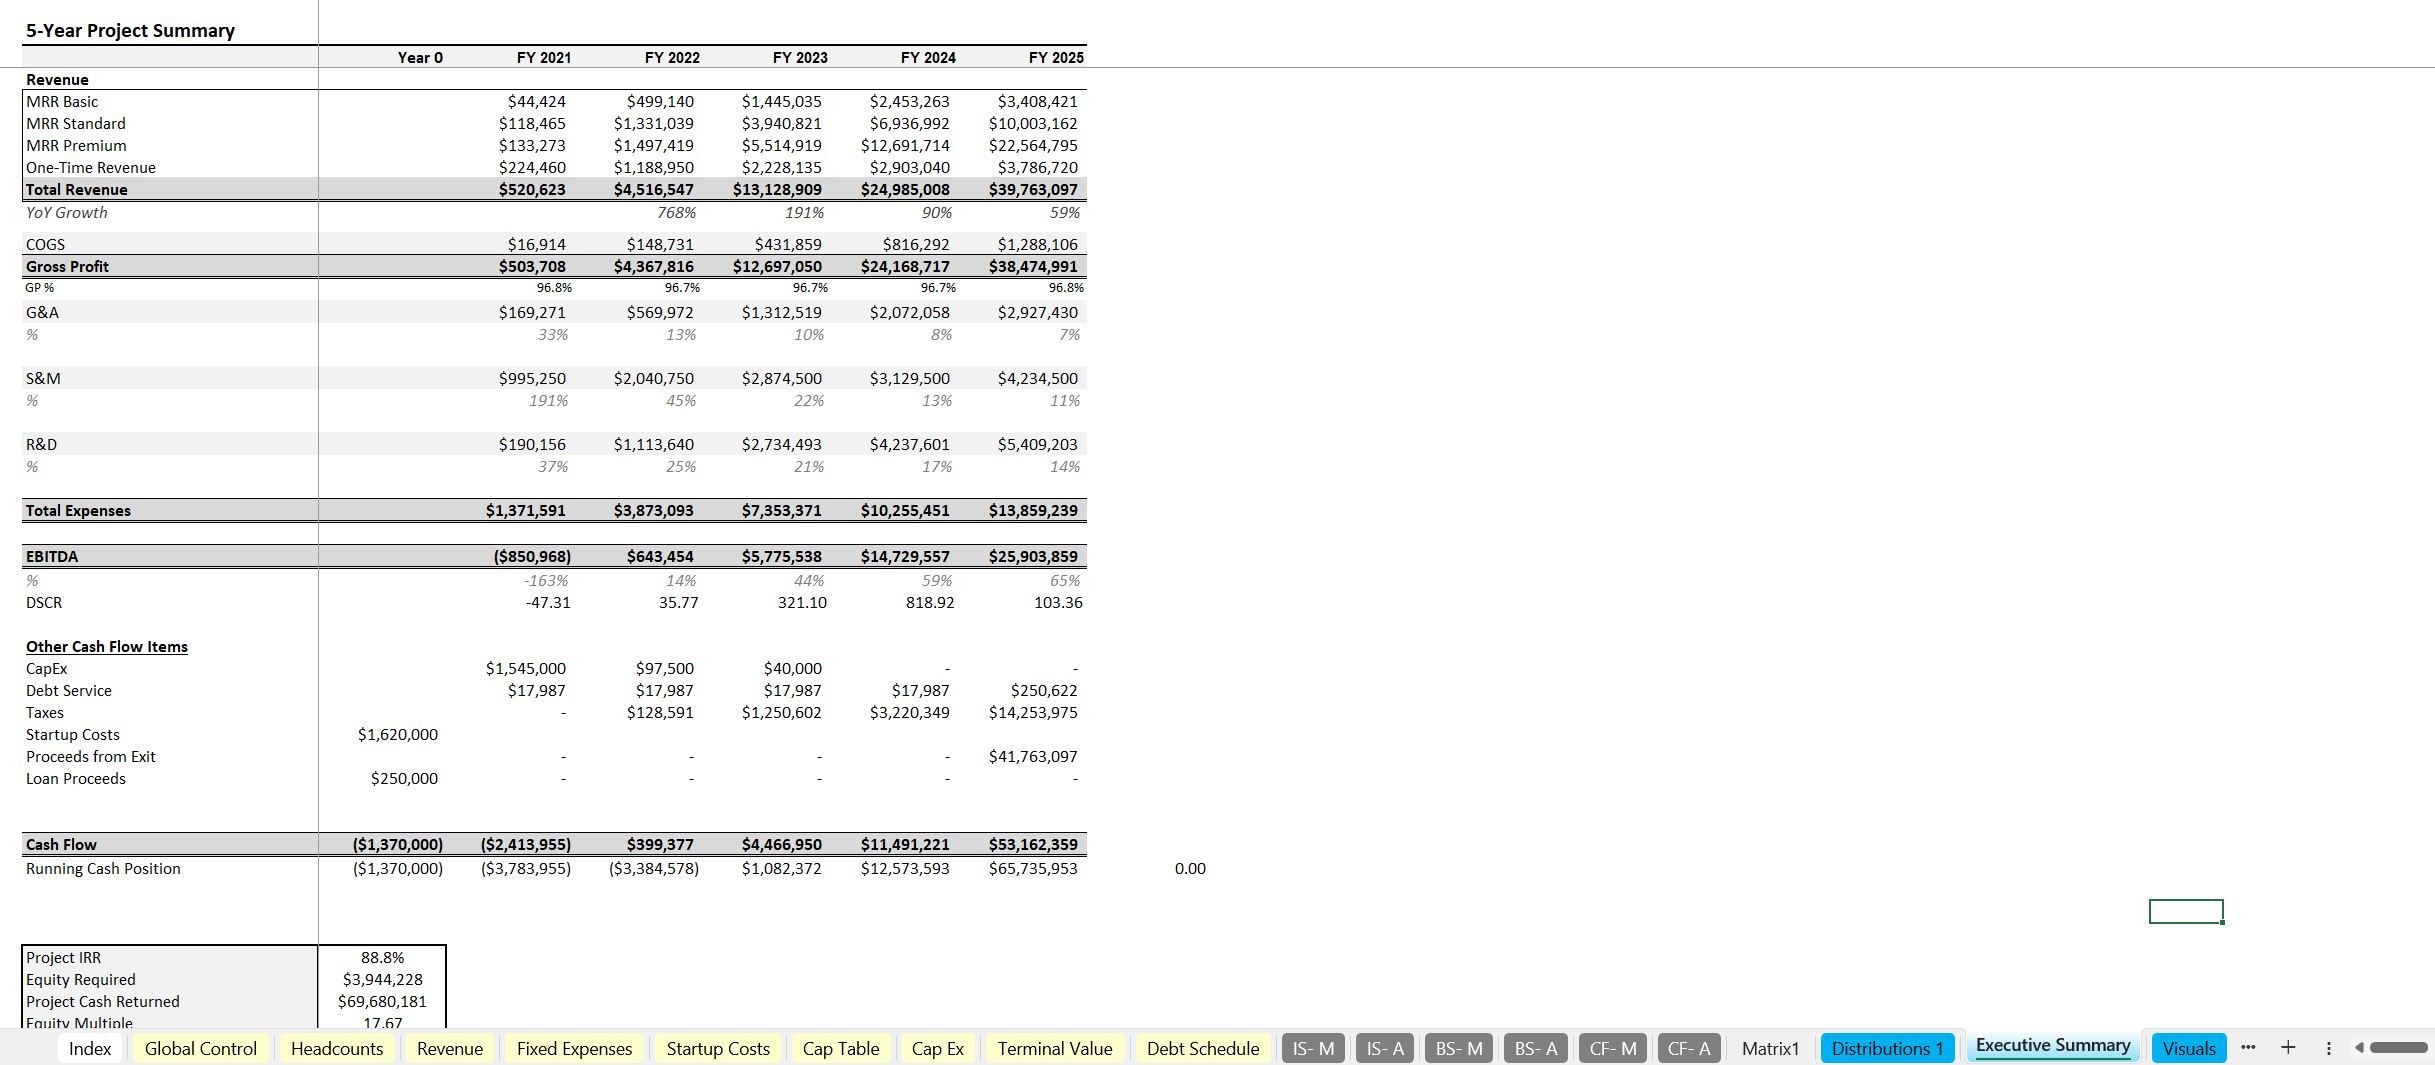
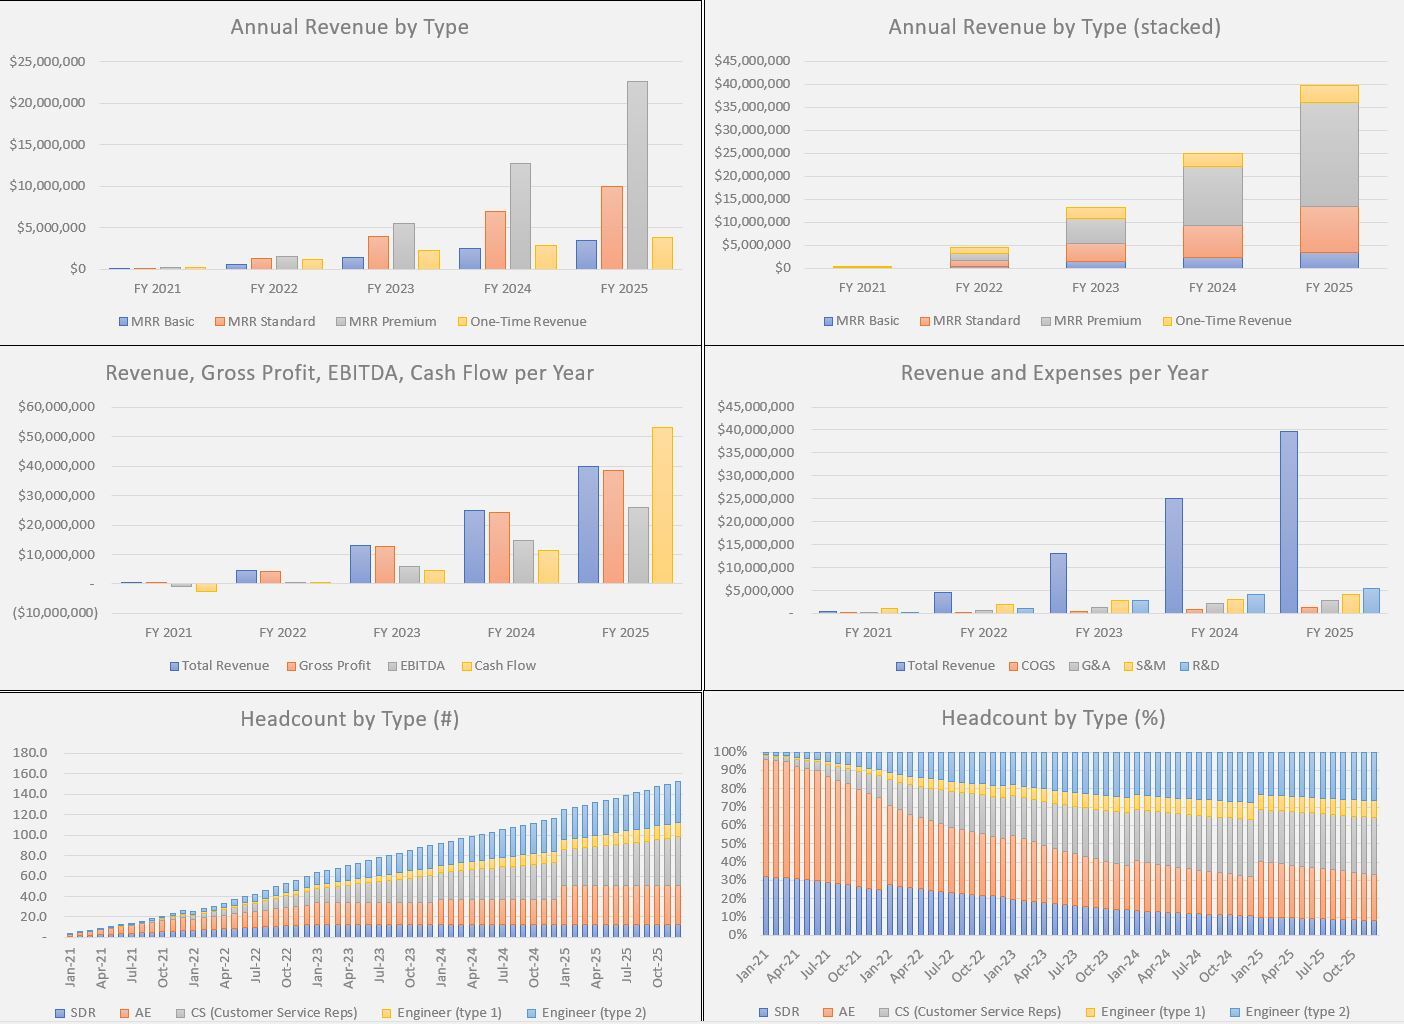
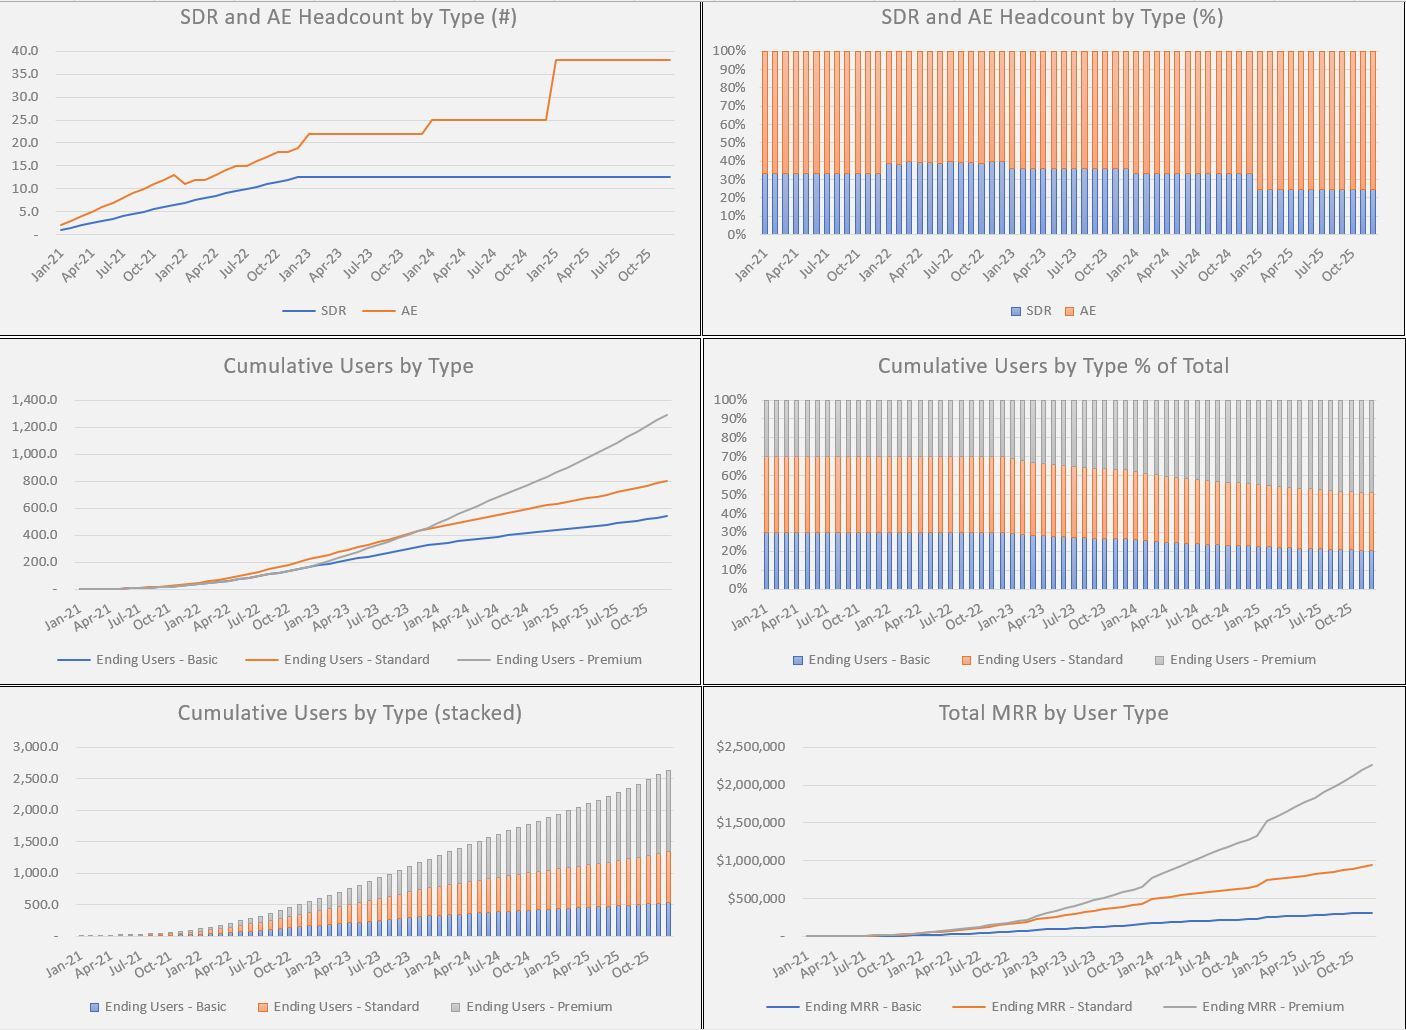
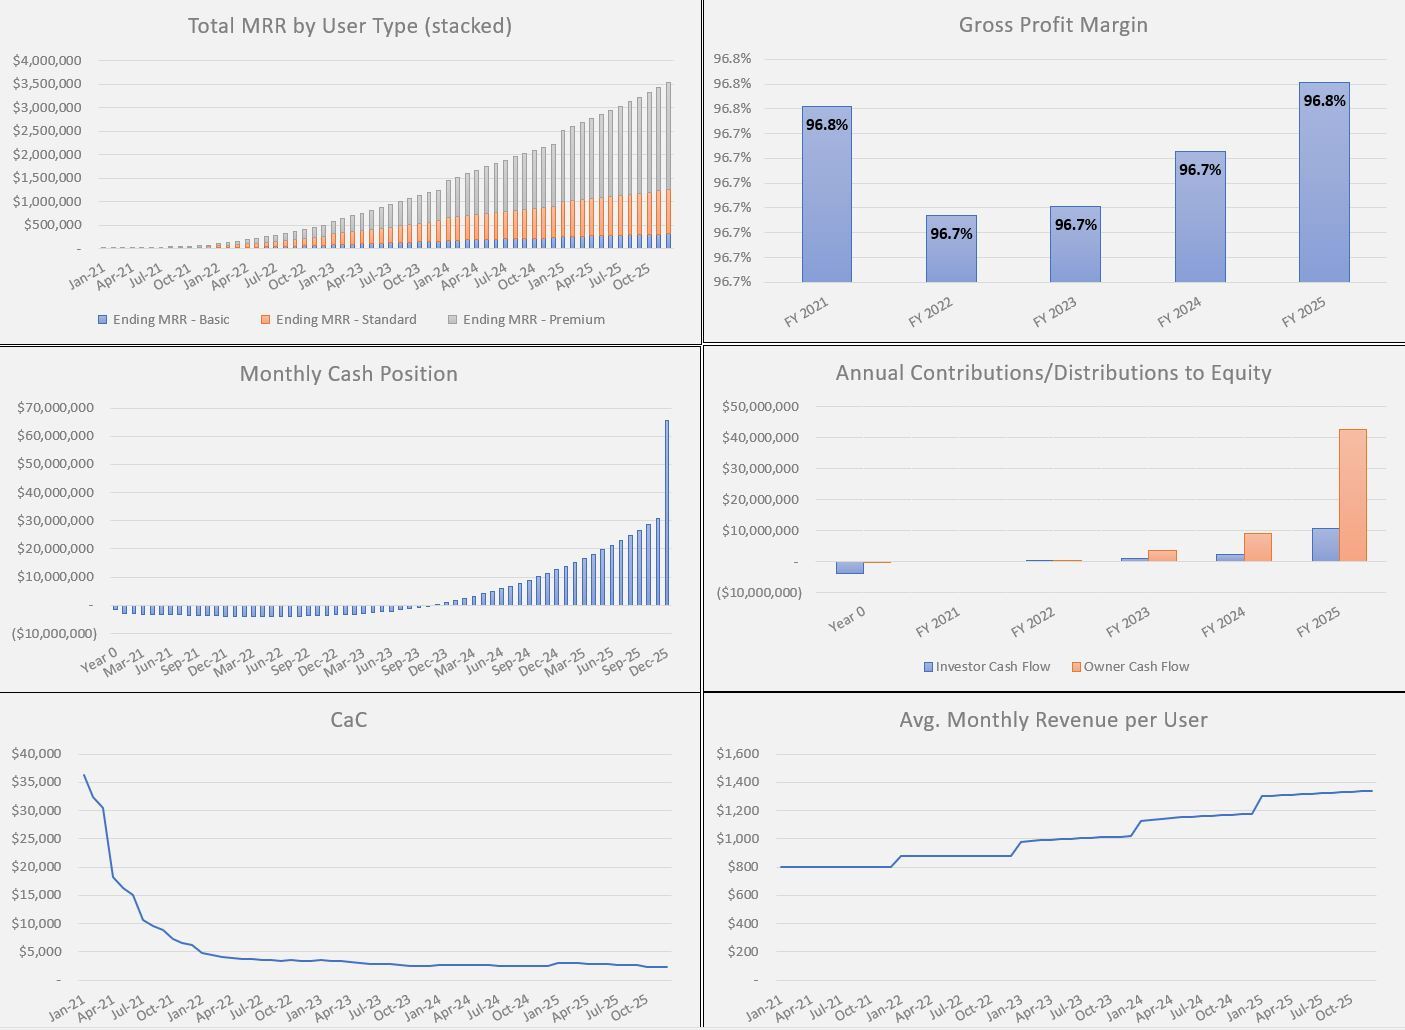
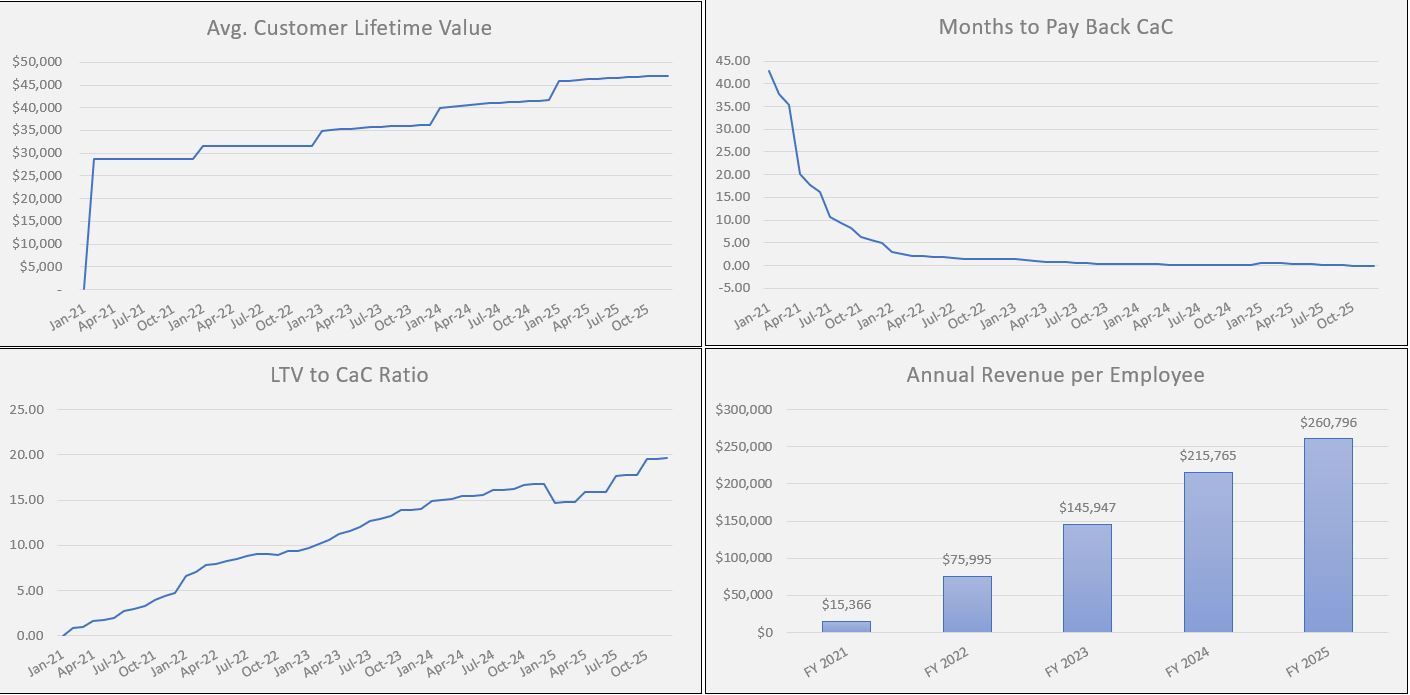
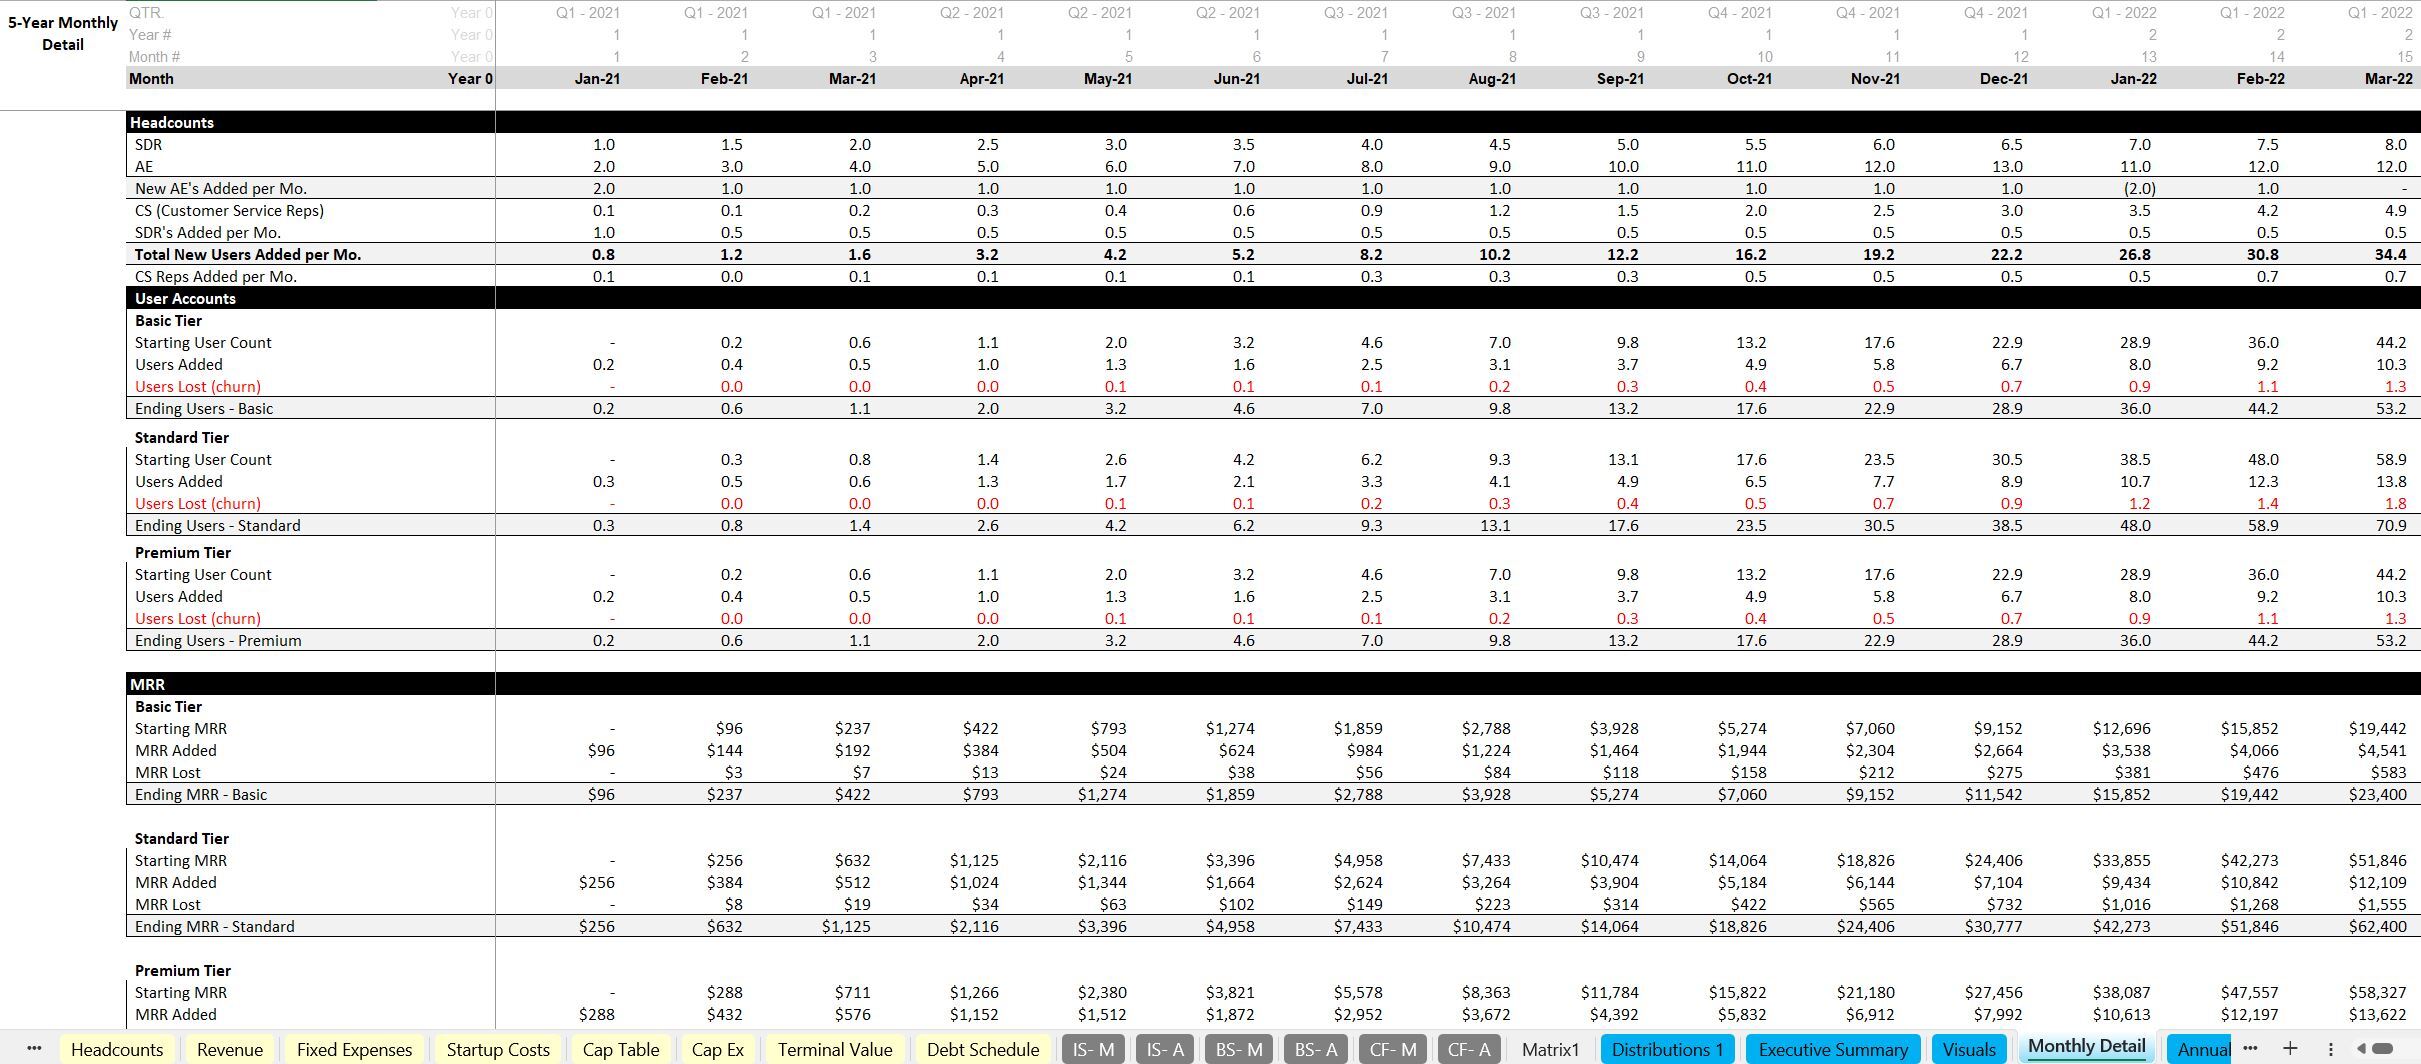
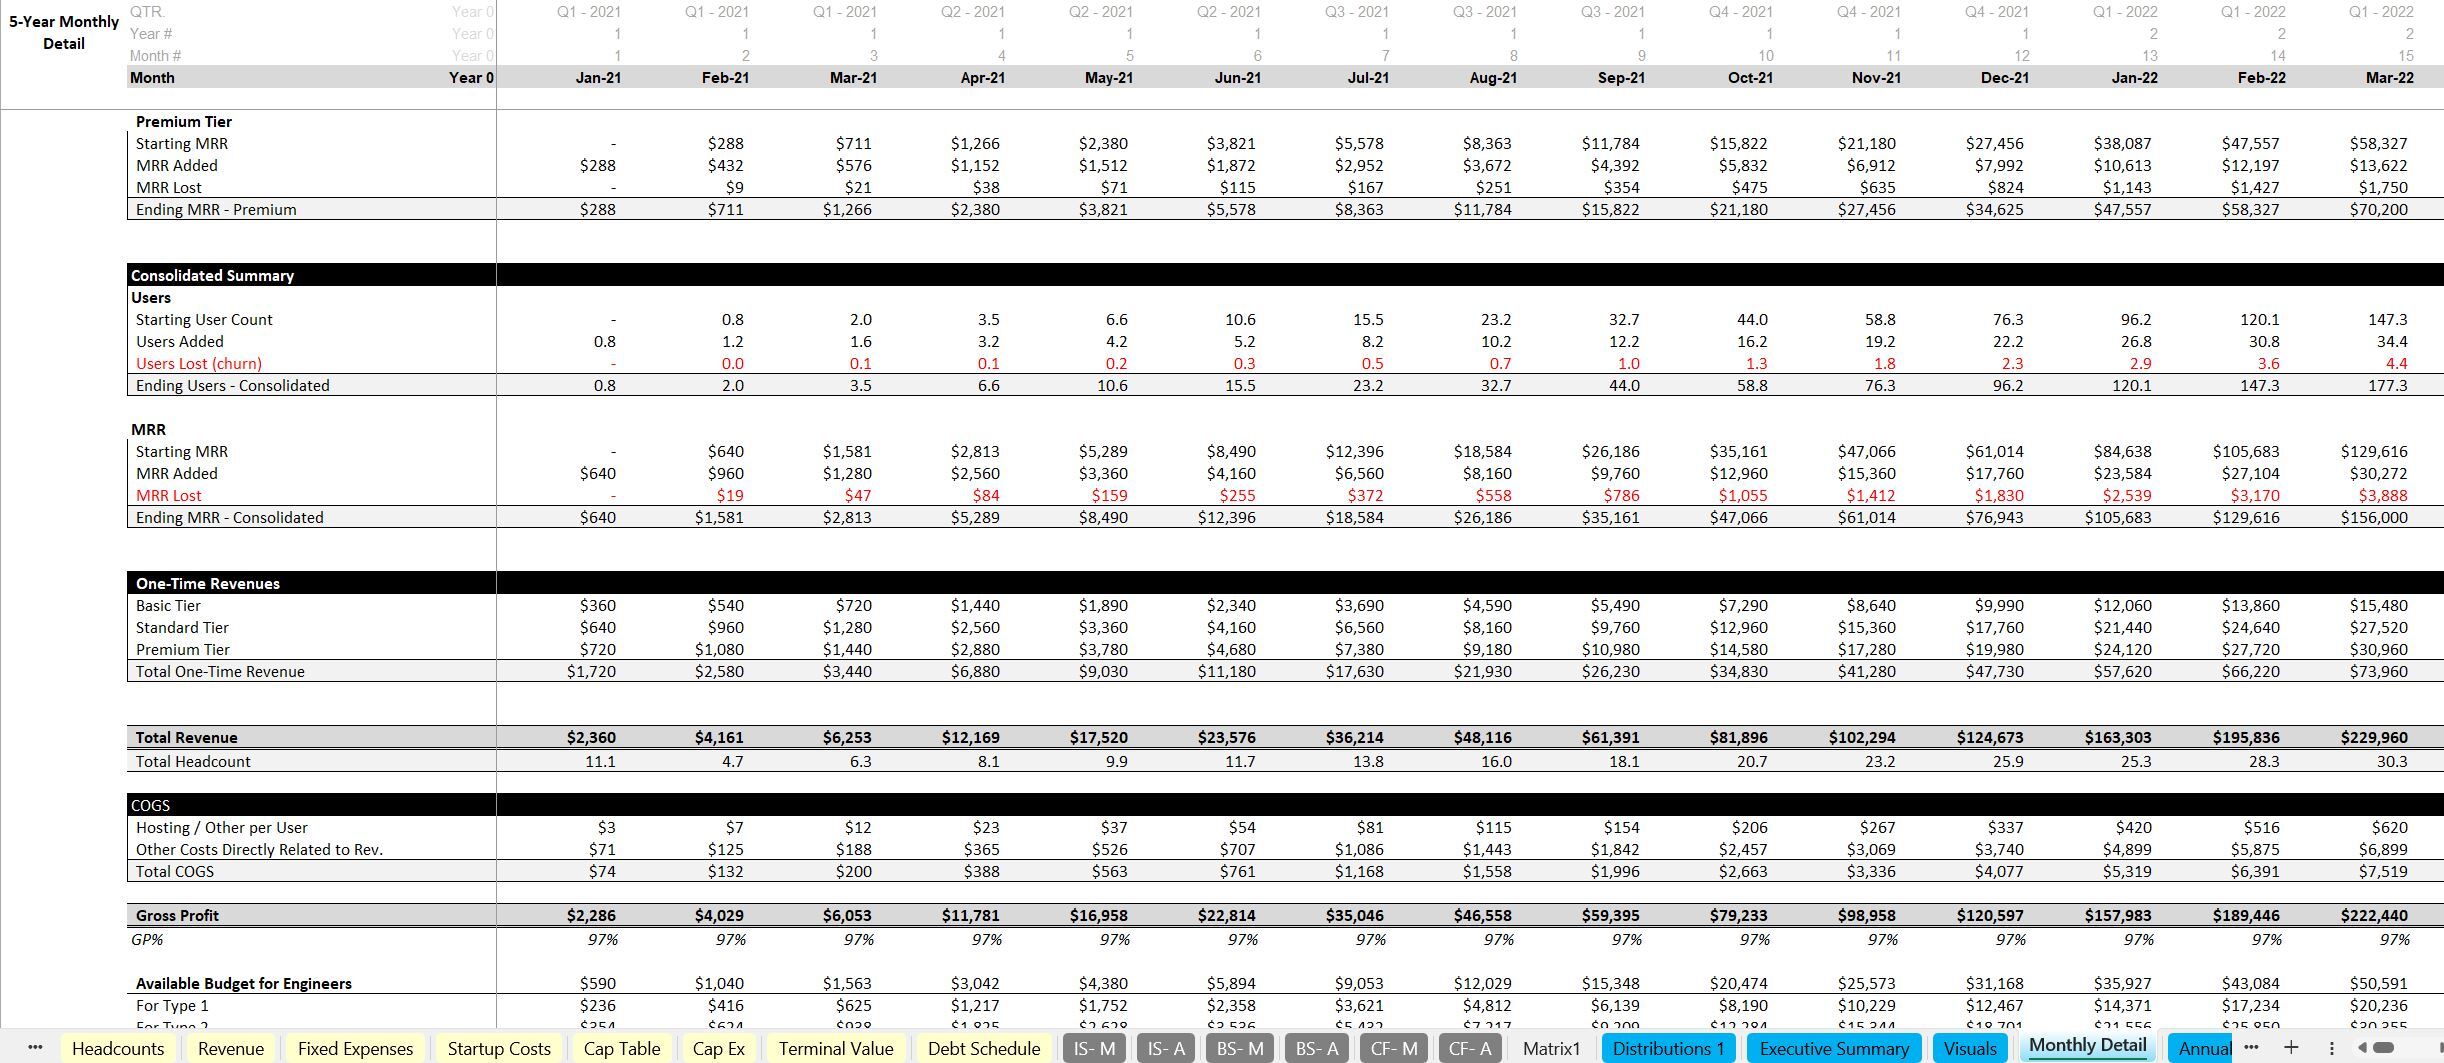
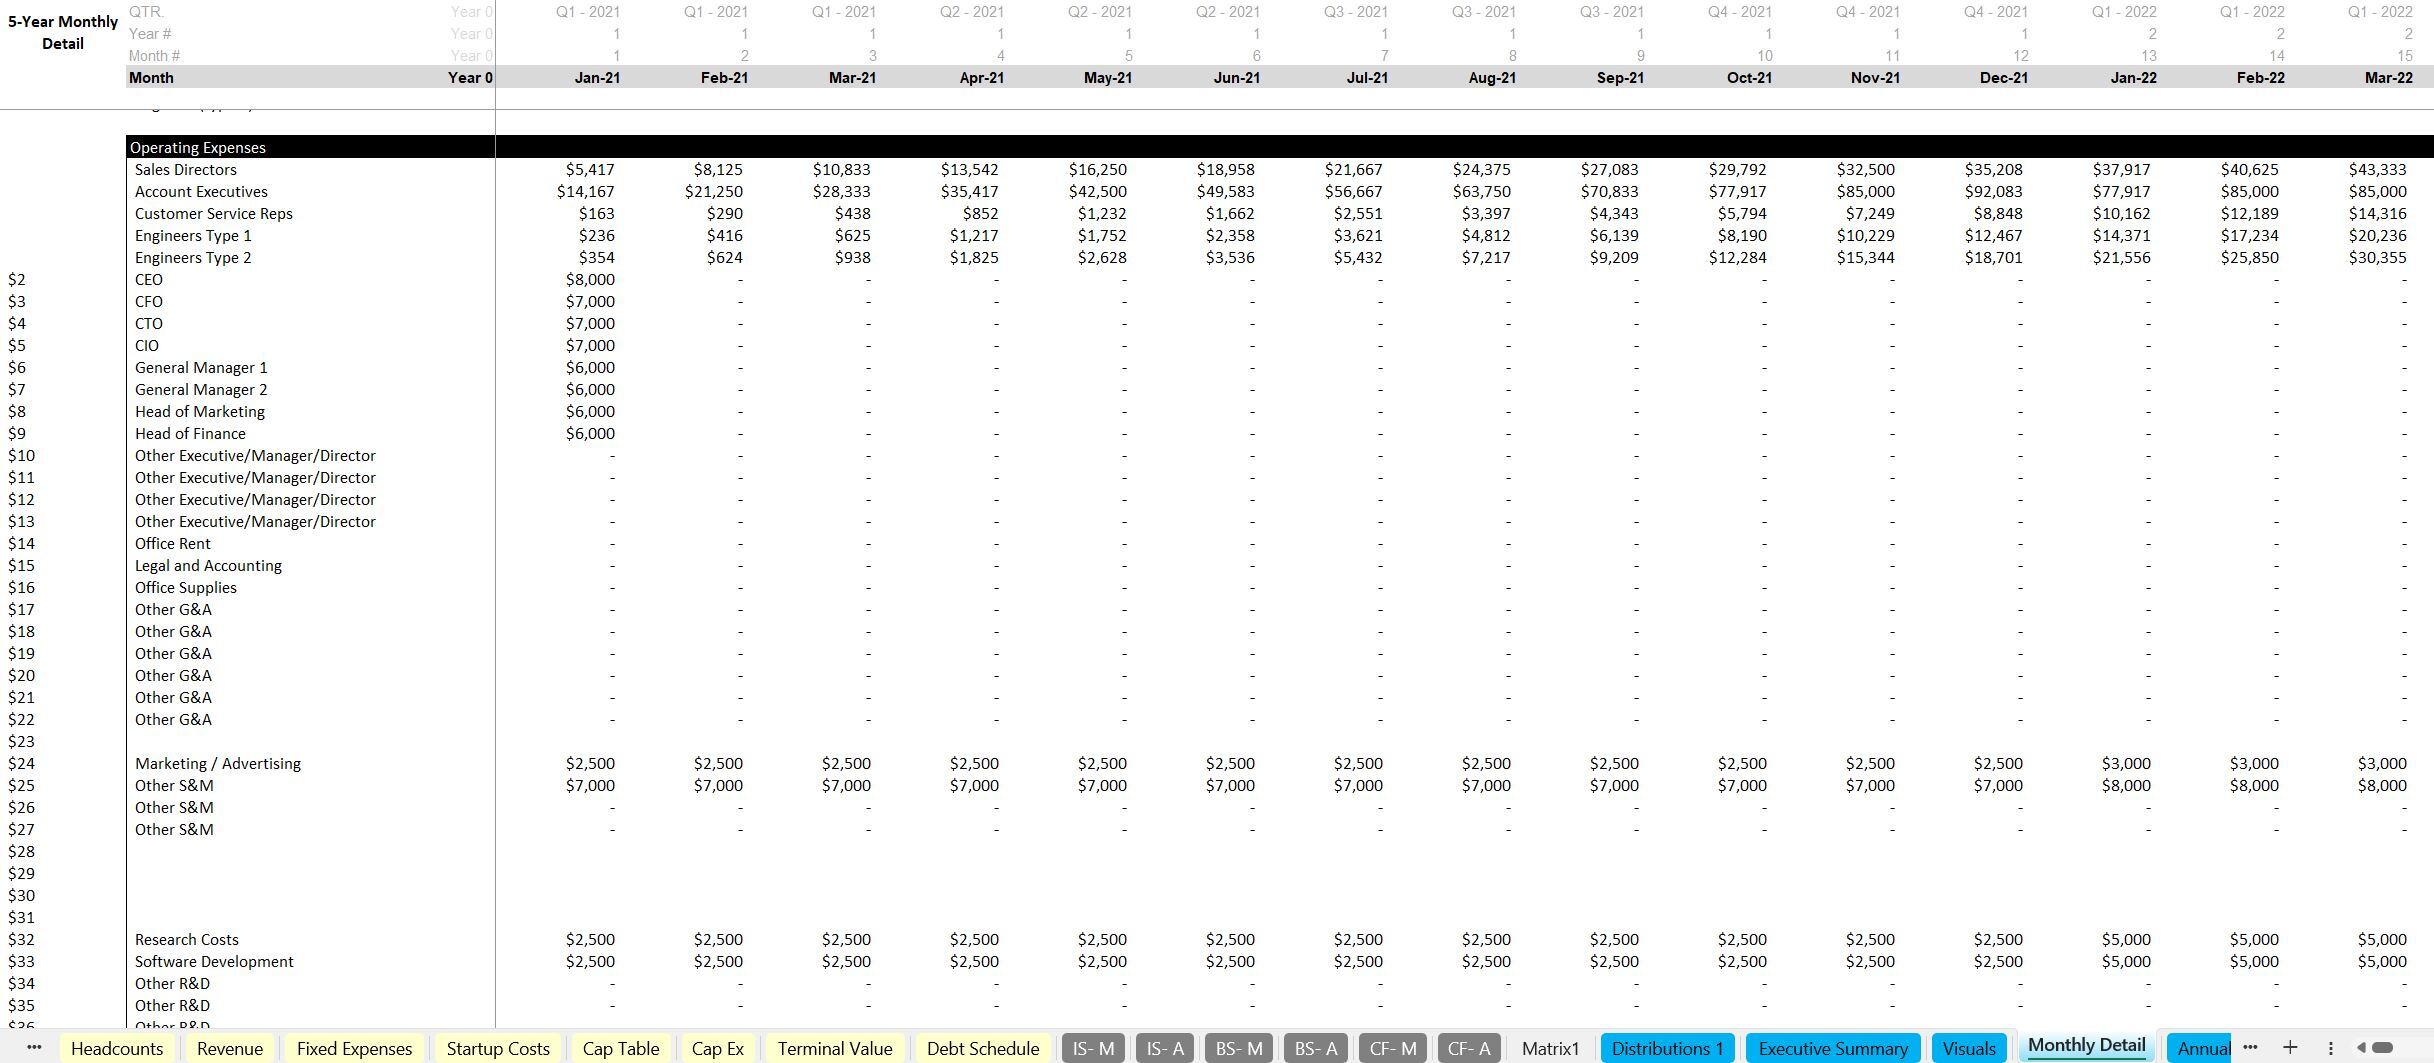
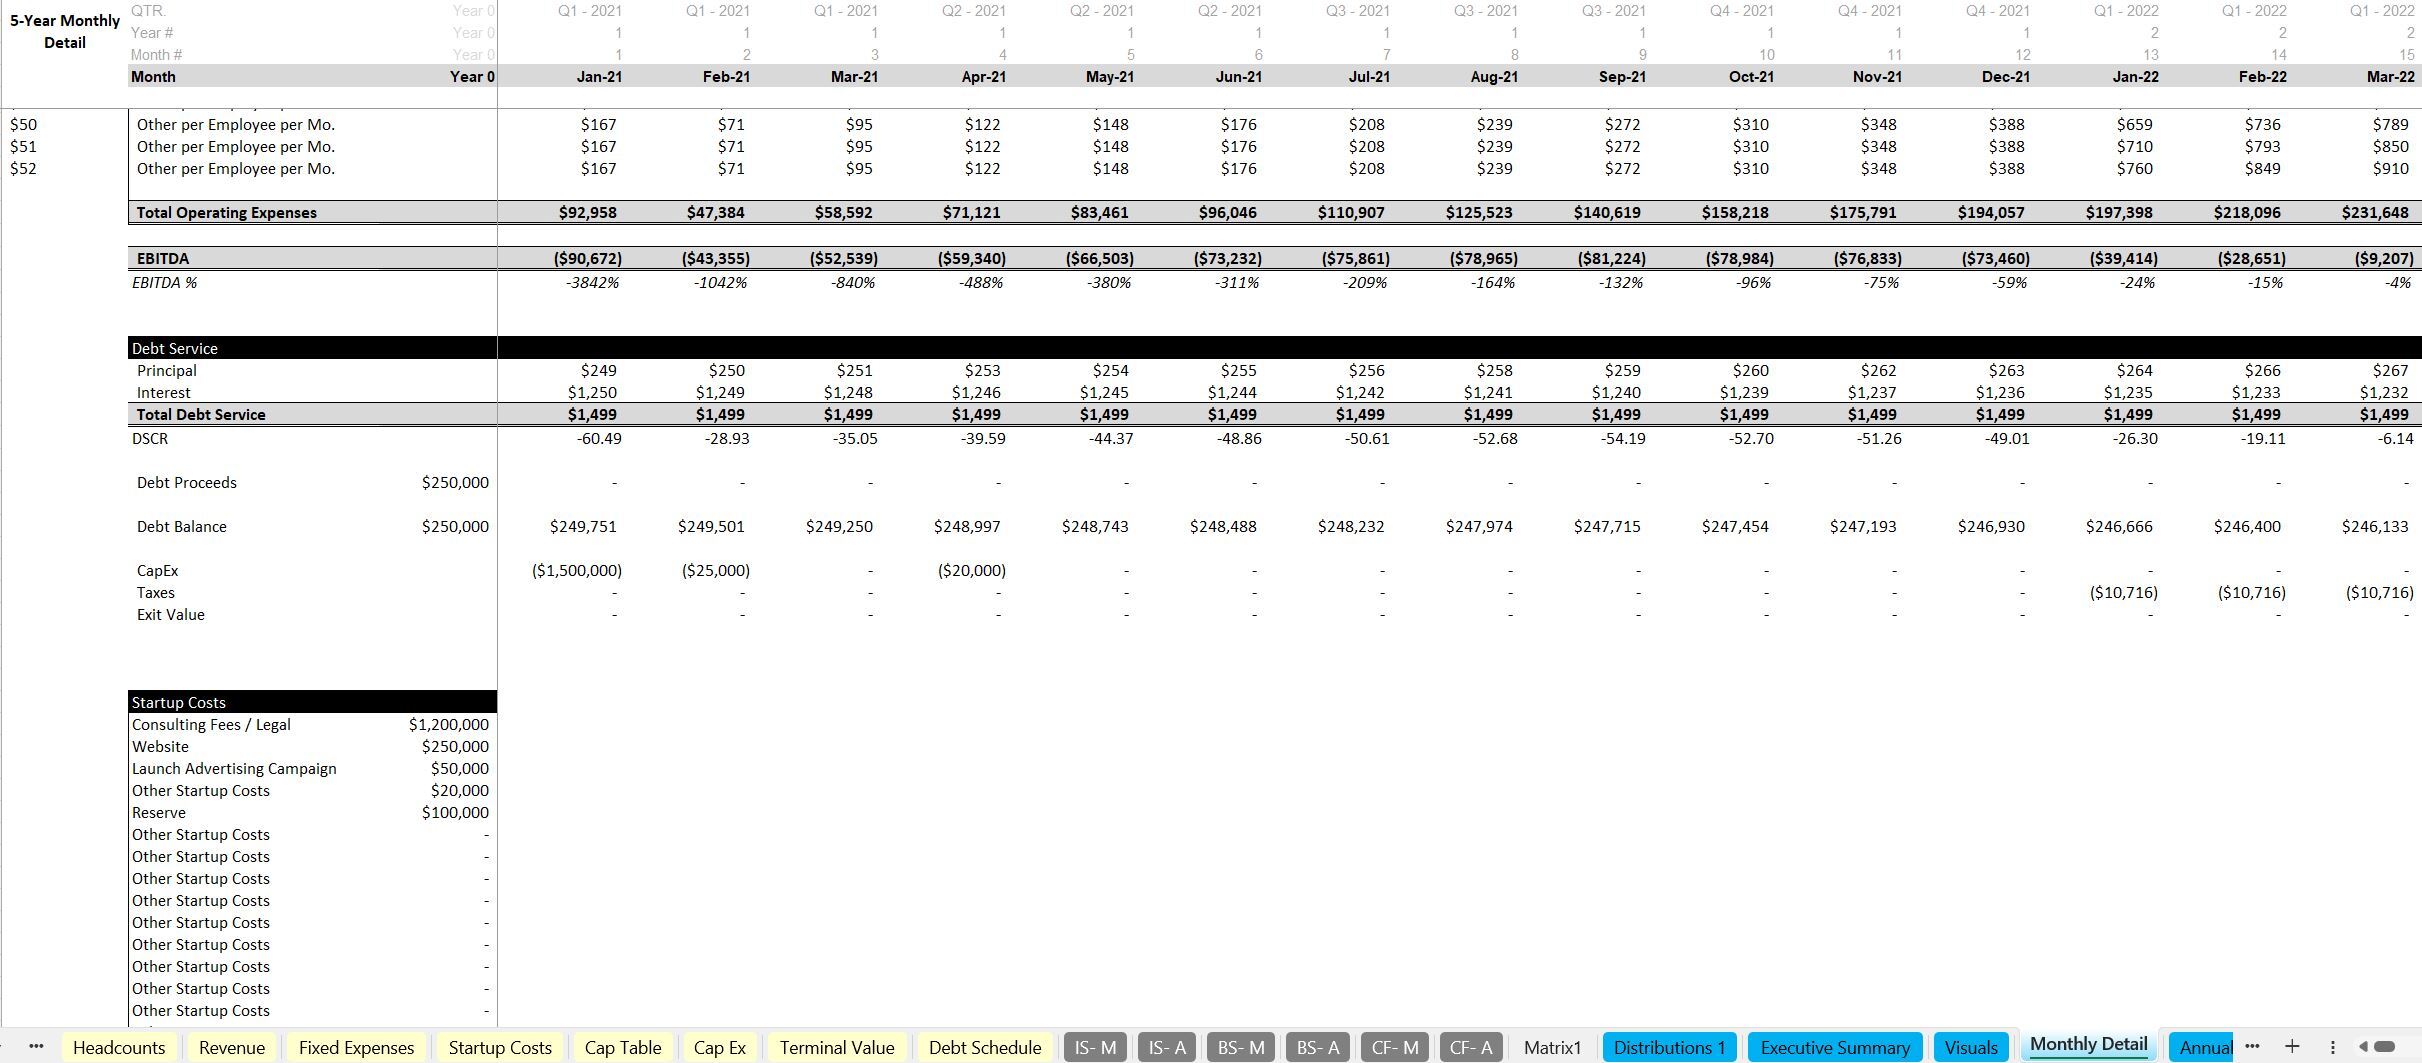
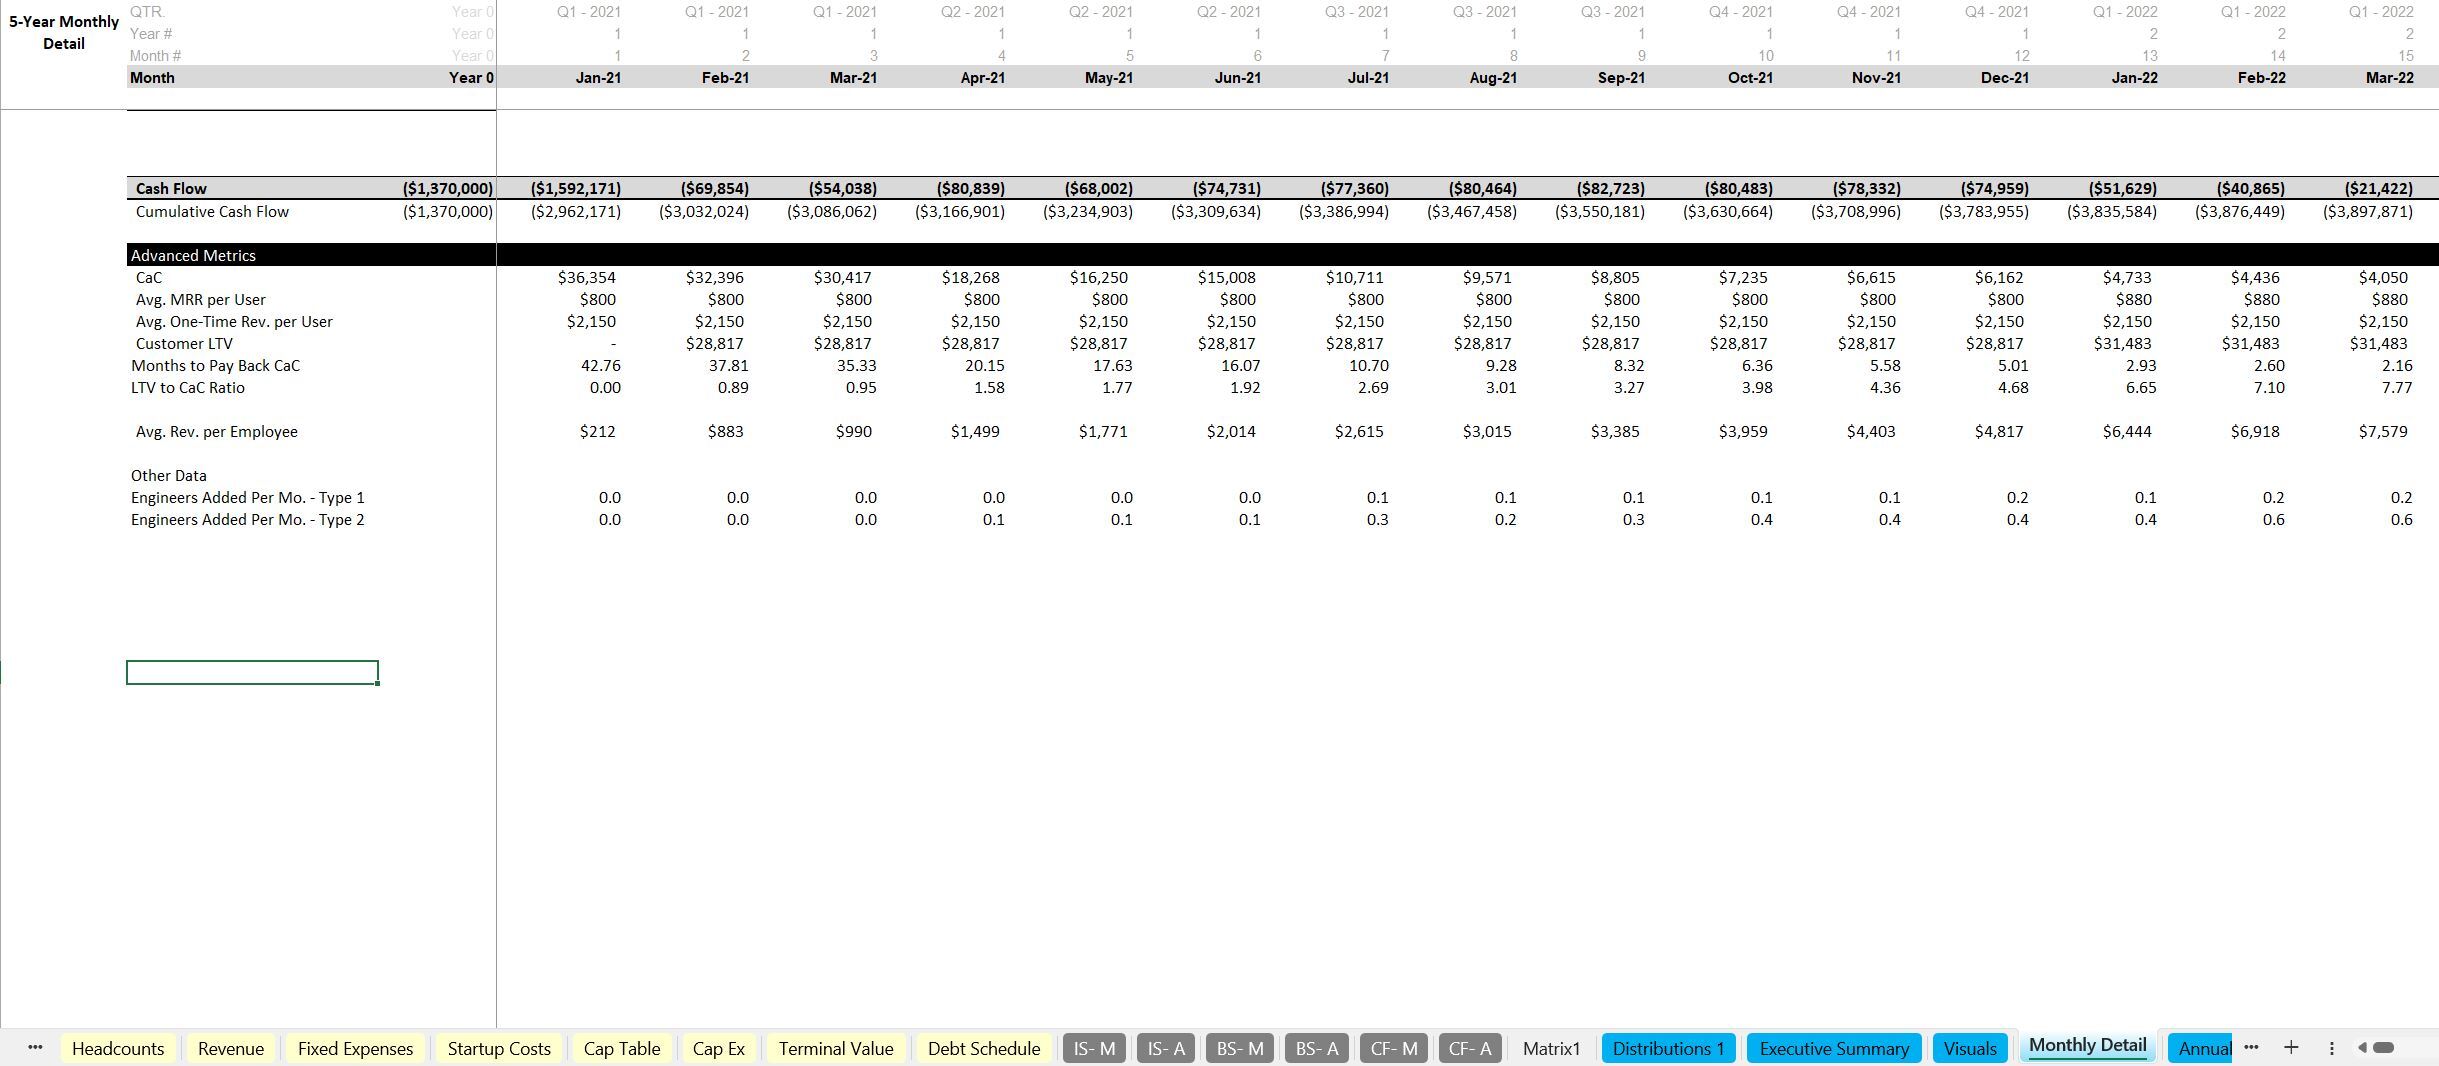
World Class SaaS Model - Growth Driven by Headcount Ratios and Quota Attainment
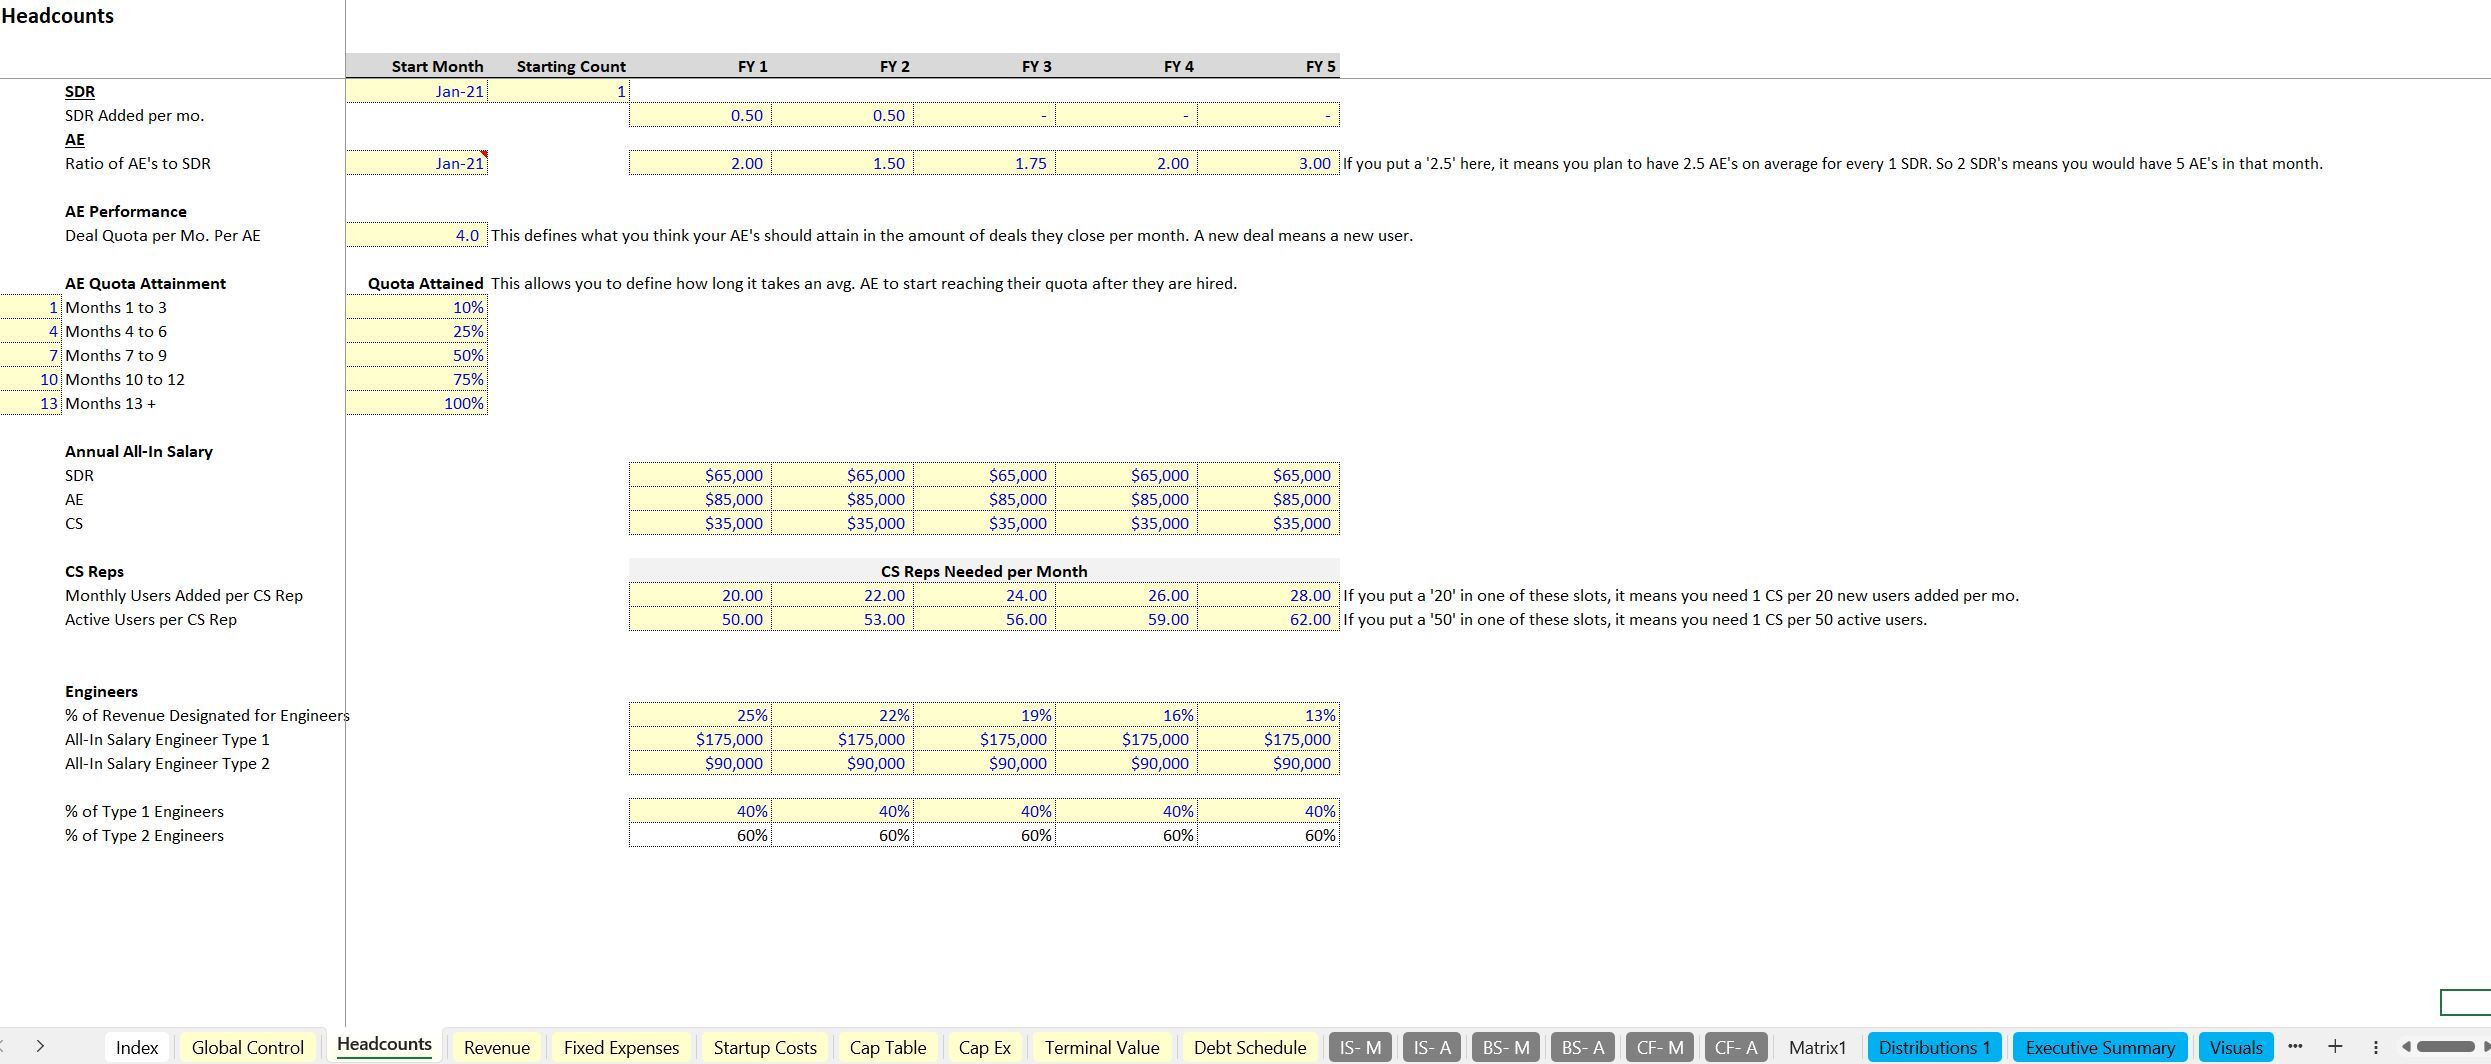
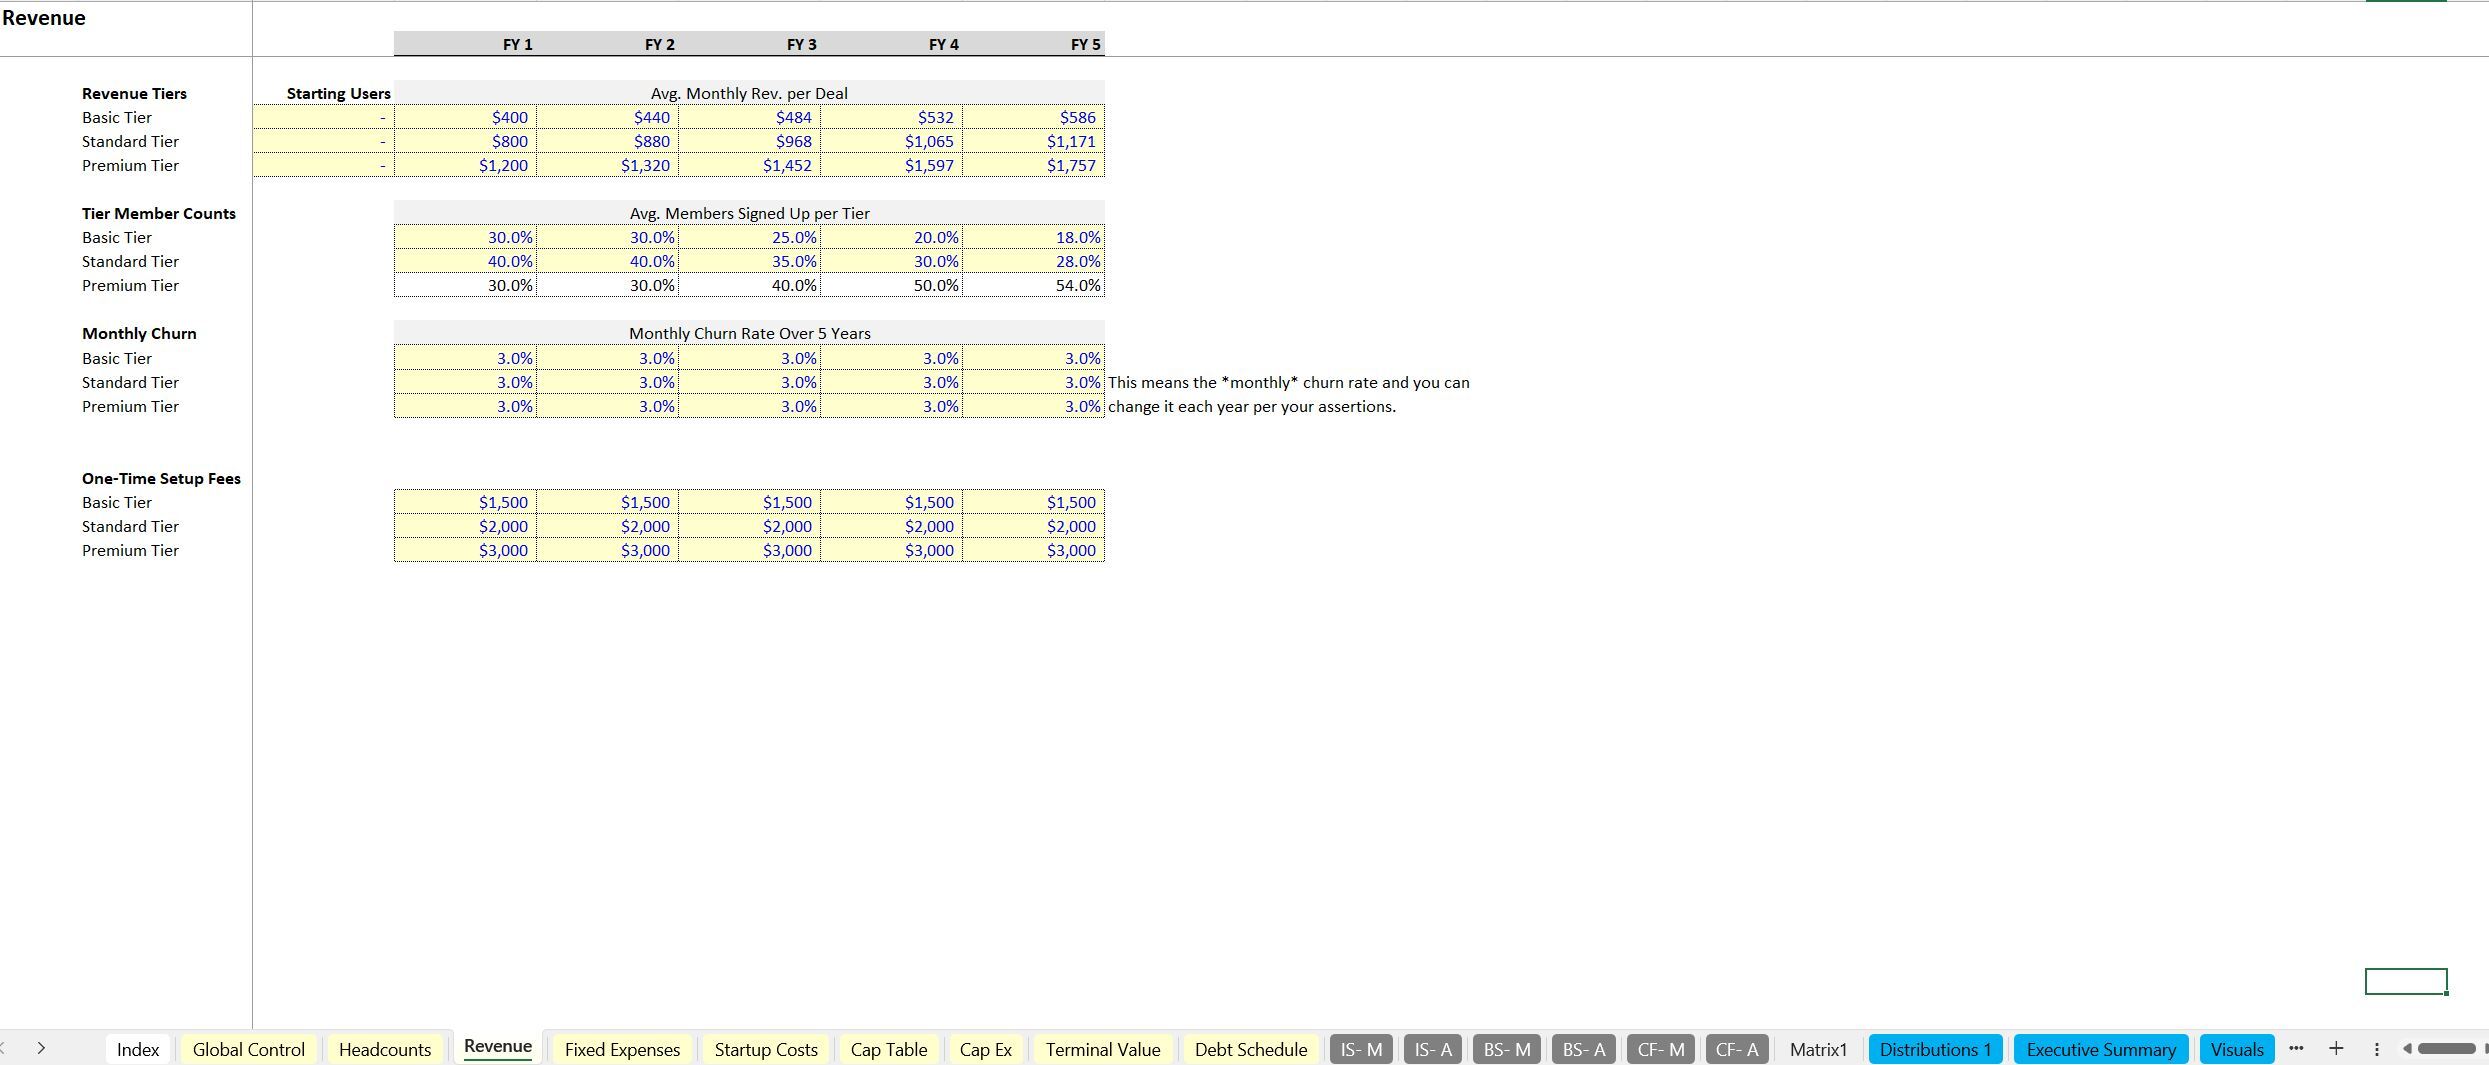
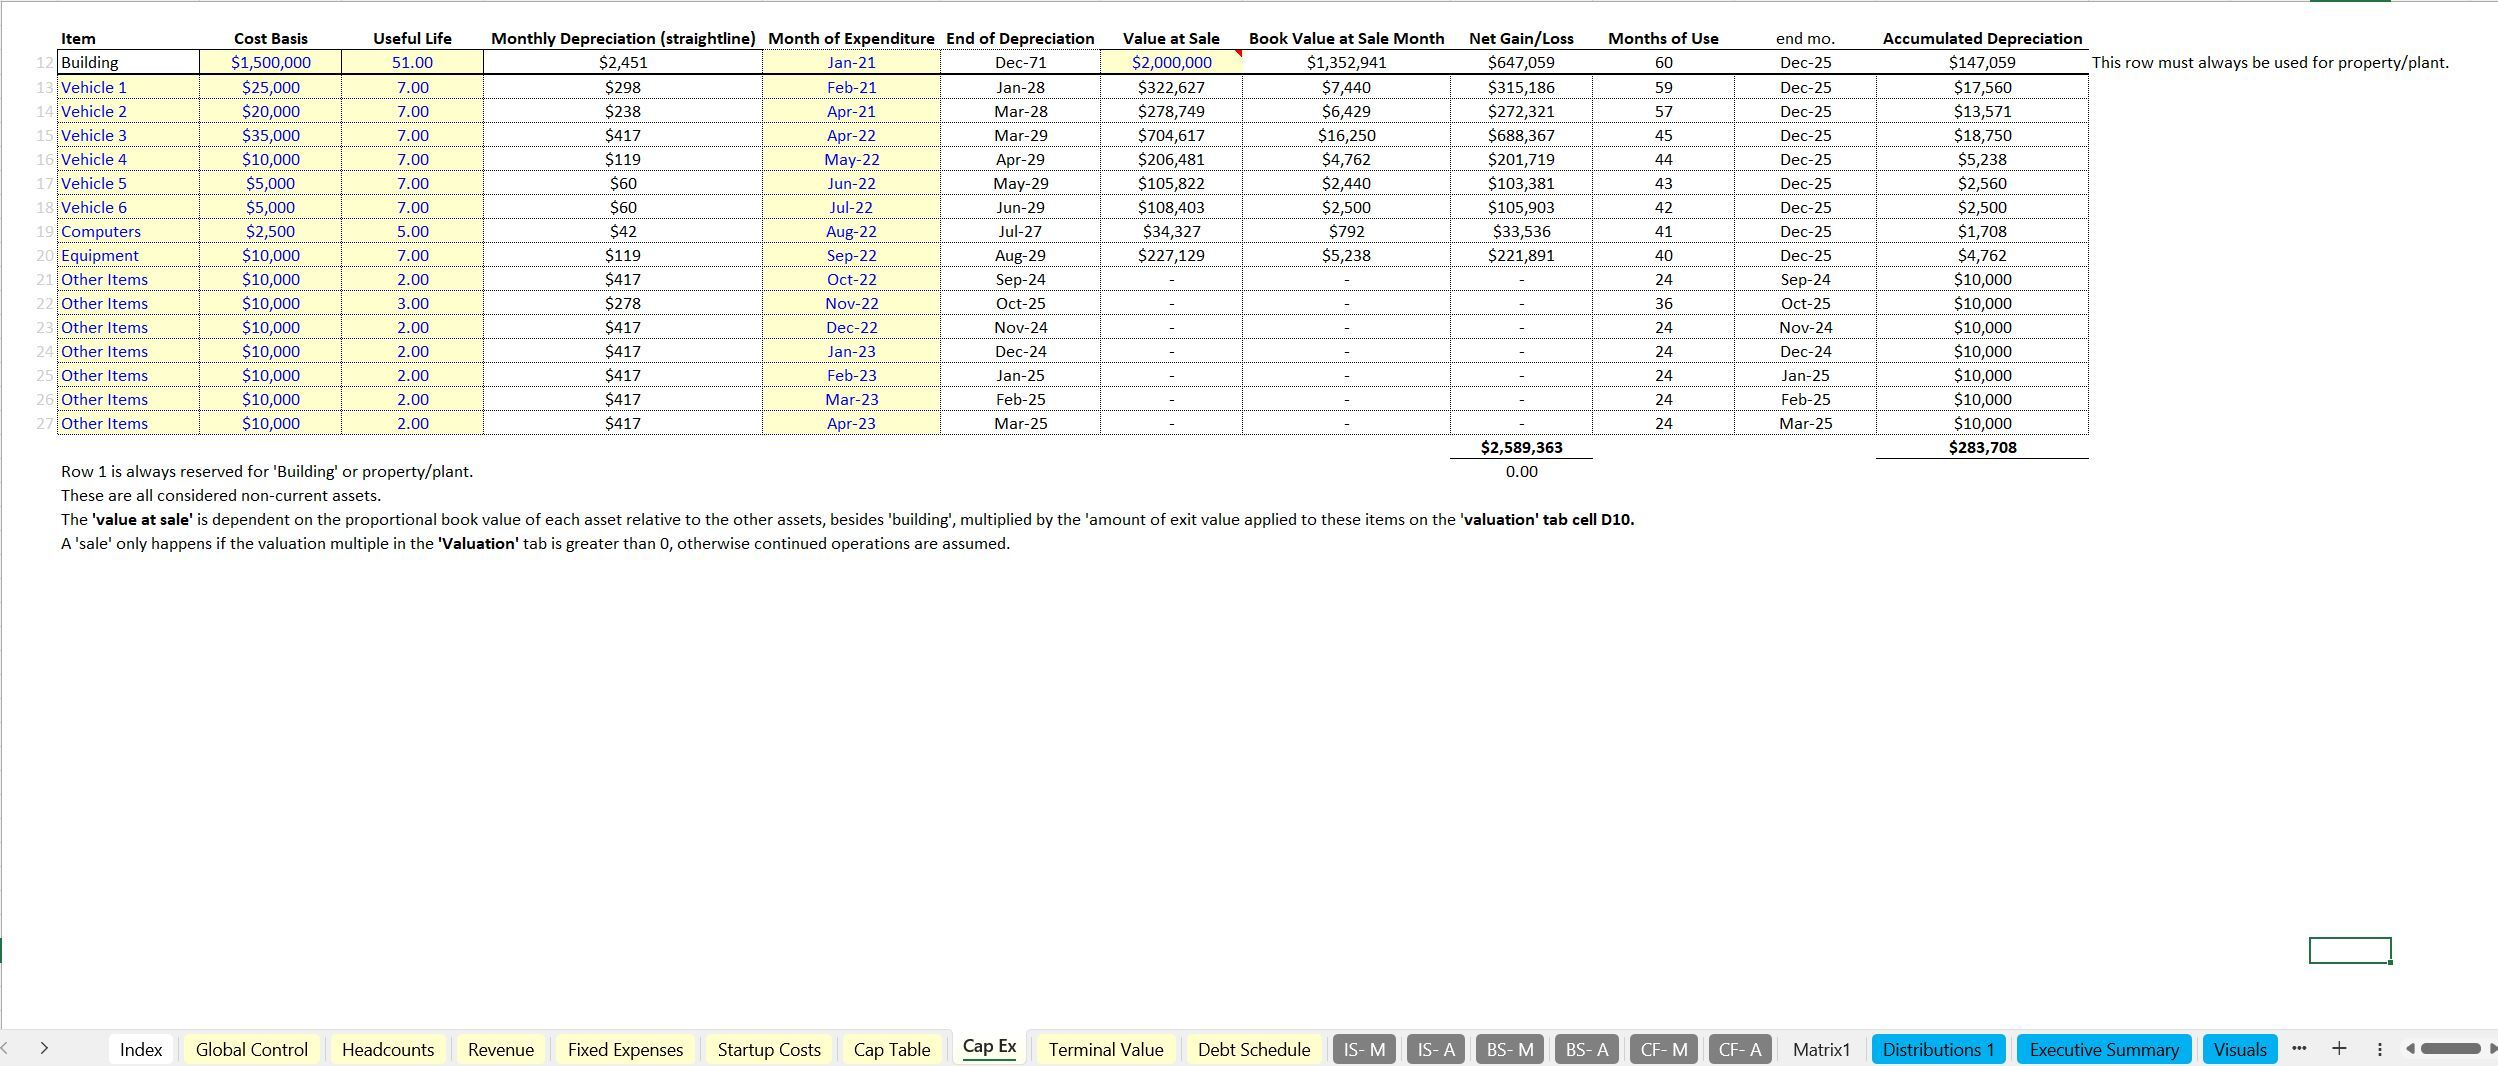
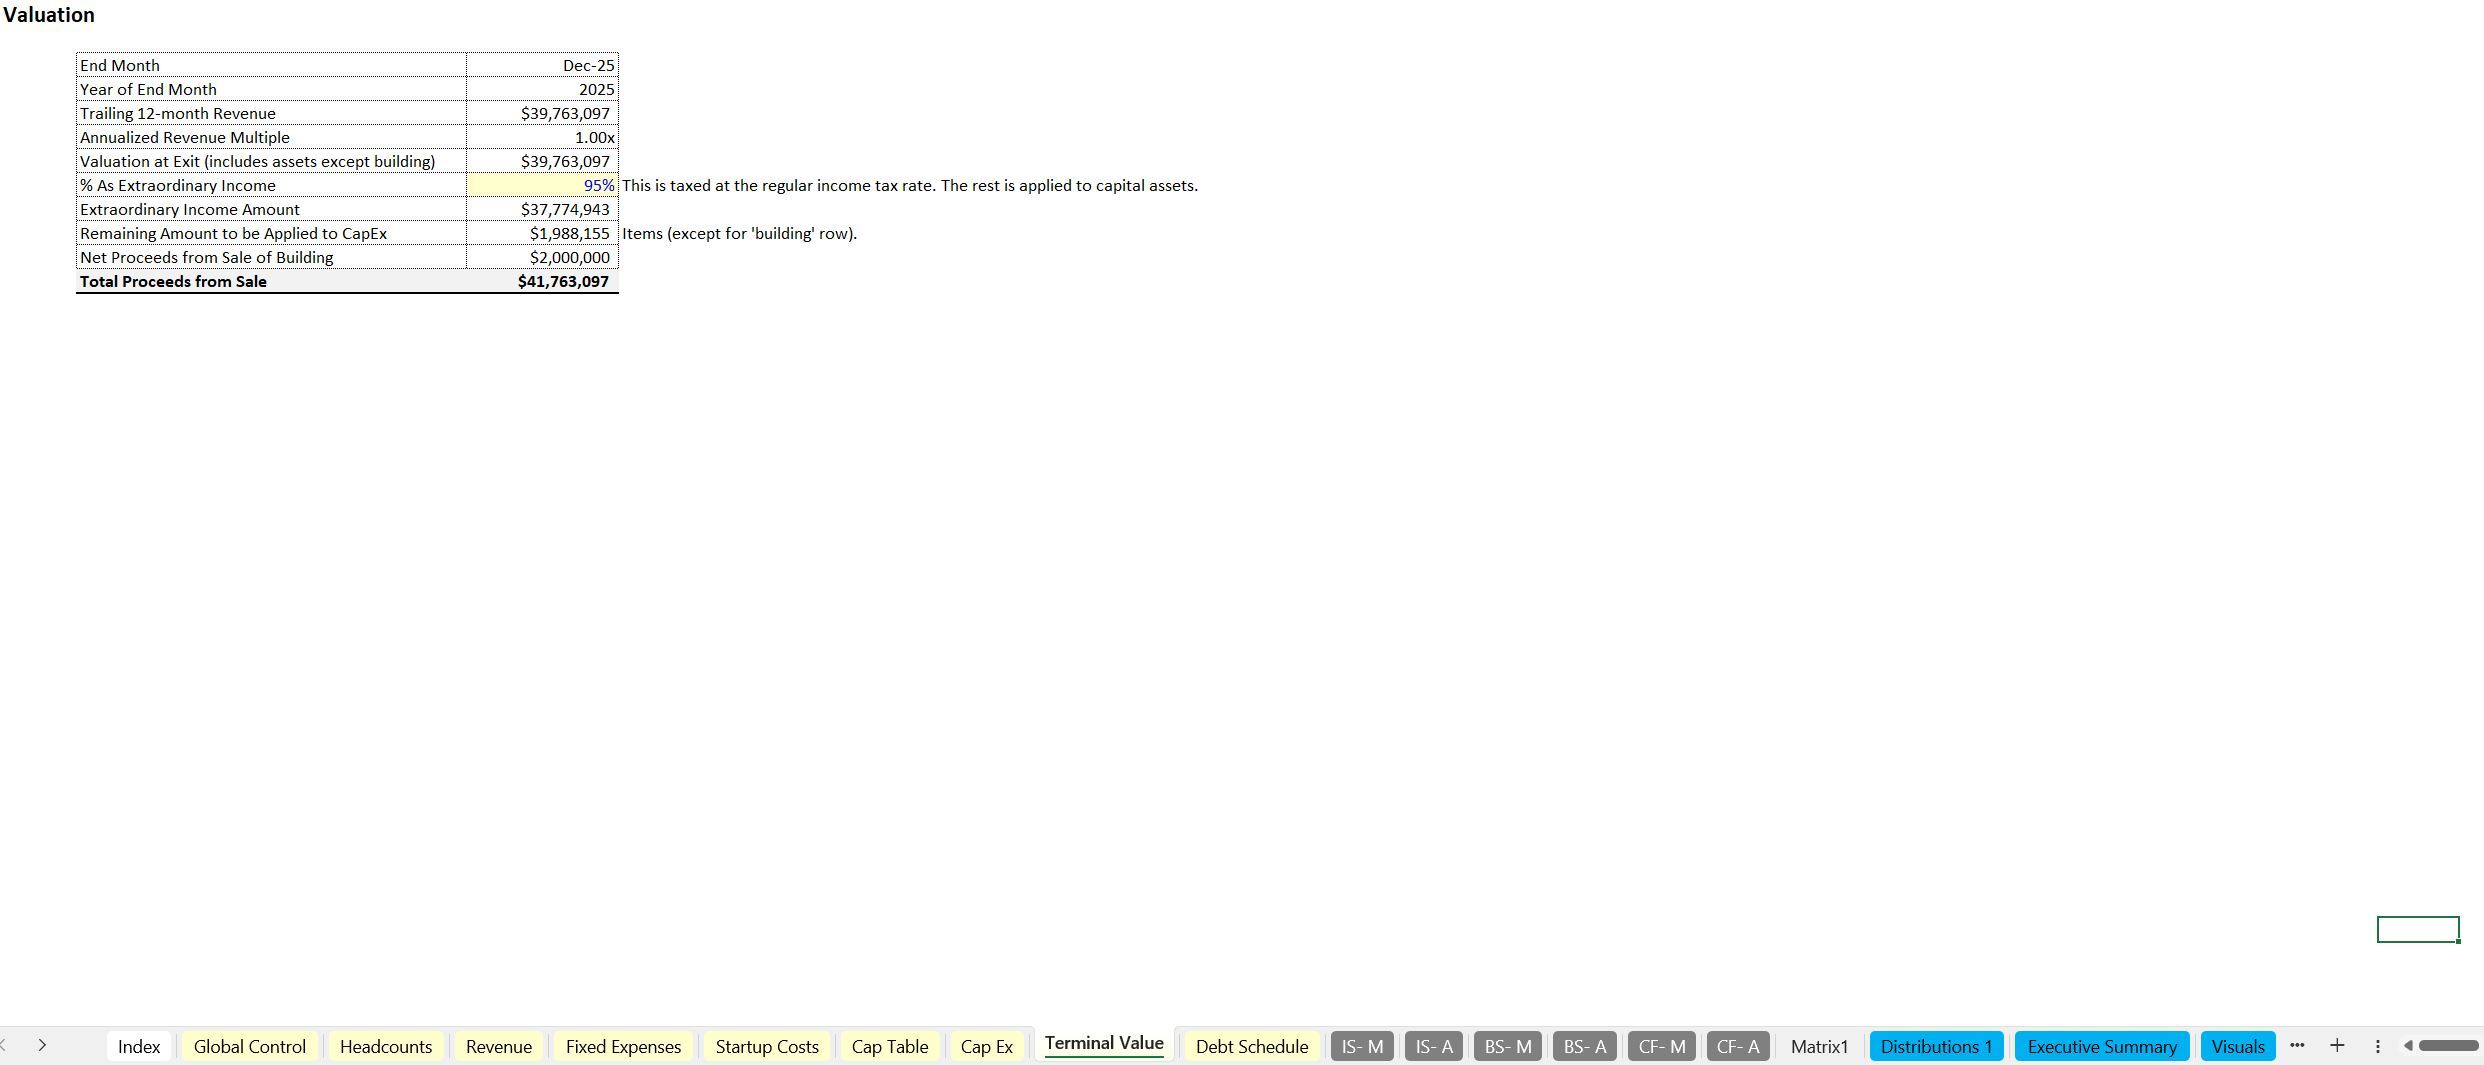
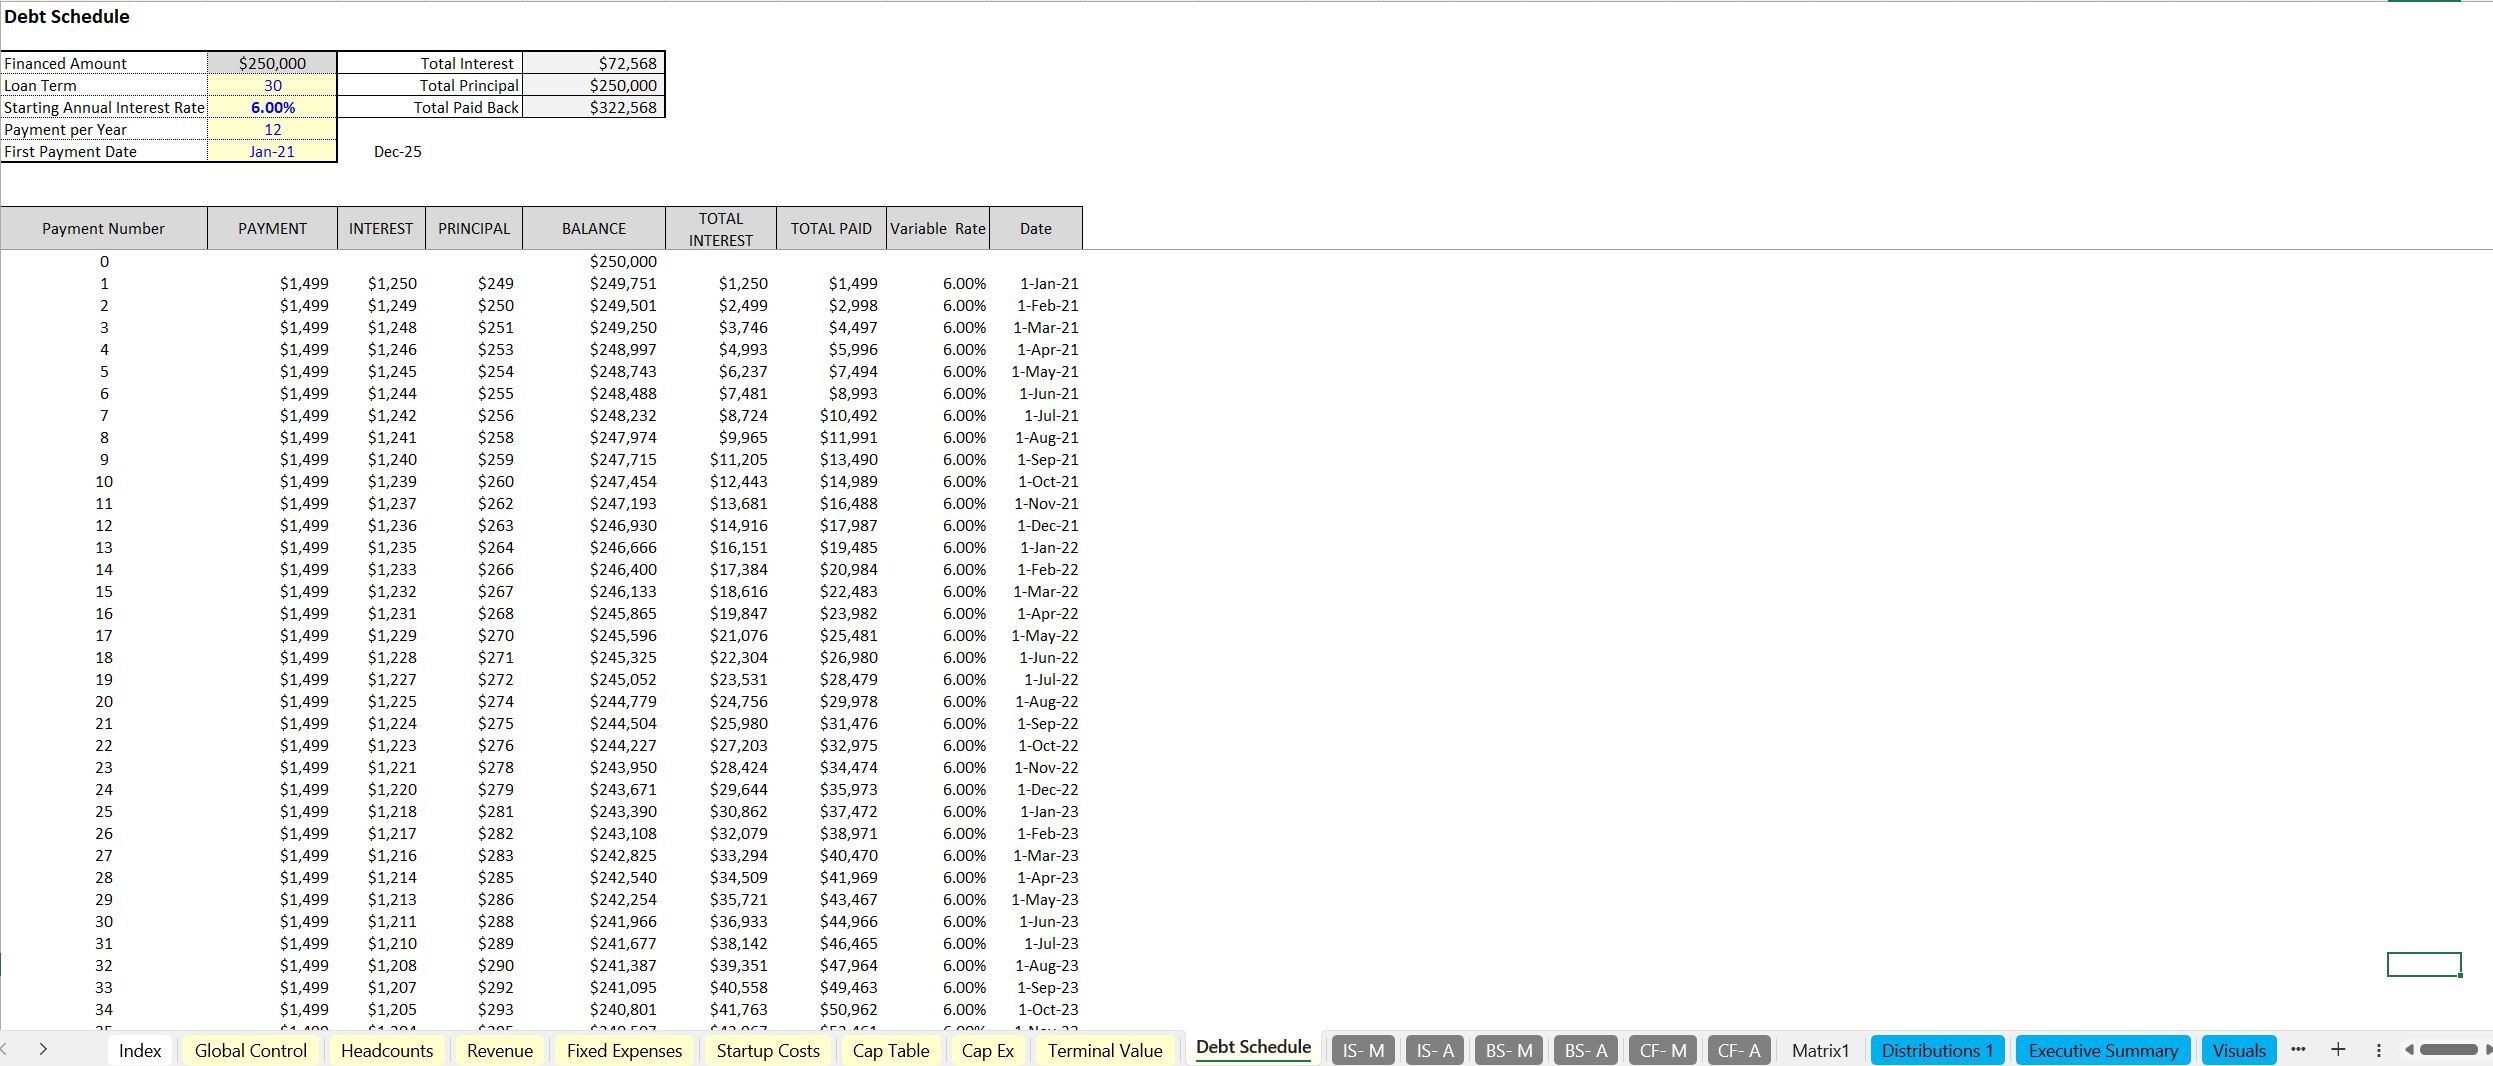
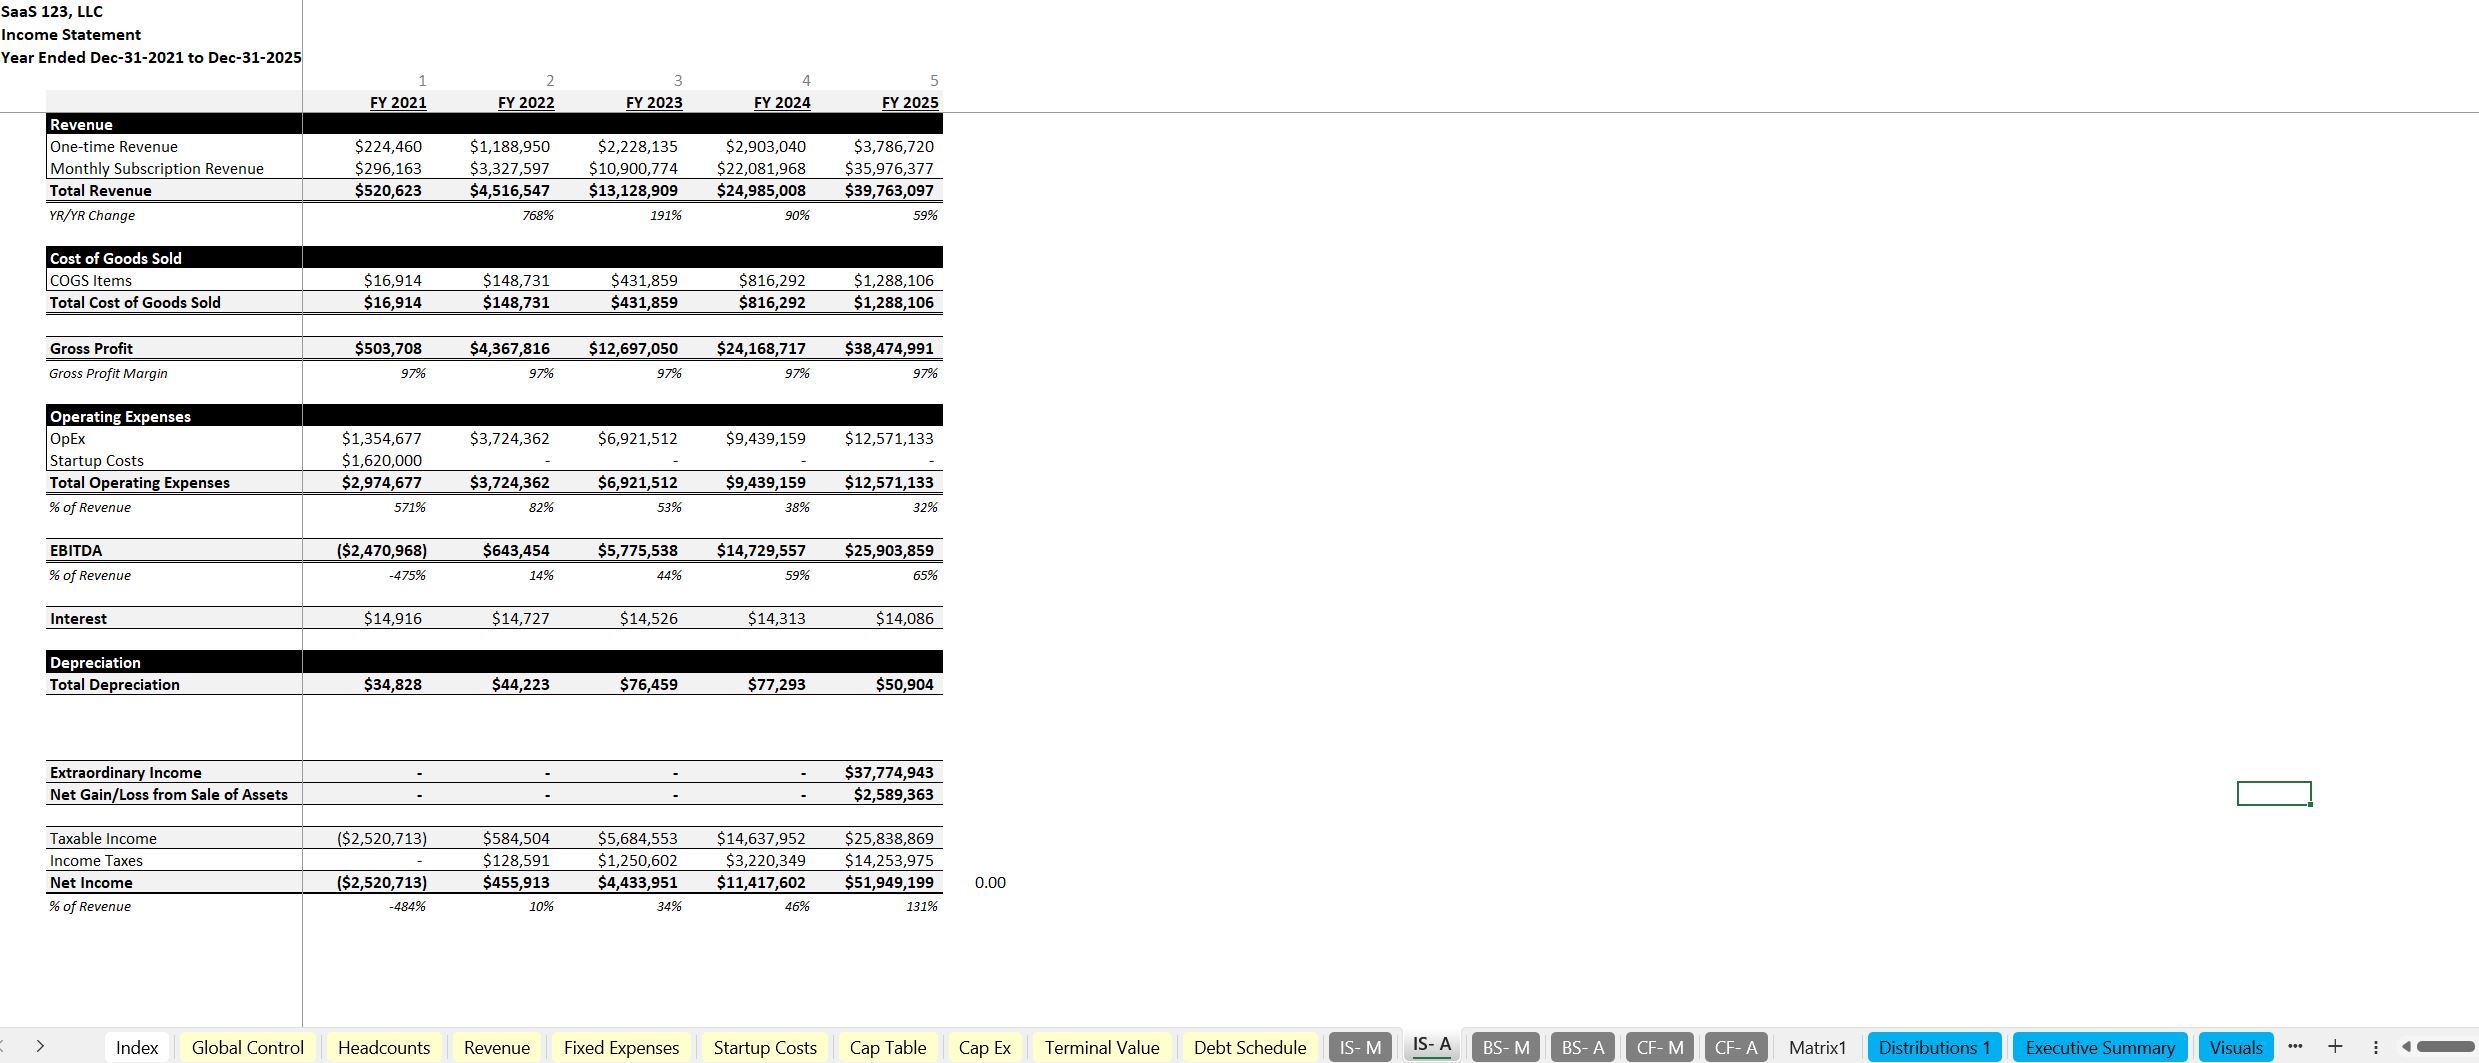
This is a general 5-year SaaS financial model that runs on assumptions that determine ratios as well as deal quotas. 3-Statement model and cap table.
Further information
Allow a user to build a 5-year financial plan for a SaaS business.
Models that rely more on Account Executives to attain new users.
Models that don't rely on Account Executives to grow.
